 Triplex
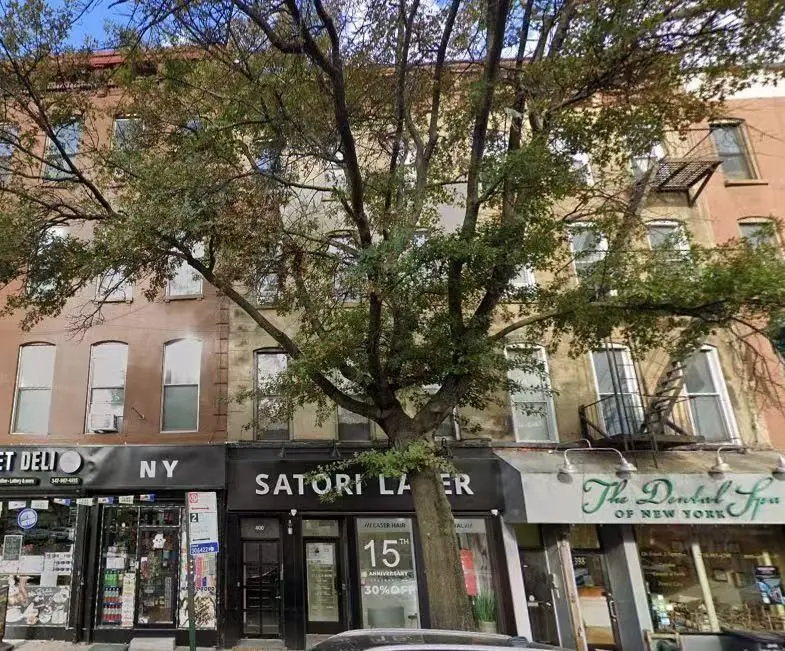
400 5th Ave · New York, NY
Flood risk No data
- FEMA flood zone
- —
- Chance of flooding over 30 yrs
- —
- Est. flood insurance / yr
- —
Fire risk No data
- Est. fire insurance / yr
- —
Heat risk No data
- Hot days now (above threshold)
- —
- Hot days in 30 yrs
- —
Wind risk No data
- Chance of severe wind over 30 yrs
- —
Air-quality risk No data
- Unhealthy air days now
- —
- Unhealthy air days in 30 yrs
- —
Risk factors via First Street. Map © Google.
Why this score? — see what drove the D grade
The composite is a weighted blend of 9 inputs, each scored 0–100. Each bar is that input's sub-score; the figure is the points it added to the 100-point composite (weight × sub-score).
- Appreciation +10.0/10.0
- Cash flow +7.7/30.0
- Schools +5.0/10.0
- ARV discount +4.1/15.0
- Rent growth +3.9/5.0
- Livability +3.8/5.0
- Condition / age +2.5/5.0
- 1% rule +2.3/10.0
- DSCR +1.8/10.0
$3,350,000
🖨 Deal sheet (PDF) 📄 Offer letter ✓ Due diligence
Multi-family units
County records classify this as Multi-Family (2-4 Unit). Listing-text estimate: 3 units. confirmed
Listing remarks
Well-maintained 3-family property featuring a one-store structure with a building size of 20×50 on a 20×80 lot. Each unit offers a spacious 3-bedroom layout, providing strong rental income potential. Ideal for both investors and end-users seeking steady cash flow in a convenient location.
Key facts
- 1,600 sq ft lot
- Built 1920
- Listed 81 days
Property features AI
Finance
- Other: Zoning: R6A
- Financial info: Financing available: bank mortgage or cash; Income detail (current rents): Unit 1 $8,275; Unit 2 $4,500; Unit 3 $4,400; Unit 4 $65
Exterior
- Parking: Other parking
- Utilities: 110V electric; Gas hot water; Gas heating
- Home design: Mixed-use property; Attached building
- Construction: Brick exterior; Flat roof; Poured concrete foundation; Building footprint approximately 1,000 (50' x 20'); Built as an attached structure
- Exterior features: Back yard
Interior
- Bedrooms: Unit 2: 3 bedrooms (1st floor); Unit 3: 3 bedrooms (2nd floor); Unit 4: 3 bedrooms (3rd floor)
- Flooring: Hardwood floors; Tile floors; Other flooring (see remarks)
- Bathrooms: Unit 2: 1 full bath; Unit 3: 1 full bath; Unit 4: 1 full bath
- Heating & cooling: Gas-fired hot water heat; Hot water heat delivery; 110V electric
- Interior features: Finished full basement; Hardwood floors; Tile floors; Other flooring (see remarks)
Neighborhood map
What this means for you Summary
Snapshot
- This is a 3 × 3-bed/1.0-bath units multifamily listed at $3.35M.
Deal economics
- At list price, monthly cash flow is $-4k ($-47k/yr) — negative. Per door: $-1k/mo.
- To cash-flow at today's rent, offer at most $2.78M (16.9% below list).
- To meet the 1% rule (rent ≥ 1% of price), the offer needs to be $2.43M (27.3% below list).
- Recommended offer: $2.43M (27.3% below list) — sets the bar for 1% rule.
- Cap rate 4.9% vs local median 2.6% in New York — top-decile yield for the area; either an underpriced asset or a hidden risk that comps aren't pricing in. Stress-test before assuming the spread holds.
Location & tenants
- Location reads 75/100 on livability (#268 in NY, #4,188 nationally) — a middle-class / working-renter tenant base. Strengths: amenities A+, commute A+, health & safety A; Watch: crime F, cost of living F.
- Zoned schools: Elm Tree Elementary School (math 27% / reading 52%, grade F, #1,444 of 2,108 statewide, top 71%, 806 students, 94% FRL); Ms 51 William Alexander (math 67% / reading 92%, grade A+, #32 of 729 statewide, top 5%, 1,026 students, 61% FRL); Midwood High School (math 94% / reading 96%, grade A+, #83 of 1,100 statewide, top 8%, 4,062 students, 73% FRL).
- Market conditions: Rents rising fast (+5.7%/yr); 250 active listings in the ZIP; high-income renter base; 10,063 units permitted in Kings County in 2024 (9,789 in 5+ unit buildings).
- At $24,338/mo this rent would consume 157% of the median local household income ($186k/yr) (locally 2372% of renters already pay >50% of income on rent) — very limited rent-growth headroom before tenants either downsize or default.
Forward outlook
- In year one you build about $358k of equity ($23k loan paydown + $335k appreciation (10.0% local appreciation)).
- Kings County population projected at +13% by 2050 — modest demand growth; plan on rents tracking national, not racing it.
- By year 2, paydown + projected appreciation supports a ~$576k cash-out refi (75% LTV) — recoverable capital for the next deal without selling this one.
Negotiation context
- It's been on market 81 days — a 6% lower offer ($3.15M) is reasonable based on typical stale-listing flexibility.
Risks & watch-outs
- Watch-outs: built in 1920 — expect roof / HVAC / electrical / plumbing capex.
Questions for the listing agent
- What do current leases actually rent for vs. the listed asking? Can we see a recent rent roll and the last 12 months of T-12 income?
- It's been on market 81 days. Have you received any prior offers? Is the seller open to a 27% concession, seller financing, or rate buy-down credit?
- Can we see the unit-by-unit rent roll, current vacancy, and any below-market leases? What's the average tenancy length?
- What capital expenditures (roof, boiler, parking lot, exteriors) have been made in the last 5 years, and what's planned in the next 2?
- Built in 1920 — when were the roof, HVAC, electrical panel, plumbing, and water heater last replaced?
- Why hasn't it sold? Are there any deal-killer items the seller is aware of (foundation, flood, title, zoning, code violations)?
- Is there a deadline driving the sale (1031 exchange, divorce, estate, relocation)? That informs how much negotiation room exists.
- Schools are B-rated — typically a magnet for longer-tenancy family renters. What's the average tenant stay here, and is there a school-zone premium baked into asking?
- Crime grade is F in this area — have there been break-ins, vandalism, or insurance claims at this property in the last 3 years? What carrier currently insures it and at what premium?
- The area grade is low — what's the realistic commute time and amenity access for the typical tenant pool here? Any planned neighborhood developments (good or bad) we should know about?
- What's the average days-on-market for RENTAL listings here right now (not sales)? A rising rental-DOM trend means longer vacancies and softer asking-rent achievability than the comps imply.
- What's the recent tenant-quality profile in this submarket — average credit score on applications, eviction rate, late-payment / NSF rate, and stable-employment percentage? A property-management company in the area should have these aggregated.
- How much new apartment / multifamily construction is in the pipeline within 1–3 miles? Heavy new supply (>2% of stock underway) typically softens rents 12–24 months out; light construction supports rent growth.
Investment metrics
- 1% rule
- 0.73% ✗
- Cap rate
- 4.89%
- Cash-on-cash
- -5.02%
- DSCR
- 0.78
- GRM
- 11.5
CMA / ARV
- ARV (on-the-fly)
- $3,112,000
- Comps found
- 1
Show comp detail 1 sale within ~0.75 mi
| Address | Dist | Beds/Ba | Sqft | Sold | Price | $/sf | Match |
|---|---|---|---|---|---|---|---|
| 595 10th St | 0.44mi | 8/3.0 (-1) | 4,400 (+10%) | 16mo | $3,425,000 | $778 | 44 |
Match score weights: distance 35% · size 25% · config 20% · recency 20%. Top-matched comps best support the ARV.
Projected returns pro-forma
10.0% appreciation · 5.67% rent growth · sell at horizon
- IRR
- 21.5%
- Equity multiple
- 2.75×
- Total profit
- $1,642,065
- Equity at exit
- $3,017,945
- IRR
- 20.0%
- Equity multiple
- 6.53×
- Total profit
- $5,184,621
- Equity at exit
- $6,508,313
Cash invested: $938,000 (down + closing). Projections, not guarantees.
Landlord ↔ Tenant lean methodology
- Overall (CITY)
- 0 Strongly Tenant-Friendly
- State New York
- 15 Strongly Tenant-Friendly · D+10
- County
- — inherits STATE
- City New York
- 0 Strongly Tenant-Friendly · D+34
ZIP-level market 11215
- Home prices YoY
- 2.7%
- Rents YoY
- 5.7%
- Active inventory
- 250
- Price-to-rent
- 34.4×
Monthly cashflow live
- Estimated rent
- $24,338 high interval (Pro) →
- Mortgage (P&I)
- −$17,568
- Tax est. 1.5%
- −$4,188 /mo · $50,250/yr
- Insurance
- −$1,396
- HOA
- −$0
- Vacancy / Maint / Mgmt
- −$5,111
- Net cashflow
- $-3,924
Break-even live
Sensitivity live
| Price | -10% $-1,609 | -5% $-2,767 | +0% $-3,924 | +5% $-5,082 | +10% $-6,239 |
|---|---|---|---|---|---|
| Rent | -10% $-5,847 | -5% $-4,885 | +0% $-3,924 | +5% $-2,963 | +10% $-2,001 |
| Rate | -1.0pp $-2,237 | -0.5pp $-3,072 | base $-3,924 | +0.5pp $-4,792 | +1.0pp $-5,675 |
3-unit breakdown (identical units grouped — click to expand)
| Units | Beds | Baths | Est. rent |
|---|---|---|---|
| 3× units | 3 | 1 | $24,339 |
| #1 | 3 | 1 | $8,113 |
| #2 | 3 | 1 | $8,113 |
| #3 | 3 | 1 | $8,113 |
| Total (3 units) | $24,338 | ||
UW: 25.0% down · 7.5% · 30yr · 1.5% tax · 5.0% vac · 8.0% maint · 8.0% mgmt
Financing live
Cash to close
- Down payment
- $837,500
- Closing costs
- $100,500
- Reserves months
- —
- Total cash needed
- —
Loan-product check · same deal, 3 products live
Conventional
25% down · 7.5% · 30yr
- Down + closing
- —
- Monthly P&I
- —
- Monthly cashflow
- —
- DSCR
- —
- Eligible?
- —
Personal DTI + credit; lowest rate.
DSCR
20% down · 8.5% · 30yr
- Down + closing
- —
- Monthly P&I
- —
- Monthly cashflow
- —
- DSCR
- —
- Eligible?
- —
No personal income docs; deal must DSCR.
Hard money
10% down · 12.0% · 12mo
- Down + closing
- —
- Monthly P&I
- —
- Monthly cashflow
- —
- DSCR
- —
- Eligible?
- —
Short-term bridge; refi at stabilization.
Listing history 14 events
-
2026-06-21days on market $3,350,000 Active 81 DOM
-
2026-06-18days on market $3,350,000 Active 78 DOM
-
2026-06-17days on market $3,350,000 Active 77 DOM
-
2026-06-15days on market $3,350,000 Active 75 DOM
-
2026-06-13days on market $3,350,000 Active 73 DOM
-
2026-06-10days on market $3,350,000 Active 69 DOM
-
2026-06-08days on market $3,350,000 Active 68 DOM
-
2026-06-08days on market $3,350,000 Active 67 DOM
-
2026-06-04days on market $3,350,000 Active 64 DOM
-
2026-06-03days on market $3,350,000 Active 63 DOM
-
2026-06-01days on market $3,350,000 Active 61 DOM
-
2026-05-31days on market $3,350,000 Active 60 DOM
-
2026-04-02price $3,350,000
-
2026-04-01$3,300,000 Active
ⓘ Source: listings_history table (triggers on properties + properties_extension) + one-shot
backfill from property_details.listing_events for pre-trigger history.
Nearby sold comps map
Loading sold comps map…
Walkable amenities ~0.75 mi
Loading nearby amenities…
Taxation est. · year 1
- Rental income
- $292,056
- − Mortgage interest
- −$187,652
- − Property taxes
- −$50,250
- − Insurance
- −$16,750
- − Repairs & maintenance
- −$23,364
- − Management
- −$23,364
- − Depreciation
- −$97,455
- Taxable loss
- −$106,780
- Est. tax savings @ 24.0%
- +$25,627
- After-tax cash flow
- $-21,462/yr
For passive investors: Depreciation is non-cash, so a rental often shows a tax loss while cash-flowing — sheltering income. Rental losses are passive: they offset passive income freely, and up to $25,000/yr can offset ordinary (W-2) income if you actively participate and your MAGI is under $100k (phasing out to $0 by $150k); unused losses carry forward. On sale, claimed depreciation is recaptured at up to 25%, and gains may owe capital-gains tax (a 1031 exchange can defer both). Figures are a year-1 estimate at your 24.0% rate — not tax advice; consult a CPA.
Schools (NCES district)
No district data.
Livability — New York
- Score
- 75/100
- State rank
- #268
- US rank
- #4188
Category grades
Schools grade is shown separately in the Schools card above.
Census & demographics
- Census place
- New York, NY
- County
- Kings County · 2,614,986 people
- City population
- 7,731,280
- Metro
- New York-Newark-Jersey City, NY-NJ-PA
- Population (ZIP)
- 70,441
- Household income
- $185,865
- Rent vs Own
- Severe rent burden
- 2372.0
Population outlook (Kings County) Hauer SSP2
- Today (2025)
- 2,847,441 people
- By 2030
- 2,937,006 · +3.1%
- By 2040
- 3,095,491 · +8.7%
- By 2050
- 3,228,968 · +13.4%
- By 2075
- 3,321,723 · +16.7%
- By 2100
- 3,111,387 · +9.3%
Race, ethnicity, and origin ACS 2023
- Neighborhood character
- Predominantly White (67%)
- Race & ethnicity
- White 67% Hispanic / Latino 15% Two or more races 11% Asian 9% Black 3%
- Hispanic origin (detail)
- Mexican 3% Puerto Rican 3%
- Common ancestry
- Romanian 5% Scotch-Irish 5% Italian 3%
- Foreign-born
- 18% · Canada, China, Jamaica
- Languages at home
- 76% English-only · Spanish 9% Other Indo-European 4% Chinese 2%
Political lean MEDSL · Kings
- 2024 margin
- Solid D (+44.0) · D 72.0% · R 28.0%
- 2008→2024 swing
- -15.5pp toward R · 2008: 59.4pp · 2024: 44.0pp
- All cycles
- 2024: D+44.0 2020: D+54.8 2016: D+61.8 2012: D+63.9 2008: D+59.4
Not yet ingested
- Civics
- —
Market trends
- HPI YoY
- ▲ 11.03%
- Current HPI
- 417.4151
- Rent YoY
- ▲ 5.67%
- Metro
- New York-Newark-Jersey City, NY-NJ-PA
- State GDP YoY
- ▲ 2.60%
- F500 in state
- 92
Industry mix (Fortune 500 HQ in NY)
| Industry | F500 HQs | Revenue |
|---|---|---|
| Financial Services | 10 | $950B |
|
||
| Consumer Goods | 9 | $162B |
|
||
| Insurance | 4 | $225B |
|
||
| Telecommunications | 2 | $144B |
|
||
| Pharmaceuticals | 2 | $112B |
|
||
| Media / Entertainment | 2 | $69B |
|
||
Price history
+1.5% since first listed2 events — show timeline
- 2026-04-02 Price Changed $3,350,000 BNYMLS
- 2026-04-01 Listed $3,300,000 BNYMLS
Cash-flow waterfall
monthlySold comps — $/sqft
last 12 mo · ≤1 miLoading sold comps…