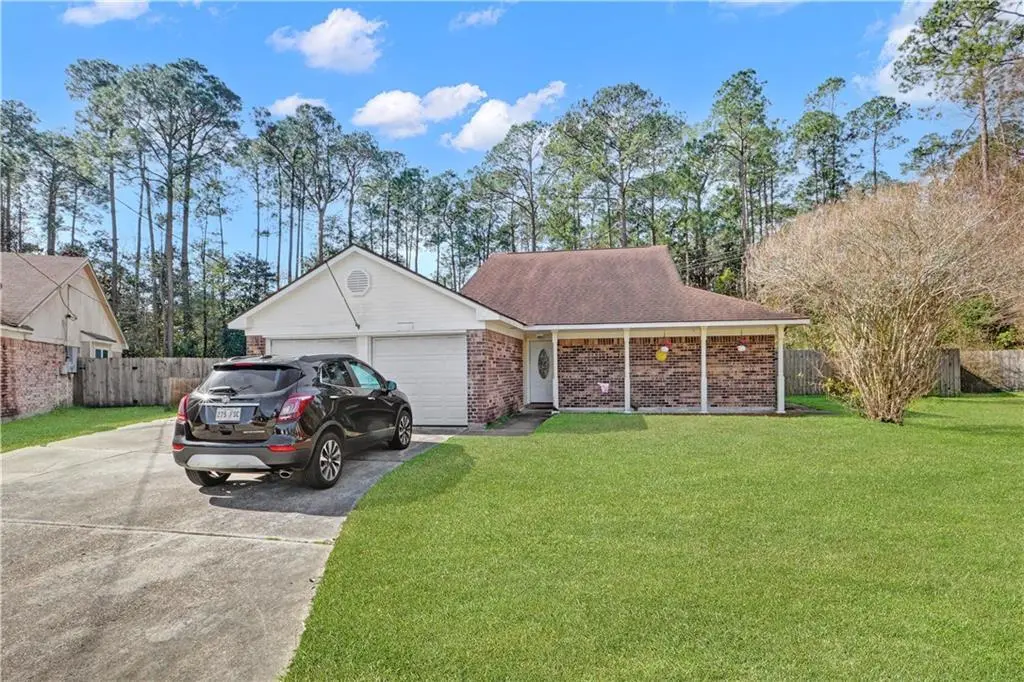
523 Drury Ln · Slidell, LA
Flood risk 7/10 · Major
- FEMA flood zone
- X (shaded)
- Chance of flooding over 30 yrs
- 0.74%
- Est. flood insurance / yr
- $507 – $1,088
Fire risk 5/10 · Moderate
- Est. fire insurance / yr
- $1,269 – $2,357
Heat risk 10/10 · Severe
- Hot days now (above 108°F)
- 7 days/yr
- Hot days in 30 yrs
- 21 days/yr
Wind risk 9/10 · Severe
- Chance of severe wind over 30 yrs
- 99.0%
Air-quality risk 2/10 · Minimal
- Unhealthy air days now
- 1 days/yr
- Unhealthy air days in 30 yrs
- 2 days/yr
Risk factors via First Street. Map © Google.
Why this score? — see what drove the C grade
The composite is a weighted blend of 9 inputs, each scored 0–100. Each bar is that input's sub-score; the figure is the points it added to the 100-point composite (weight × sub-score).
- Cash flow +20.8/30.0
- ARV discount +10.0/15.0
- DSCR +6.6/10.0
- 1% rule +4.3/10.0
- Schools +4.3/10.0
- Rent growth +4.0/5.0
- Livability +3.5/5.0
- Condition / age +2.5/5.0
- Appreciation +0.0/10.0
$215,000
🖨 Deal sheet 📄 Offer letter ✓ Due diligence
Listing remarks MLS
Spacious partially renovated home on a large Cul de Sac lot in Huntwyck . All on one level. 2 car attached garage. All tile flooring. Primary Bedroom is set off the foyer by itself. The other 3 bedrooms are down the hallway . Nice open den area to the Kitchen . Separate formal dining space or could be a home office. Some renovations done in kitchen and baths. Granite counters in Kitchen with tiled backsplash. Covered rear porch leads to a huge fenced yard with a shed.
Key facts
- Formal dining space
- Open den area
- Tile flooring
Tags
Neighborhood map
What this means for you Summary
Snapshot
- This is a 4-bed/2.0-bath single-family listed at $215k.
Deal economics
- At list price, monthly cash flow is $227 ($3k/yr) — positive.
- The deal already cash-flows at list — no discount required.
- To meet the 1% rule (rent ≥ 1% of price), the offer needs to be $200k (6.9% below list).
- Recommended offer: $189k (12.0% below list) — sets the bar for market timing.
- Cap rate 7.9% vs local median 5.9% in Slidell — top-decile yield for the area; either an underpriced asset or a hidden risk that comps aren't pricing in. Stress-test before assuming the spread holds.
Location & tenants
- Location reads 70/100 on livability (#57 in LA) — a middle-class / working-renter tenant base. Strengths: cost of living A+, housing A+, health & safety A+; Watch: amenities F, commute F.
- St. Tammany Parish (suburban): math 43% / reading 55% proficiency, ranked #11 of 98 in LA (top 11%) — families likely to look elsewhere, expect single-tenant / working-renter base with shorter leases.
- Market conditions: Rents rising fast (+5.9%/yr); 241 active listings in the ZIP; 7 comparable units currently listed for rent nearby; rentals lingering (median 44d on market — plan ~5-8 weeks vacancy on turnover, expect pricing pressure); 71% of comp listings sitting > 30 days — soft ceiling on asking rent; 1,064 units permitted in St. Tammany Parish in 2024 (0 in 5+ unit buildings).
- This rent runs 38% of the median local income ($63k/yr) — at the standard rent-burdened threshold; future hikes will face affordability resistance.
Forward outlook
- Local home prices are declining (-3.0%/yr); year-one equity from $1k of loan paydown is wiped out by about $6k of value loss. Plan a longer hold.
- St. Tammany County population projected at +27% by 2050 — long-run rental-demand tailwind backs the buy-and-hold thesis.
Negotiation context
- It's been on market 135 days — a 12% lower offer ($189k) is reasonable based on typical stale-listing flexibility.
- 18 sale attempts since 30y ago with the ask held roughly flat each time — persistent listings suggest the price (not the market) is what's stuck; bring a comps-based counter.
- Current owner paid $80k; list at $215k implies a 169% gain — meaningful room to come down on a strong offer.
Risks & watch-outs
- Watch-outs: flood insurance adds $66/mo.
- Climate carrying-cost: major flood risk; severe wind risk, 99% chance of damaging wind over 30y; moderate wildfire risk; extreme-heat days projected 7→21/yr by 2055 (HVAC capex compounding) — expect insurance premiums to compound above CPI over the hold.
Questions for the listing agent
- It's been on market 135 days. Have you received any prior offers? Is the seller open to a 12% concession, seller financing, or rate buy-down credit?
- What's the actual annual flood-insurance premium (NFIP or private), and is the property in a SFHA with mandatory coverage?
- What does the HOA fee cover, when was the last increase, and are there any pending special assessments or reserve-fund shortfalls?
- Why hasn't it sold? Are there any deal-killer items the seller is aware of (foundation, flood, title, zoning, code violations)?
- Is there a deadline driving the sale (1031 exchange, divorce, estate, relocation)? That informs how much negotiation room exists.
- Schools are B-rated — typically a magnet for longer-tenancy family renters. What's the average tenant stay here, and is there a school-zone premium baked into asking?
- What's the average days-on-market for RENTAL listings here right now (not sales)? A rising rental-DOM trend means longer vacancies and softer asking-rent achievability than the comps imply.
- What's the recent tenant-quality profile in this submarket — average credit score on applications, eviction rate, late-payment / NSF rate, and stable-employment percentage? A property-management company in the area should have these aggregated.
- How much new for-sale + rental construction is in the pipeline within 1–3 miles? Heavy new supply typically softens prices + rents 12–24 months out; constrained supply supports both.
Investment metrics
- 1% rule
- 0.93% ✗
- Cap rate
- 7.93%
- Cash-on-cash
- 5.85%
- DSCR
- 1.26
- GRM
- 9.0
CMA / ARV
- ARV (median comp)
- $227,687
- List price
- $215,000
- Delta
- -5.57%
- Verdict
- FAIR
- Comps
- 20 within 1.0 mi
Show comp detail 12 sales within ~0.75 mi
| Address | Dist | Beds/Ba | Sqft | Sold | Price | $/sf | Match |
|---|---|---|---|---|---|---|---|
| 313 Westminster Dr | 0.45mi | 4/2.0 | 1,600 (+4%) | 2mo | $210,000 | $131 | 70 |
| 217 Portsmouth Dr | 0.56mi | 4/2.0 | 1,576 (+3%) | 2mo | $220,000 | $140 | 67 |
| 320 Holmes Dr | 0.44mi | 3/2.0 (-1) | 1,486 (-3%) | 4mo | $185,000 | $124 | 66 |
| 35378 Liberty Dr | 0.29mi | 3/2.0 (-1) | 1,411 (-8%) | 3mo | $240,000 | $170 | 65 |
| 211 Holmes Dr | 0.56mi | 3/2.0 (-1) | 1,560 (+2%) | 3mo | $235,000 | $151 | 63 |
| 205 Drury Ln | 0.65mi | 4/2.0 | 1,485 (-3%) | 2mo | $219,900 | $148 | 62 |
| 319 Westminster Dr | 0.42mi | 3/2.0 (-1) | 1,648 (+7%) | 2mo | $228,500 | $139 | 61 |
| 213 Drury Ln | 0.61mi | 3/2.0 (-1) | 1,588 (+4%) | 1mo | $191,000 | $120 | 60 |
| 222 Queen Anne Dr | 0.62mi | 3/2.0 (-1) | 1,479 (-4%) | 4mo | $176,500 | $119 | 57 |
| 209 Drury Ln | 0.63mi | 3/2.0 (-1) | 1,470 (-4%) | 3mo | $171,000 | $116 | 56 |
| 201 Drury Ln | 0.67mi | 3/2.0 (-1) | 1,648 (+7%) | 2mo | $170,000 | $103 | 50 |
| 35521 Devon Dr | 0.60mi | 3/2.0 (-1) | 1,322 (-14%) | 3mo | $205,000 | $155 | 42 |
Match score weights: distance 35% · size 25% · config 20% · recency 20%. Top-matched comps best support the ARV.
Projected returns pro-forma
-3.0% appreciation · 5.91% rent growth · sell at horizon
- IRR
- -6.3%
- Equity multiple
- 0.76×
- Total profit
- $-14,402
- Equity at exit
- $32,057
- IRR
- 6.4%
- Equity multiple
- 1.53×
- Total profit
- $32,140
- Equity at exit
- $18,589
Cash invested: $60,200 (down + closing). Projections, not guarantees.
Landlord ↔ Tenant lean methodology
- Overall (STATE)
- 90 Strongly Landlord-Friendly
- State Louisiana
- 90 Strongly Landlord-Friendly · R+12
- County
- — inherits STATE
- City
- — inherits STATE
ZIP-level market 70460
- Rents YoY
- 5.9%
- Active inventory
- 241
- Price-to-rent
- 9.0×
Monthly cashflow live
- Estimated rent
- $2,001 high interval (Pro) →
- Mortgage (P&I)
- −$1,127
- Tax from tax record
- −$63 /mo · $751/yr
- Insurance
- −$90
- Flood insurance flood zone
- −$66 /mo · $798/yr
- HOA
- −$8
- Vacancy / Maint / Mgmt
- −$420
- Net cashflow
- $227
Break-even live
UW: 25.0% down · 7.5% · 30yr · 1.5% tax · 5.0% vac · 8.0% maint · 8.0% mgmt
Financing live
Cash to close
- Down payment
- $53,750
- Closing costs
- $6,450
- Reserves months
- —
- Total cash needed
- —
Loan-product check · same deal, 3 products live
Conventional
25% down · 7.5% · 30yr
- Down + closing
- —
- Monthly P&I
- —
- Monthly cashflow
- —
- DSCR
- —
- Eligible?
- —
Personal DTI + credit; lowest rate.
DSCR
20% down · 8.5% · 30yr
- Down + closing
- —
- Monthly P&I
- —
- Monthly cashflow
- —
- DSCR
- —
- Eligible?
- —
No personal income docs; deal must DSCR.
Hard money
10% down · 12.0% · 12mo
- Down + closing
- —
- Monthly P&I
- —
- Monthly cashflow
- —
- DSCR
- —
- Eligible?
- —
Short-term bridge; refi at stabilization.
Rent comps 7 comps
| Address | Beds | Baths | Sqft | Rent | $/sqft | DOM | Units | Dist |
|---|---|---|---|---|---|---|---|---|
| 35363 Melody Ln Slidell, LA | 3.0 | 2.0 | 1510 | $1,800 | $1.19 | 43d | 1 | 0.11mi |
| 444 Holmes Dr Slidell, LA | 4.0 | 2.0 | 1594 | $1,800 | $1.13 | 44d | 1 | 0.16mi |
| 110 Charles Dr Slidell, LA | 4.0 | 2.0 | 2210 | $2,175 | $0.98 | 11d | 1 | 0.38mi |
| 35567 Liberty Dr Slidell, LA | 3.0 | 2.0 | 1232 | $1,650 | $1.34 | 44d | 1 | 0.58mi |
| 35621 Oak Ridge Ave Slidell, LA | 3.0 | 2.0 | 1406 | $1,800 | $1.28 | 43d | 1 | 0.91mi |
| 58019 Carroll Rd Slidell, LA | 4.0 | 2.0 | 1400 | $1,695 | $1.21 | 43d | 1 | 1.00mi |
| 1111 Saint Scholastica St Slidell, LA | 3.0 | 2.0 | 2037 | $2,000 | $0.98 | 23d | 1 | 1.38mi |
HOA detail
- Monthly dues
- $8 · $96/yr
Listing history 41 events
-
2026-06-18days on market $215,000 Active 135 DOM
-
2026-06-17days on market $215,000 Active 134 DOM
-
2026-06-16days on market $215,000 Active 133 DOM
-
2026-06-15days on market $215,000 Active 132 DOM
-
2026-06-13days on market $215,000 Active 130 DOM
-
2026-06-10days on market $215,000 Active 127 DOM
-
2026-06-09days on market $215,000 Active 126 DOM
-
2026-06-08days on market $215,000 Active 125 DOM
-
2026-06-07days on market $215,000 Active 124 DOM
-
2026-06-03days on market $215,000 Active 120 DOM
-
2026-06-02days on market $215,000 Active 119 DOM
-
2026-06-01days on market $215,000 Active 118 DOM
-
2026-05-31days on market $215,000 Active 117 DOM
-
2026-01-02$215,000 Active 472-char remark
Show marketing remark (472 chars)
Spacious partially renovated home on a large Cul de Sac lot in Huntwyck . All on one level. 2 car attached garage. All tile flooring. Primary Bedroom is set off the foyer by itself. The other 3 bedrooms are down the hallway . Nice open den area to the Kitchen . Separate formal dining space or could be a home office. Some renovations done in kitchen and baths. Granite counters in Kitchen with tiled backsplash. Covered rear porch leads to a huge fenced yard with a shed.
-
2016-01-21soldstatus $80,000 Sold
-
2016-01-04status Under Contract
-
2015-12-16$94,000 Active
-
2015-12-16historical
-
2015-12-15$94,000
-
2015-09-19price $94,000
-
2015-06-20$110,000 Active
-
2015-06-17$94,000
-
2011-08-04soldstatus $79,000
-
2011-05-09$89,900
-
2011-05-09$89,900
-
2011-03-07soldstatus $75,000
-
2010-06-10$120,000
-
2010-06-10$120,000
-
2008-08-19$149,500
-
2008-08-19$149,500
-
2005-11-10soldstatus $116,000
-
2005-10-27soldstatus $116,000
-
2005-09-27$118,000
-
2005-09-27$118,000
-
2001-09-28soldstatus $94,500
-
2001-08-28$94,500
-
2001-08-28$94,500
-
1996-07-01soldstatus $78,900
-
1996-05-09$79,900
-
1996-05-09$79,900
ⓘ Source: listings_history table (triggers on properties + properties_extension) + one-shot
backfill from property_details.listing_events for pre-trigger history.
Tax reassessment forecast LA · Resets to sale price
- Current annual tax
- $751 · $63/mo
- Projected year-2 tax
- $1,182 · $99/mo
- Expected delta
- +$432/yr (+$36/mo · 57.5%)
ⓘ Screening estimate from a state-policy table — verify with the county assessor before closing.
Climate risk First Street
- Flood 7/10 Severe FEMA zone X (shaded) · 74% chance over 30 yrs
- Wildfire 5/10 Major
- Heat 10/10 Extreme 7 d/yr ≥108°F today · 21 d/yr by 30 yrs out
- Wind 9/10 Extreme 99% chance of damaging wind over 30 yrs
- Air quality 2/10 Low 1 unhealthy d/yr today · 2 by 30 yrs out
Nearby sold comps map
Loading sold comps map…
Walkable amenities ~0.75 mi
Loading nearby amenities…
Taxation est. · year 1
- Rental income
- $24,017
- − Mortgage interest
- −$12,043
- − Property taxes
- −$751
- − Insurance
- −$1,872
- − Repairs & maintenance
- −$1,921
- − Management
- −$1,921
- − HOA
- −$96
- − Depreciation
- −$6,255
- Taxable loss
- −$843
- Est. tax savings @ 24.0%
- +$202
- After-tax cash flow
- $2,926/yr
For passive investors: Depreciation is non-cash, so a rental often shows a tax loss while cash-flowing — sheltering income. Rental losses are passive: they offset passive income freely, and up to $25,000/yr can offset ordinary (W-2) income if you actively participate and your MAGI is under $100k (phasing out to $0 by $150k); unused losses carry forward. On sale, claimed depreciation is recaptured at up to 25%, and gains may owe capital-gains tax (a 1031 exchange can defer both). Figures are a year-1 estimate at your 24.0% rate — not tax advice; consult a CPA.
Schools (NCES district)
- District
- St. Tammany Parish
- NCES district ID
- 2201650
- Math proficiency
- 43% ▼ -32.00%
- Reading proficiency
- 55% ▼ -26.00%
- Median HH income
- $61,752
- Composite
- 43.04/100
- National rank
- #3098
- State rank
- #11 of 98 in LA
Livability — Slidell
- Score
- 70/100
- State rank
- #57
- US rank
- #7673
Category grades
Schools grade is shown separately in the Schools card above.
Census & demographics
- County
- Saint Tammany Parish · 228,296 people
- City population
- 95,511
- Metro
- New Orleans-Metairie, LA
- Population (ZIP)
- 21,669
- Household income
- $62,565
- Rent vs Own
- Severe rent burden
- 318.0
Population outlook (St. Tammany County) Hauer SSP2
- Today (2025)
- 286,725 people
- By 2030
- 304,175 · +6.1%
- By 2040
- 336,203 · +17.3%
- By 2050
- 364,590 · +27.2%
- By 2075
- 433,362 · +51.1%
- By 2100
- 470,333 · +64.0%
Race, ethnicity, and origin ACS 2023
- Neighborhood character
- Diverse neighborhood (Simpson 0.62)
- Race & ethnicity
- White 53% Black 29% Two or more races 11% Hispanic / Latino 10% Pacific Islander 2%
- Hispanic origin (detail)
- Mexican 3%
- Common ancestry
- Lithuanian 13% Slovak 1% Italian 1%
- Foreign-born
- 5% · Canada
- Languages at home
- 92% English-only · Spanish 6%
Political lean MEDSL · St. Tammany
- 2024 margin
- Solid R (+43.8) · D 27.3% · R 71.1% · Other 1.6%
- 2008→2024 swing
- +9.6pp toward D · 2008: -53.4pp · 2024: -43.8pp
- All cycles
- 2024: R+43.8 2020: R+44.2 2016: R+50.8 2012: R+52.2 2008: R+53.4
Not yet ingested
- Civics
- —
Market trends
- HPI YoY
- ▼ -93.87%
- Current HPI
- 130.56
- Rent YoY
- ▲ 5.91%
- Metro
- New Orleans-Metairie, LA
- State GDP YoY
- ▲ 3.29%
- F500 in state
- 10
Industry mix (Fortune 500 HQ in LA)
| Industry | F500 HQs | Revenue |
|---|---|---|
| Telecommunications | 2 | $23B |
|
||
| Utilities | 1 | $12B |
|
||
| Wholesale / Distribution | 1 | $5B |
|
||
| Advertising | 1 | $2B |
|
||
Price history
+169.1% since first listed28 events — show timeline
- 2026-01-02 Listed $215,000 GSREIN
- 2026-01-02 Listed $215,000 AcadianaMLS
- 2016-01-21 Sold (MLS) $80,000 GSREIN
- 2016-01-04 Pending — GSREIN
- 2015-12-16 Listed $94,000 GSREIN
- 2015-12-16 Listing Removed — GSREIN
- 2015-12-15 Listed $94,000 AcadianaMLS
- 2015-09-19 Price Changed $94,000 GSREIN
- 2015-06-20 Listed $110,000 GSREIN
- 2015-06-17 Listed $94,000 AcadianaMLS
- 2011-08-04 Sold (MLS) $79,000 GSREIN
- 2011-05-09 Listed $89,900 AcadianaMLS
- 2011-05-09 Listed $89,900 GSREIN
- 2011-03-07 Sold (Public Records) $75,000 Public Records
- 2010-06-10 Listed $120,000 GSREIN
- 2010-06-10 Listed $120,000 AcadianaMLS
- 2008-08-19 Listed $149,500 GSREIN
- 2008-08-19 Listed $149,500 AcadianaMLS
- 2005-11-10 Sold (Public Records) $116,000 Public Records
- 2005-10-27 Sold (MLS) $116,000 GSREIN
- 2005-09-27 Listed $118,000 AcadianaMLS
- 2005-09-27 Listed $118,000 GSREIN
- 2001-09-28 Sold (MLS) $94,500 GSREIN
- 2001-08-28 Listed $94,500 GSREIN
- 2001-08-28 Listed $94,500 AcadianaMLS
- 1996-07-01 Sold (MLS) $78,900 GSREIN
- 1996-05-09 Listed $79,900 GSREIN
- 1996-05-09 Listed $79,900 AcadianaMLS
Property tax history
-7.9%/yrLatest (2025): $751 · -3.8% YoY. Source: county tax records.
Cash-flow waterfall
monthlySold comps — $/sqft
last 12 mo · ≤1 miLoading sold comps…