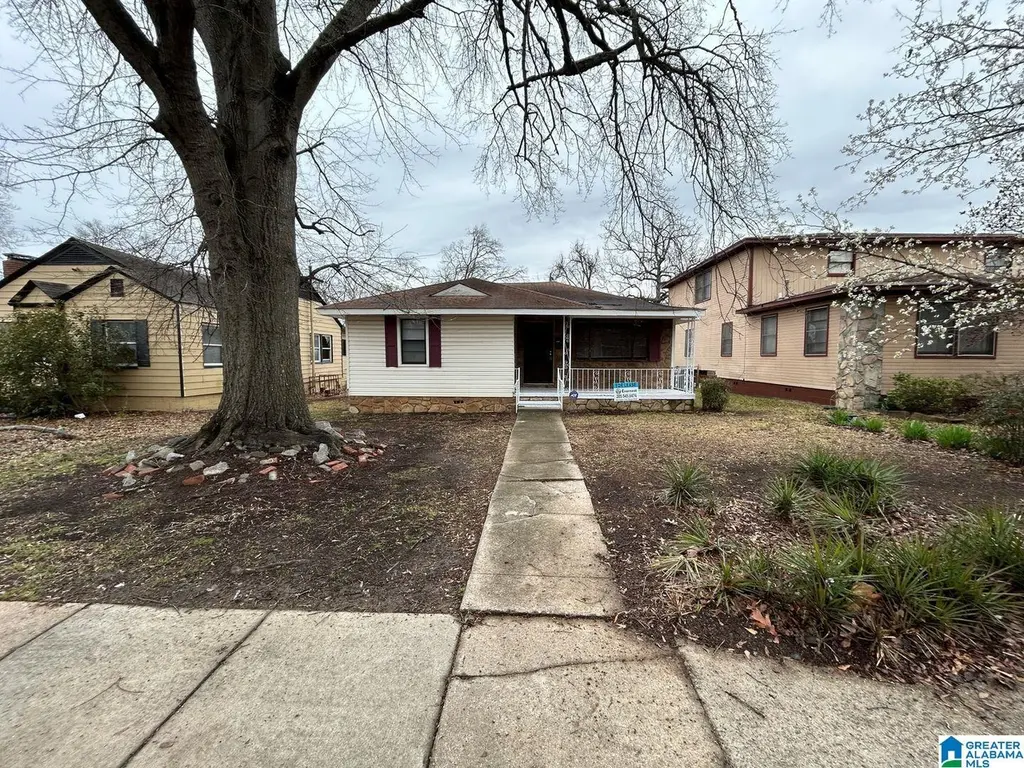
1820 Woodland Ave SW · Birmingham, AL
Flood risk 1/10 · Minimal
- FEMA flood zone
- X (unshaded)
- Chance of flooding over 30 yrs
- 0.0%
- Est. flood insurance / yr
- $507 – $1,088
Fire risk 1/10 · Minimal
- Est. fire insurance / yr
- $916 – $1,700
Heat risk 6/10 · Moderate
- Hot days now (above 106°F)
- 7 days/yr
- Hot days in 30 yrs
- 19 days/yr
Wind risk 6/10 · Moderate
- Chance of severe wind over 30 yrs
- 27.0%
Air-quality risk 4/10 · Minor
- Unhealthy air days now
- 5 days/yr
- Unhealthy air days in 30 yrs
- 5 days/yr
Risk factors via First Street. Map © Google.
Why this score? — see what drove the C grade
The composite is a weighted blend of 9 inputs, each scored 0–100. Each bar is that input's sub-score; the figure is the points it added to the 100-point composite (weight × sub-score).
- Cash flow +29.5/30.0
- DSCR +10.0/10.0
- 1% rule +8.0/10.0
- Livability +3.4/5.0
- Rent growth +2.5/5.0
- Condition / age +2.5/5.0
- Schools +0.9/10.0
- ARV discount +0.0/15.0
- Appreciation +0.0/10.0
$76,000
🖨 Deal sheet (PDF) 📄 Offer letter ✓ Due diligence
Listing remarks MLS
Take a look at this investment opportunity! Back on the market at no fault to the seller, this home has recently gone through inspection and appraisal! This is part of a 3-home portfolio offered together for $210,000. The possibilities and potential for these properties are endless. All properties are currently tenant occupied, and showings and inspection will be scheduled after the accepted offer. Please do not disturb the tenants. The current rent for this property is $685/month. All properties are being sold As Is. This is an awesome opportunity to add to your portfolio, which includes cash-flowing properties! Check out the other homes in this portfolio! MLS: 1357383, 1357379, 1357373
Key facts
- Covered front porch
- Fenced yard
- Electric hvac
Tags
Property features AI
Finance
- Other: Parcel ID: 29-00-08-1-001-006.000; Located in Oakwood Place subdivision; Property access via public road
- Financial info: Down payment assistance available
- HOA & community: No association fee
Exterior
- Parking: Off-street parking; On-street parking
- Security: No specific security features listed
- Utilities: Public water; Connected sewer; Gas water heater; Internet service available
- Home design: Existing structure; Siding (other) construction; Crawl space foundation; Single-story layout (all rooms listed at level 1)
- Construction: Siding-Other exterior; Crawl space foundation; Year built: existing (exact year not provided)
- Exterior features: Interior lot; No waterfront; No pool; No patio; No garden/patio; No decks
Interior
- Kitchen: Laminate countertops; Kitchen on main level
- Bedrooms: Two bedrooms on main level
- Flooring: Hardwood
- Bathrooms: One full bathroom (tub/shower combo)
- Heating & cooling: Central heating; Central cooling
- Interior features: Hardwood floors; Ceilings: Other (see remarks); No additional interior features listed
- Laundry & utility: No laundry details provided
Neighborhood map
What this means for you Summary
Snapshot
- This is a 2-bed/1.0-bath single-family listed at $76k.
Deal economics
- At list price, monthly cash flow is $273 ($3k/yr) — positive.
- The deal already cash-flows at list — no discount required.
- Meets the 1% rule at list price ($984 rent vs $76k).
- Recommended offer: $71k (6.0% below list) — sets the bar for market timing.
- Cap rate 10.6% vs local median 6.2% in Birmingham — top-decile yield for the area; either an underpriced asset or a hidden risk that comps aren't pricing in. Stress-test before assuming the spread holds.
Location & tenants
- Location reads 67/100 on livability (#78 in AL) — a middle-class / working-renter tenant base. Strengths: commute A+, cost of living A+, housing A+; Watch: amenities C-, crime F, employment F.
- Birmingham City (urban): math 4% / reading 20% proficiency, ranked #116 of 129 in AL (top 90%) — low school quality limits family demand, transient renter base, plan for 1-2y turnover; 82% free/reduced lunch — lower-income household profile, screen leases tightly.
- Zoned schools: West End Academy (math 2% / reading 12%, grade F, #601 of 627 statewide, top 98%, 503 students, 81% FRL); Wenonah High School (math 2% / reading 2%, grade F, #291 of 305 statewide, top 100%, 656 students, 85% FRL) — zoned schools at 83% FRL track the district average.
- Market conditions: Rents soft (-0.0%/yr); 154 active listings in the ZIP; 40 comparable units currently listed for rent nearby; rentals lingering (median 45d on market — plan ~5-8 weeks vacancy on turnover, expect pricing pressure); 52% of comp listings sitting > 30 days — soft ceiling on asking rent; lower-income renter base — watch delinquency; 2,114 units permitted in Jefferson County in 2024 (556 in 5+ unit buildings).
- This rent runs 34% of the median local income ($35k/yr) — at the standard rent-burdened threshold; future hikes will face affordability resistance.
Forward outlook
- Local home prices are declining (-3.0%/yr); year-one equity from $525 of loan paydown is wiped out by about $2k of value loss. Plan a longer hold.
- Jefferson County population projected to shrink 4% by 2050 — rents likely to lag national; underwrite the cash flow, not the appreciation.
Negotiation context
- It's been on market 61 days — a 6% lower offer ($71k) is reasonable based on typical stale-listing flexibility.
- 6 sale attempts since 14y ago with the ask held roughly flat each time — persistent listings suggest the price (not the market) is what's stuck; bring a comps-based counter.
- Current owner paid $63k; 21% above their basis — modest negotiation headroom, anchor on the comps not their cost.
Risks & watch-outs
- Watch-outs: built in 1947 — expect roof / HVAC / electrical / plumbing capex.
- Climate carrying-cost: major wind risk, 27% chance of damaging wind over 30y; extreme-heat days projected 7→19/yr by 2055 (HVAC capex compounding) — expect insurance premiums to compound above CPI over the hold.
Questions for the listing agent
- It's been on market 61 days. Have you received any prior offers? Is the seller open to a 6% concession, seller financing, or rate buy-down credit?
- Built in 1947 — when were the roof, HVAC, electrical panel, plumbing, and water heater last replaced?
- Why hasn't it sold? Are there any deal-killer items the seller is aware of (foundation, flood, title, zoning, code violations)?
- Is there a deadline driving the sale (1031 exchange, divorce, estate, relocation)? That informs how much negotiation room exists.
- Schools are F-rated, which usually means shorter tenancies and higher turnover. Who's the typical renter profile here, and what's been the actual vacancy rate?
- Crime grade is F in this area — have there been break-ins, vandalism, or insurance claims at this property in the last 3 years? What carrier currently insures it and at what premium?
- What's the average days-on-market for RENTAL listings here right now (not sales)? A rising rental-DOM trend means longer vacancies and softer asking-rent achievability than the comps imply.
- What's the recent tenant-quality profile in this submarket — average credit score on applications, eviction rate, late-payment / NSF rate, and stable-employment percentage? A property-management company in the area should have these aggregated.
- How much new for-sale + rental construction is in the pipeline within 1–3 miles? Heavy new supply typically softens prices + rents 12–24 months out; constrained supply supports both.
Investment metrics
- 1% rule
- 1.30% ✓
- Cap rate
- 10.60%
- Cash-on-cash
- 15.37%
- DSCR
- 1.68
- GRM
- 6.4
CMA / ARV
- ARV (on-the-fly)
- $55,944
- Comps found
- 10
Show comp detail 10 sales within ~0.75 mi
| Address | Dist | Beds/Ba | Sqft | Sold | Price | $/sf | Match |
|---|---|---|---|---|---|---|---|
| 1825 Madison Ave SW | 0.14mi | 3/1.0 (+1) | 887 (-0%) | 15mo | $117,000 | $132 | 76 |
| 1881 Fulton Ave SW | 0.21mi | 2/1.0 | 870 (-2%) | 17mo | $72,000 | $83 | 72 |
| 1928 Princeton Ct | 0.42mi | 2/1.0 | 850 (-4%) | 2mo | $26,000 | $31 | 72 |
| 2136 47th St W | 0.68mi | 2/1.0 | 892 (+0%) | 4mo | $12,000 | $13 | 64 |
| 208 22nd St SW | 0.60mi | 2/1.0 | 926 (+4%) | 1mo | $57,000 | $62 | 64 |
| 237 20th St SW | 0.55mi | 2/1.0 | 871 (-2%) | 20mo | $60,000 | $69 | 55 |
| 1925 Woodland Ave SW | 0.27mi | 3/1.0 (+1) | 1,011 (+14%) | 15mo | $21,000 | $21 | 47 |
| 530 19th St SW | 0.49mi | 2/1.0 | 990 (+12%) | 14mo | $62,000 | $63 | 46 |
| 3102 Border St | 0.66mi | 3/1.0 (+1) | 1,019 (+15%) | 1mo | $75,000 | $74 | 39 |
| 533 15th Pl | 0.44mi | 2/1.0 | 768 (-14%) | 23mo | $30,000 | $39 | 38 |
Match score weights: distance 35% · size 25% · config 20% · recency 20%. Top-matched comps best support the ARV.
Projected returns pro-forma
-3.0% appreciation · 0.0% rent growth · sell at horizon
- IRR
- 2.7%
- Equity multiple
- 1.10×
- Total profit
- $2,166
- Equity at exit
- $11,332
- IRR
- 9.2%
- Equity multiple
- 1.62×
- Total profit
- $13,108
- Equity at exit
- $6,571
Cash invested: $21,280 (down + closing). Projections, not guarantees.
Landlord ↔ Tenant lean methodology
- Overall (STATE)
- 90 Strongly Landlord-Friendly
- State Alabama
- 90 Strongly Landlord-Friendly · R+15
- County
- — inherits STATE
- City
- — inherits STATE
ZIP-level market 35211
- Rents YoY
- -0.0%
- Active inventory
- 154
- Price-to-rent
- 6.4×
Monthly cashflow live
- Estimated rent
- $984 high interval (Pro) →
- Mortgage (P&I)
- −$399
- Tax from tax record
- −$75 /mo · $896/yr
- Insurance
- −$32
- HOA
- −$0
- Vacancy / Maint / Mgmt
- −$207
- Net cashflow
- $273
Break-even live
Sensitivity live
| Price | -10% $316 | -5% $294 | +0% $273 | +5% $251 | +10% $230 |
|---|---|---|---|---|---|
| Rent | -10% $195 | -5% $234 | +0% $273 | +5% $311 | +10% $350 |
| Rate | -1.0pp $311 | -0.5pp $292 | base $273 | +0.5pp $253 | +1.0pp $233 |
UW: 25.0% down · 7.5% · 30yr · 1.5% tax · 5.0% vac · 8.0% maint · 8.0% mgmt
Financing live
Cash to close
- Down payment
- $19,000
- Closing costs
- $2,280
- Reserves months
- —
- Total cash needed
- —
Loan-product check · same deal, 3 products live
Conventional
25% down · 7.5% · 30yr
- Down + closing
- —
- Monthly P&I
- —
- Monthly cashflow
- —
- DSCR
- —
- Eligible?
- —
Personal DTI + credit; lowest rate.
DSCR
20% down · 8.5% · 30yr
- Down + closing
- —
- Monthly P&I
- —
- Monthly cashflow
- —
- DSCR
- —
- Eligible?
- —
No personal income docs; deal must DSCR.
Hard money
10% down · 12.0% · 12mo
- Down + closing
- —
- Monthly P&I
- —
- Monthly cashflow
- —
- DSCR
- —
- Eligible?
- —
Short-term bridge; refi at stabilization.
Rent comps 40 comps
| Address | Beds | Baths | Sqft | Rent | $/sqft | DOM | Units | Dist |
|---|---|---|---|---|---|---|---|---|
| 132 17th St SW Birmingham, AL | 2.0 | 1.0 | 738 | $945 | $1.28 | 45d | 1 | 0.12mi |
| 1933 Saint Charles Ct SW Birmingham, AL | 3.0 | 1.0 | 1106 | $1,050 | $0.95 | 25d | 1 | 0.35mi |
| 521 16th St SW Unit 523 Birmingham, AL | 2.0 | 1.0 | 800 | $800 | $1.00 | 45d | 1 | 0.40mi |
| 2028 Lee Ter SW Birmingham, AL | 2.0 | 1.0 | 884 | $695 | $0.79 | 45d | 1 | 0.50mi |
| 208 22nd St SW Birmingham, AL | 2.0 | 1.0 | 926 | $1,050 | $1.13 | 4d | 1 | 0.58mi |
| 2216 Lee Ave SW Birmingham, AL | 3.0 | 1.0 | 902 | $900 | $1.00 | 25d | 1 | 0.66mi |
| 1228 Fulton Ave SW Birmingham, AL | 2.0 | 1.0 | 900 | $800 | $0.89 | 45d | 1 | 0.74mi |
| 3012 Avenue X Unit C Birmingham, AL | 3.0 | 1.0 | 620 | $650 | $1.05 | 13d | 1 | 0.76mi |
| 4813 Court S Birmingham, AL | 3.0 | 2.0 | 1118 | $1,125 | $1.01 | 45d | 1 | 0.78mi |
| 2329 30th Street Ensley Birmingham, AL | 2.0 | 1.0 | 917 | $990 | $1.08 | 25d | 1 | 0.78mi |
| 2421 29th Street Ensley Unit C Birmingham, AL | 2.0 | 1.0 | 950 | $703 | $0.74 | 25d | 1 | 0.81mi |
| 914 14th St SW Unit A Birmingham, AL | 1.0 | 1.0 | 577 | $600 | $1.04 | 25d | 1 | 0.82mi |
| 914 14th St SW Unit B Birmingham, AL | 1.0 | 1.0 | 577 | $700 | $1.21 | 25d | 1 | 0.82mi |
| 914 14th St SW Unit B Birmingham, AL | 1.0 | 1.0 | 580 | $600 | $1.03 | 13d | 1 | 0.82mi |
| 916 14th St SW Unit F Birmingham, AL | 2.0 | 1.0 | 800 | $800 | $1.00 | 13d | 1 | 0.83mi |
| 916 14th St SW Unit A Birmingham, AL | 2.0 | 1.0 | 870 | $800 | $0.92 | 25d | 1 | 0.83mi |
| 916 14th St SW Unit F Birmingham, AL | 2.0 | 1.0 | 870 | $800 | $0.92 | 45d | 1 | 0.83mi |
| 1621 2nd Ct W Birmingham, AL | 3.0 | 1.0 | 1074 | $1,095 | $1.02 | 45d | 1 | 0.84mi |
| 914 21st St SW Birmingham, AL | 3.0 | 1.0 | 784 | $1,200 | $1.53 | 22d | 1 | 0.85mi |
| 2519 Saint Charles Ave SW Birmingham, AL | 2.0 | 1.0 | 990 | $975 | $0.98 | 45d | 1 | 0.85mi |
| 407 S Park Rd SW Birmingham, AL | 3.0 | 1.0 | 1050 | $900 | $0.86 | 45d | 1 | 0.86mi |
| 405 11th St SW Unit B Birmingham, AL | 2.0 | 1.0 | 1065 | $800 | $0.75 | 45d | 1 | 0.93mi |
| 2916 24th Street Ensley Birmingham, AL | 2.0 | 1.0 | 850 | $590 | $0.69 | 25d | 1 | 0.95mi |
| 4929 Avenue R Unit R Birmingham, AL | 2.0 | 1.0 | 962 | $950 | $0.99 | 45d | 1 | 1.00mi |
| 219 12th St W Birmingham, AL | 2.0 | 1.0 | 800 | $799 | $1.00 | 25d | 1 | 1.02mi |
| 612 26th St SW Birmingham, AL | 2.0 | 1.0 | 988 | $825 | $0.84 | 45d | 1 | 1.02mi |
| 1100 Cotton Ave SW Unit b Birmingham, AL | 2.0 | 1.5 | 816 | $988 | $1.21 | 45d | 1 | 1.03mi |
| 1233 15th Way SW Birmingham, AL | 3.0 | 1.0 | 1119 | $1,050 | $0.94 | 45d | 1 | 1.03mi |
| 4724 Court R Birmingham, AL | 2.0 | 1.0 | 1016 | $895 | $0.88 | 16d | 1 | 1.04mi |
| 2037 26th Street Ensley Birmingham, AL | 3.0 | 1.0 | 1074 | $995 | $0.93 | 45d | 1 | 1.06mi |
| 1252 18th Pl SW Birmingham, AL | 3.0 | 1.0 | 950 | $1,000 | $1.05 | 17d | 1 | 1.07mi |
| 1209 19th Pl SW Birmingham, AL | 3.0 | 1.0 | 1050 | $1,275 | $1.21 | 45d | 1 | 1.09mi |
| 1228 19th Pl SW Birmingham, AL | 3.0 | 2.0 | 978 | $1,195 | $1.22 | 4d | 1 | 1.14mi |
| 1781 51st Street Ensley Unit ENSLEY Birmingham, AL | 3.0 | 1.5 | 1069 | $950 | $0.89 | 45d | 1 | 1.17mi |
| 1332 15th Pl SW Birmingham, AL | 2.0 | 1.0 | 1115 | $950 | $0.85 | 4d | 1 | 1.19mi |
| 2621 20th Street Ensley Birmingham, AL | 3.0 | 1.0 | 1117 | $1,295 | $1.16 | 45d | 1 | 1.20mi |
| 1024 4th Ave W Unit B Birmingham, AL | 2.0 | 1.0 | 840 | $823 | $0.98 | 45d | 1 | 1.26mi |
| 2661 Bush Blvd Birmingham, AL | 3.0 | 2.0 | 1024 | $1,200 | $1.17 | 45d | 1 | 1.27mi |
| 5211 Ter Q Unit Q Birmingham, AL | 2.0 | 1.0 | 756 | $775 | $1.03 | 45d | 1 | 1.27mi |
| 719 Washington Ave SW Birmingham, AL | 3.0 | 1.0 | 1064 | $950 | $0.89 | 13d | 1 | 1.29mi |
Listing history 33 events
-
2026-06-21days on market $76,000 Active 61 DOM
-
2026-06-18days on market $76,000 Active 58 DOM
-
2026-06-17days on market $76,000 Active 57 DOM
-
2026-06-16days on market $76,000 Active 56 DOM
-
2026-06-15days on market $76,000 Active 55 DOM
-
2026-06-13days on market $76,000 Active 53 DOM
-
2026-06-10days on market $76,000 Active 50 DOM
-
2026-06-09days on market $76,000 Active 49 DOM
-
2026-06-08days on market $76,000 Active 48 DOM
-
2026-06-07remarks 651-char remark
-
2026-06-07days on market $76,000 Active 47 DOM
-
2026-06-03days on market $76,000 Active 43 DOM
-
2026-06-02days on market $76,000 Active 42 DOM
-
2026-06-01days on market $76,000 Active 41 DOM
-
2026-05-31statusdays on market $76,000 Active 40 DOM
-
2026-04-28historical Contingent
-
2026-04-21$76,000 Active
-
2025-06-29historical $949
-
2025-05-24$949
-
2025-05-24historical $949
-
2025-05-01$949
-
2023-12-01soldstatus $63,000
-
2023-11-30soldstatus $63,000 Sold 696-char remark
Show marketing remark (696 chars)
Take a look at this investment opportunity! Back on the market at no fault to the seller, this home has recently gone through inspection and appraisal! This is part of a 3-home portfolio offered together for $210,000. The possibilities and potential for these properties are endless. All properties are currently tenant occupied, and showings and inspection will be scheduled after the accepted offer. Please do not disturb the tenants. The current rent for this property is $685/month. All properties are being sold As Is. This is an awesome opportunity to add to your portfolio, which includes cash-flowing properties! Check out the other homes in this portfolio! MLS: 1357383, 1357379, 1357373
-
2023-11-14status Pending 696-char remark
Show marketing remark (696 chars)
Take a look at this investment opportunity! Back on the market at no fault to the seller, this home has recently gone through inspection and appraisal! This is part of a 3-home portfolio offered together for $210,000. The possibilities and potential for these properties are endless. All properties are currently tenant occupied, and showings and inspection will be scheduled after the accepted offer. Please do not disturb the tenants. The current rent for this property is $685/month. All properties are being sold As Is. This is an awesome opportunity to add to your portfolio, which includes cash-flowing properties! Check out the other homes in this portfolio! MLS: 1357383, 1357379, 1357373
-
2023-10-17status Active 696-char remark
Show marketing remark (696 chars)
Take a look at this investment opportunity! Back on the market at no fault to the seller, this home has recently gone through inspection and appraisal! This is part of a 3-home portfolio offered together for $210,000. The possibilities and potential for these properties are endless. All properties are currently tenant occupied, and showings and inspection will be scheduled after the accepted offer. Please do not disturb the tenants. The current rent for this property is $685/month. All properties are being sold As Is. This is an awesome opportunity to add to your portfolio, which includes cash-flowing properties! Check out the other homes in this portfolio! MLS: 1357383, 1357379, 1357373
-
2023-08-10status Pending 696-char remark
Show marketing remark (696 chars)
Take a look at this investment opportunity! Back on the market at no fault to the seller, this home has recently gone through inspection and appraisal! This is part of a 3-home portfolio offered together for $210,000. The possibilities and potential for these properties are endless. All properties are currently tenant occupied, and showings and inspection will be scheduled after the accepted offer. Please do not disturb the tenants. The current rent for this property is $685/month. All properties are being sold As Is. This is an awesome opportunity to add to your portfolio, which includes cash-flowing properties! Check out the other homes in this portfolio! MLS: 1357383, 1357379, 1357373
-
2023-07-11historical Contingent 696-char remark
Show marketing remark (696 chars)
Take a look at this investment opportunity! Back on the market at no fault to the seller, this home has recently gone through inspection and appraisal! This is part of a 3-home portfolio offered together for $210,000. The possibilities and potential for these properties are endless. All properties are currently tenant occupied, and showings and inspection will be scheduled after the accepted offer. Please do not disturb the tenants. The current rent for this property is $685/month. All properties are being sold As Is. This is an awesome opportunity to add to your portfolio, which includes cash-flowing properties! Check out the other homes in this portfolio! MLS: 1357383, 1357379, 1357373
-
2023-06-19$71,285 Active 696-char remark
Show marketing remark (696 chars)
Take a look at this investment opportunity! Back on the market at no fault to the seller, this home has recently gone through inspection and appraisal! This is part of a 3-home portfolio offered together for $210,000. The possibilities and potential for these properties are endless. All properties are currently tenant occupied, and showings and inspection will be scheduled after the accepted offer. Please do not disturb the tenants. The current rent for this property is $685/month. All properties are being sold As Is. This is an awesome opportunity to add to your portfolio, which includes cash-flowing properties! Check out the other homes in this portfolio! MLS: 1357383, 1357379, 1357373
-
2019-04-10soldstatus $336,234
-
2019-03-14soldstatus $208,000
-
2012-07-16soldstatus $10,100 186-char remark
Show marketing remark (186 chars)
THIS PROPERTY IS GREAT FOR A FIRST TIME HOME BUYER, 2 BEDROOMS, 1 BATHROOM, FORMAL LIVING ROOM AND DINING ROOM, SPACIOUS KITCHEN AND LAUNDRY ROOM. THIS IS A FANNIE MAE HOMEPATH PROPERTY.
-
2012-05-29$10,000 186-char remark
Show marketing remark (186 chars)
THIS PROPERTY IS GREAT FOR A FIRST TIME HOME BUYER, 2 BEDROOMS, 1 BATHROOM, FORMAL LIVING ROOM AND DINING ROOM, SPACIOUS KITCHEN AND LAUNDRY ROOM. THIS IS A FANNIE MAE HOMEPATH PROPERTY.
-
1979-04-20soldstatus $29,300
ⓘ Source: listings_history table (triggers on properties + properties_extension) + one-shot
backfill from property_details.listing_events for pre-trigger history.
Tax reassessment forecast AL · Resets to sale price
- Current annual tax
- $896 · $75/mo
- Projected year-2 tax
- $896 · $75/mo
- Expected delta
- $0/yr ($0/mo · 0.0%)
ⓘ Screening estimate from a state-policy table — verify with the county assessor before closing.
Climate risk First Street
- Flood 1/10 Low FEMA zone X (unshaded) · 0% chance over 30 yrs
- Wildfire 1/10 Low
- Heat 6/10 Major 7 d/yr ≥106°F today · 19 d/yr by 30 yrs out
- Wind 6/10 Major 27% chance of damaging wind over 30 yrs
- Air quality 4/10 Moderate 5 unhealthy d/yr today · 5 by 30 yrs out
Nearby sold comps map
Loading sold comps map…
Walkable amenities ~0.75 mi
Loading nearby amenities…
Taxation est. · year 1
- Rental income
- $11,810
- − Mortgage interest
- −$4,257
- − Property taxes
- −$896
- − Insurance
- −$380
- − Repairs & maintenance
- −$945
- − Management
- −$945
- − Depreciation
- −$2,211
- Taxable income
- $2,177
- Est. tax owed @ 24.0%
- −$522
- After-tax cash flow
- $2,749/yr
For passive investors: Depreciation is non-cash, so a rental often shows a tax loss while cash-flowing — sheltering income. Rental losses are passive: they offset passive income freely, and up to $25,000/yr can offset ordinary (W-2) income if you actively participate and your MAGI is under $100k (phasing out to $0 by $150k); unused losses carry forward. On sale, claimed depreciation is recaptured at up to 25%, and gains may owe capital-gains tax (a 1031 exchange can defer both). Figures are a year-1 estimate at your 24.0% rate — not tax advice; consult a CPA.
Schools (NCES district)
- District
- Birmingham City
- NCES district ID
- 0100390
- Math proficiency
- 4% ▼ -17.00%
- Reading proficiency
- 20% ▼ -4.00%
- Median HH income
- $31,988
- Composite
- 9.49/100
- National rank
- #9850
- State rank
- #116 of 129 in AL
Livability — Birmingham
- Score
- 67/100
- State rank
- #78
- US rank
- #10412
Category grades
Schools grade is shown separately in the Schools card above.
Census & demographics
- Census place
- Birmingham, AL
- County
- Jefferson County · 527,445 people
- City population
- 210,422
- Metro
- Birmingham-Hoover, AL
- Population (ZIP)
- 24,924
- Household income
- $34,884
- Rent vs Own
- Severe rent burden
- 2161.0
Population outlook (Jefferson County) Hauer SSP2
- Today (2025)
- 669,185 people
- By 2030
- 669,694 · +0.1%
- By 2040
- 661,388 · -1.2%
- By 2050
- 643,086 · -3.9%
- By 2075
- 577,267 · -13.7%
- By 2100
- 474,758 · -29.1%
Race, ethnicity, and origin ACS 2023
- Neighborhood character
- Predominantly Black (77%)
- Race & ethnicity
- Black 77% White 10% Hispanic / Latino 10% Two or more races 4%
- Hispanic origin (detail)
- Mexican 7%
- Foreign-born
- 6% · Canada
- Languages at home
- 91% English-only · Spanish 8% French/Haitian/Cajun 1%
Political lean MEDSL · Jefferson
- 2024 margin
- D (+10.4) · D 54.6% · R 44.2% · Other 1.2%
- 2008→2024 swing
- +5.4pp toward D · 2008: 5.1pp · 2024: 10.4pp
- All cycles
- 2024: D+10.4 2020: D+13.2 2016: D+7.2 2012: D+6.0 2008: D+5.1
Not yet ingested
- Civics
- —
Market trends
- HPI YoY
- ▼ -49.29%
- Current HPI
- 91.2903
- Rent YoY
- ▬ -0.01%
- Metro
- Birmingham-Hoover, AL
- State GDP YoY
- ▲ 2.94%
- F500 in state
- 4
Industry mix (Fortune 500 HQ in AL)
| Industry | F500 HQs | Revenue |
|---|---|---|
| Financial Services | 1 | $8B |
|
||
| Healthcare | 1 | $5B |
|
||
Price history
+159.4% since first listed18 events — show timeline
- 2026-04-28 Contingent — Greater Alabama MLS
- 2026-04-21 Listed $76,000 Greater Alabama MLS
- 2025-06-29 Rental Removed $949 RENTLY
- 2025-05-24 Listed for Rent $949 RENTLY
- 2025-05-24 Rental Removed $949 TENANTTURNER2
- 2025-05-01 Listed for Rent $949 TENANTTURNER2
- 2023-12-01 Sold (Public Records) $63,000 Public Records
- 2023-11-30 Sold (MLS) $63,000 Greater Alabama MLS
- 2023-11-14 Pending — Greater Alabama MLS
- 2023-10-17 Relisted — Greater Alabama MLS
- 2023-08-10 Pending — Greater Alabama MLS
- 2023-07-11 Contingent — Greater Alabama MLS
- 2023-06-19 Listed $71,285 Greater Alabama MLS
- 2019-04-10 Sold (Public Records) $336,234 Public Records
- 2019-03-14 Sold (Public Records) $208,000 Public Records
- 2012-07-16 Sold (MLS) $10,100 Greater Alabama MLS
- 2012-05-29 Listed $10,000 Greater Alabama MLS
- 1979-04-20 Sold (Public Records) $29,300 Public Records
Property tax history
+1.3%/yrLatest (2025): $896 · +8.8% YoY. Source: county tax records.
Cash-flow waterfall
monthlySold comps — $/sqft
last 12 mo · ≤1 miLoading sold comps…