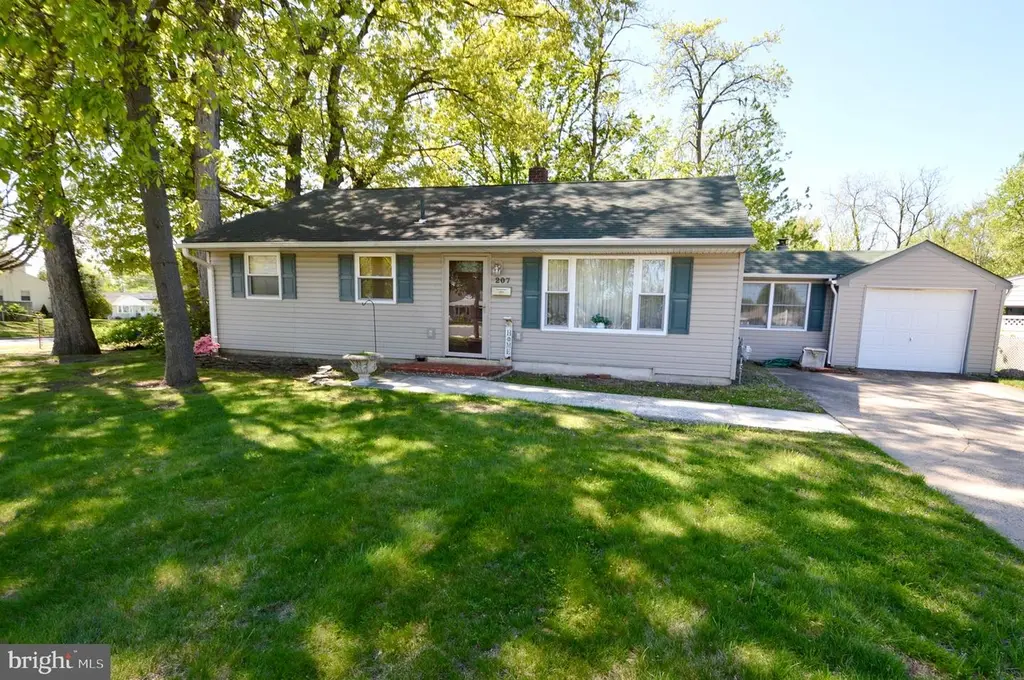
207 Phillips Ave · Magnolia, NJ
Flood risk 1/10 · Minimal
- FEMA flood zone
- X (unshaded)
- Chance of flooding over 30 yrs
- 0.0%
- Est. flood insurance / yr
- $507 – $1,088
Fire risk 1/10 · Minimal
- Est. fire insurance / yr
- $526 – $976
Heat risk 6/10 · Moderate
- Hot days now (above 104°F)
- 7 days/yr
- Hot days in 30 yrs
- 14 days/yr
Wind risk 6/10 · Moderate
- Chance of severe wind over 30 yrs
- 54.0%
Air-quality risk 4/10 · Minor
- Unhealthy air days now
- 4 days/yr
- Unhealthy air days in 30 yrs
- 6 days/yr
Risk factors via First Street. Map © Google.
Why this score? — see what drove the D+ grade
The composite is a weighted blend of 9 inputs, each scored 0–100. Each bar is that input's sub-score; the figure is the points it added to the 100-point composite (weight × sub-score).
- Cash flow +14.5/30.0
- ARV discount +13.2/15.0
- 1% rule +5.6/10.0
- DSCR +4.4/10.0
- Livability +3.6/5.0
- Rent growth +2.5/5.0
- Condition / age +2.5/5.0
- Schools +2.2/10.0
- Appreciation +0.0/10.0
$250,000
🖨 Deal sheet (PDF) 📄 Offer letter ✓ Due diligence
Listing remarks
This is a cozy 3 bedroom, 1 bathroom home located on a desirable corner lot with a spacious front yard and backyard with back patio! This home has great curb appeal with a large driveway and well-manicured front lawn. The primary bedroom is spacious with two big closets as the adjacent bedroom was connected. The kitchen was beautifully redone with stainless steel appliances, marble countertops, white shaker style cabinets, and the perfect kitchen island. The spacious family room is open to the kitchen with exposed beams, ceiling fan, and wood burning fireplace. The wood beams add great character and a warm cozy feeling to the home. The bathroom has also been nicely redone with tile floors,
Key facts
- Spacious front yard
- Large driveway
- Kitchen island
Tags
Property features AI
Exterior
- Parking: Attached garage (1 space); Driveway
- Utilities: Public water; Public sewer; Natural gas hot water
- Home design: Detached property; Frame construction with vinyl siding
- Construction: Slab foundation; Replacement windows
- Exterior features: Patio; Sidewalks; Corner lot
Interior
- Kitchen: Built-in range; Dishwasher; Disposal
- Bedrooms: 3 bedrooms on the main level
- Bathrooms: 1 full bathroom
- Heating & cooling: Forced air heating (natural gas); Central air conditioning
- Interior features: Ceiling fans; Exposed beams; 1 fireplace
- Laundry & utility: Main-floor laundry
Neighborhood map
What this means for you Summary
Snapshot
- This is a 3-bed/1.0-bath single-family listed at $250k.
Deal economics
- At list price, monthly cash flow is $54 ($651/yr) — positive.
- The deal already cash-flows at list — no discount required.
- Meets the 1% rule at list price ($3k rent vs $250k).
Location & tenants
- Location reads 72/100 on livability (#228 in NJ) — a middle-class / working-renter tenant base. Strengths: housing A+, health & safety A, employment B; Watch: crime C-, amenities D-, commute F.
- Magnolia School District (suburban): math 9% / reading 39% proficiency, ranked #396 of 472 in NJ (top 84%) — low school quality limits family demand, transient renter base, plan for 1-2y turnover.
- Zoned schools: Magnolia (math 9% / reading 39%, grade F, #916 of 1,303 statewide, top 71%, 388 students, 41% FRL); Sterling High School (math 14% / reading 47%, grade F, #279 of 399 statewide, top 71%, 894 students, 33% FRL).
- Market conditions: 18 active listings in the ZIP; 10 comparable units currently listed for rent nearby; rentals leasing fast (median 1d on market — plan ~1-2 weeks tenant-placement turnaround); 1,018 units permitted in Camden County in 2024 (509 in 5+ unit buildings).
Forward outlook
- Local home prices are declining (-3.0%/yr); year-one equity from $2k of loan paydown is wiped out by about $8k of value loss. Plan a longer hold.
- Camden County population projected to shrink 8% by 2050 — rents likely to lag national; underwrite the cash flow, not the appreciation.
Negotiation context
- Only 7 days on market — expect competitive offers; lowballing is unlikely to land.
Risks & watch-outs
- Watch-outs: property tax is 3.0% of price; built in 1956 — expect roof / HVAC / electrical / plumbing capex.
- Climate carrying-cost: major wind risk, 54% chance of damaging wind over 30y; extreme-heat days projected 7→14/yr by 2055 (HVAC capex compounding) — expect insurance premiums to compound above CPI over the hold.
Questions for the listing agent
- Built in 1956 — when were the roof, HVAC, electrical panel, plumbing, and water heater last replaced?
- Property tax is high relative to price — has the assessment been appealed recently, and will the sale trigger a re-assessment?
- Is there a deadline driving the sale (1031 exchange, divorce, estate, relocation)? That informs how much negotiation room exists.
- The area grade is low — what's the realistic commute time and amenity access for the typical tenant pool here? Any planned neighborhood developments (good or bad) we should know about?
- What's the average days-on-market for RENTAL listings here right now (not sales)? A rising rental-DOM trend means longer vacancies and softer asking-rent achievability than the comps imply.
- What's the recent tenant-quality profile in this submarket — average credit score on applications, eviction rate, late-payment / NSF rate, and stable-employment percentage? A property-management company in the area should have these aggregated.
- How much new for-sale + rental construction is in the pipeline within 1–3 miles? Heavy new supply typically softens prices + rents 12–24 months out; constrained supply supports both.
Investment metrics
- 1% rule
- 1.06% ✓
- Cap rate
- 6.55%
- Cash-on-cash
- 0.93%
- DSCR
- 1.04
- GRM
- 7.9
CMA / ARV
- ARV (on-the-fly)
- $286,440
- Comps found
- 12
Show comp detail 12 sales within ~0.75 mi
| Address | Dist | Beds/Ba | Sqft | Sold | Price | $/sf | Match |
|---|---|---|---|---|---|---|---|
| 207 Phillips Ave | 0.00mi | 3/1.0 | 1,320 (0%) | 0mo | $285,000 | $216 | 100 |
| 430 W Brooke Ave | 0.37mi | 4/2.0 (+1) | 1,320 (0%) | 6mo | $348,000 | $264 | 69 |
| 601 W Lincoln Ave | 0.52mi | 3/2.0 | 1,331 (+1%) | 4mo | $369,300 | $277 | 67 |
| 203 E Monroe Ave | 0.56mi | 3/1.0 | 1,324 (+0%) | 8mo | $235,000 | $177 | 66 |
| 302 W Washington Ave | 0.67mi | 3/1.0 | 1,288 (-2%) | 4mo | $269,000 | $209 | 61 |
| 178 E Charleston Ave | 0.61mi | 3/2.0 | 1,428 (+8%) | 0mo | $265,000 | $186 | 54 |
| 606 W Lincoln Ave | 0.56mi | 4/1.0 (+1) | 1,236 (-6%) | 6mo | $275,000 | $222 | 54 |
| 115 Gloucester Ave | 0.54mi | 3/1.0 | 1,200 (-9%) | 7mo | $231,000 | $193 | 53 |
| 322 W Washington Ave | 0.68mi | 3/1.0 | 1,168 (-12%) | 4mo | $230,000 | $197 | 46 |
| 105 W Washington Ave | 0.65mi | 3/2.5 | 1,487 (+13%) | 3mo | $399,900 | $269 | 40 |
| 27 E Phoenix Ave | 0.70mi | 2/2.0 (-1) | 1,200 (-9%) | 6mo | $260,000 | $217 | 38 |
| 313 E Washington Ave | 0.74mi | 4/1.5 (+1) | 1,188 (-10%) | 6mo | $285,000 | $240 | 37 |
Match score weights: distance 35% · size 25% · config 20% · recency 20%. Top-matched comps best support the ARV.
Projected returns pro-forma
-3.0% appreciation · 3.0% rent growth · sell at horizon
- IRR
- -14.7%
- Equity multiple
- 0.47×
- Total profit
- $-36,832
- Equity at exit
- $37,276
- IRR
- -5.9%
- Equity multiple
- 0.62×
- Total profit
- $-26,708
- Equity at exit
- $21,615
Cash invested: $70,000 (down + closing). Projections, not guarantees.
Landlord ↔ Tenant lean methodology
- Overall (STATE)
- 21 Tenant-Leaning
- State New Jersey
- 21 Tenant-Leaning · D+6
- County
- — inherits STATE
- City
- — inherits STATE
ZIP-level market 08049
- Home prices YoY
- -18.2%
- Active inventory
- 18
- Price-to-rent
- 7.9×
Monthly cashflow live
- Estimated rent
- $2,639 high interval (Pro) →
- Mortgage (P&I)
- −$1,311
- Tax from tax record
- −$615 /mo · $7,381/yr
- Insurance
- −$104
- HOA
- −$0
- Vacancy / Maint / Mgmt
- −$554
- Net cashflow
- $54
Break-even live
Sensitivity live
| Price | -10% $196 | -5% $125 | +0% $54 | +5% $-17 | +10% $-87 |
|---|---|---|---|---|---|
| Rent | -10% $-154 | -5% $-50 | +0% $54 | +5% $158 | +10% $263 |
| Rate | -1.0pp $180 | -0.5pp $118 | base $54 | +0.5pp $-11 | +1.0pp $-76 |
UW: 25.0% down · 7.5% · 30yr · 1.5% tax · 5.0% vac · 8.0% maint · 8.0% mgmt
Financing live
Cash to close
- Down payment
- $62,500
- Closing costs
- $7,500
- Reserves months
- —
- Total cash needed
- —
Loan-product check · same deal, 3 products live
Conventional
25% down · 7.5% · 30yr
- Down + closing
- —
- Monthly P&I
- —
- Monthly cashflow
- —
- DSCR
- —
- Eligible?
- —
Personal DTI + credit; lowest rate.
DSCR
20% down · 8.5% · 30yr
- Down + closing
- —
- Monthly P&I
- —
- Monthly cashflow
- —
- DSCR
- —
- Eligible?
- —
No personal income docs; deal must DSCR.
Hard money
10% down · 12.0% · 12mo
- Down + closing
- —
- Monthly P&I
- —
- Monthly cashflow
- —
- DSCR
- —
- Eligible?
- —
Short-term bridge; refi at stabilization.
Rent comps 10 comps
| Address | Beds | Baths | Sqft | Rent | $/sqft | DOM | Units | Dist |
|---|---|---|---|---|---|---|---|---|
| 214 David Pl Magnolia, NJ | 4.0 | 1.0 | 1280 | $2,695 | $2.11 | 0d | 1 | 0.19mi |
| 37 E Gloucester Pike Unit 1 Barrington, NJ | 4.0 | 2.0 | 1683 | $2,000 | $1.19 | 13d | 1 | 0.90mi |
| 401 Glendale Dr Somerdale, NJ | 3.0 | 1.0 | 1060 | $2,400 | $2.26 | 3d | 1 | 0.94mi |
| 400 E Oak Ave Lawnside, NJ | 2.0 | 2.0 | 1179 | $2,670 | $2.26 | 0d | 2 | 1.01mi |
| 16 Whaler Ave Runnemede, NJ | 3.0 | 2.5 | 1558 | $3,050 | $1.96 | 20d | 1 | 1.10mi |
| 10 Whaler Dr Runnemede, NJ | 3.0 | 2.0 | 1558 | $3,000 | $1.93 | 0d | 1 | 1.12mi |
| 60 Robert Dr Runnemede, NJ | 3.0 | 2.5 | 1558 | $2,950 | $1.89 | 0d | 1 | 1.17mi |
| 100 Hartford Dr Runnemede, NJ | 1.0–2.0 | 1.0–1.5 | 824 | $2,195 | $2.66 | 0d | 1 | 1.25mi |
| 331 Preston Ave Voorhees, NJ | 1.0–2.0 | 1.0 | 900 | $2,114 | $2.35 | 0d | 1 | 1.46mi |
| 101 Railroad Blvd Cherry Hill, NJ | 3.0 | 2.0 | 1374 | $2,800 | $2.04 | 22d | 1 | 1.50mi |
Listing history 3 events
-
2026-05-11status Pending
-
2026-05-06historical Active Under Contract
-
2026-04-30$250,000 Active
ⓘ Source: listings_history table (triggers on properties + properties_extension) + one-shot
backfill from property_details.listing_events for pre-trigger history.
Tax reassessment forecast NJ · Partial reset (capped growth)
- Current annual tax
- $7,381 · $615/mo
- Projected year-2 tax
- $7,381 · $615/mo
- Expected delta
- $0/yr ($0/mo · 0.0%)
ⓘ Screening estimate from a state-policy table — verify with the county assessor before closing.
Climate risk First Street
- Flood 1/10 Low FEMA zone X (unshaded) · 0% chance over 30 yrs
- Wildfire 1/10 Low
- Heat 6/10 Major 7 d/yr ≥104°F today · 14 d/yr by 30 yrs out
- Wind 6/10 Major 54% chance of damaging wind over 30 yrs
- Air quality 4/10 Moderate 4 unhealthy d/yr today · 6 by 30 yrs out
Nearby sold comps map
Loading sold comps map…
Walkable amenities ~0.75 mi
Loading nearby amenities…
Taxation est. · year 1
- Rental income
- $31,663
- − Mortgage interest
- −$14,004
- − Property taxes
- −$7,381
- − Insurance
- −$1,250
- − Repairs & maintenance
- −$2,533
- − Management
- −$2,533
- − Depreciation
- −$7,273
- Taxable loss
- −$3,310
- Est. tax savings @ 24.0%
- +$795
- After-tax cash flow
- $1,445/yr
For passive investors: Depreciation is non-cash, so a rental often shows a tax loss while cash-flowing — sheltering income. Rental losses are passive: they offset passive income freely, and up to $25,000/yr can offset ordinary (W-2) income if you actively participate and your MAGI is under $100k (phasing out to $0 by $150k); unused losses carry forward. On sale, claimed depreciation is recaptured at up to 25%, and gains may owe capital-gains tax (a 1031 exchange can defer both). Figures are a year-1 estimate at your 24.0% rate — not tax advice; consult a CPA.
Schools (NCES district)
- District
- Magnolia School District
- NCES district ID
- 3409300
- Math proficiency
- 9% ▼ -22.00%
- Reading proficiency
- 39% ▼ -9.00%
- Median HH income
- $55,534
- Composite
- 21.64/100
- National rank
- #8289
- State rank
- #396 of 472 in NJ
Livability — Magnolia
- Score
- 72/100
- State rank
- #228
- US rank
- #6233
Category grades
Schools grade is shown separately in the Schools card above.
Census & demographics
- Census place
- Magnolia, NJ
- City population
- 5,273
- Population (ZIP)
- 5,273
Population outlook (Camden County) Hauer SSP2
- Today (2025)
- 507,964 people
- By 2030
- 502,182 · -1.1%
- By 2040
- 485,602 · -4.4%
- By 2050
- 465,630 · -8.3%
- By 2075
- 419,986 · -17.3%
- By 2100
- 369,492 · -27.3%
Race, ethnicity, and origin ACS 2023
- Neighborhood character
- Diverse neighborhood (Simpson 0.60)
- Race & ethnicity
- White 59% Hispanic / Latino 16% Black 14% Two or more races 14% Asian 7%
- Hispanic origin (detail)
- Mexican 2% Puerto Rican 12% Cuban 2%
- Common ancestry
- Romanian 4% Hispanic 1% Slovak 1%
- Foreign-born
- 6% · Vietnam, Canada
- Languages at home
- 87% English-only · Spanish 6% Vietnamese 4% Tagalog/Filipino 2%
Political lean MEDSL · Camden
- 2024 margin
- Strong D (+27.4) · D 63.0% · R 35.5% · Other 1.5%
- 2008→2024 swing
- -8.8pp toward R · 2008: 36.2pp · 2024: 27.4pp
- All cycles
- 2024: D+27.4 2020: D+33.5 2016: D+32.4 2012: D+36.6 2008: D+36.2
Not yet ingested
- Civics
- —
Market trends
- HPI YoY
- ▼ -76.58%
- Current HPI
- 344.1719
- Rent YoY
- —
- Metro
- —
- State GDP YoY
- ▲ 2.05%
- F500 in state
- 34
Industry mix (Fortune 500 HQ in NJ)
| Industry | F500 HQs | Revenue |
|---|---|---|
| Consumer Goods | 3 | $31B |
|
||
| Pharmaceuticals | 2 | $153B |
|
||
| Technology | 2 | $21B |
|
||
| Insurance | 2 | $20B |
|
||
| Healthcare | 2 | $19B |
|
||
| Financial Services | 1 | $70B |
|
||
Price history
3 events — show timeline
- 2026-05-11 Pending — BRIGHT MLS
- 2026-05-06 Contingent — BRIGHT MLS
- 2026-04-30 Listed $250,000 BRIGHT MLS
Property tax history
+2.2%/yrLatest (2025): $7,381 · +3.5% YoY. Source: county tax records.
Cash-flow waterfall
monthlySold comps — $/sqft
last 12 mo · ≤1 miLoading sold comps…