1205 Lakeway Rd · Kissee Mills, MO
Flood risk 1/10 · Minimal
- FEMA flood zone
- X (unshaded)
- Chance of flooding over 30 yrs
- 0.0%
- Est. flood insurance / yr
- $473 – $860
Fire risk 4/10 · Minor
- Est. fire insurance / yr
- $1,054 – $1,958
Heat risk 4/10 · Minor
- Hot days now (above 106°F)
- 7 days/yr
- Hot days in 30 yrs
- 20 days/yr
Wind risk 2/10 · Minimal
- Chance of severe wind over 30 yrs
- 1.0%
Air-quality risk 2/10 · Minimal
- Unhealthy air days now
- 0 days/yr
- Unhealthy air days in 30 yrs
- 1 days/yr
Risk factors via First Street. Map © Google.
Why this score? — see what drove the B- grade
The composite is a weighted blend of 9 inputs, each scored 0–100. Each bar is that input's sub-score; the figure is the points it added to the 100-point composite (weight × sub-score).
- Cash flow +26.7/30.0
- DSCR +9.1/10.0
- ARV discount +7.5/15.0
- 1% rule +7.0/10.0
- Appreciation +4.9/10.0
- Schools +3.9/10.0
- Livability +3.2/5.0
- Rent growth +2.5/5.0
- Condition / age +2.5/5.0
$93,500
🖨 Deal sheet 📄 Offer letter ✓ Due diligence
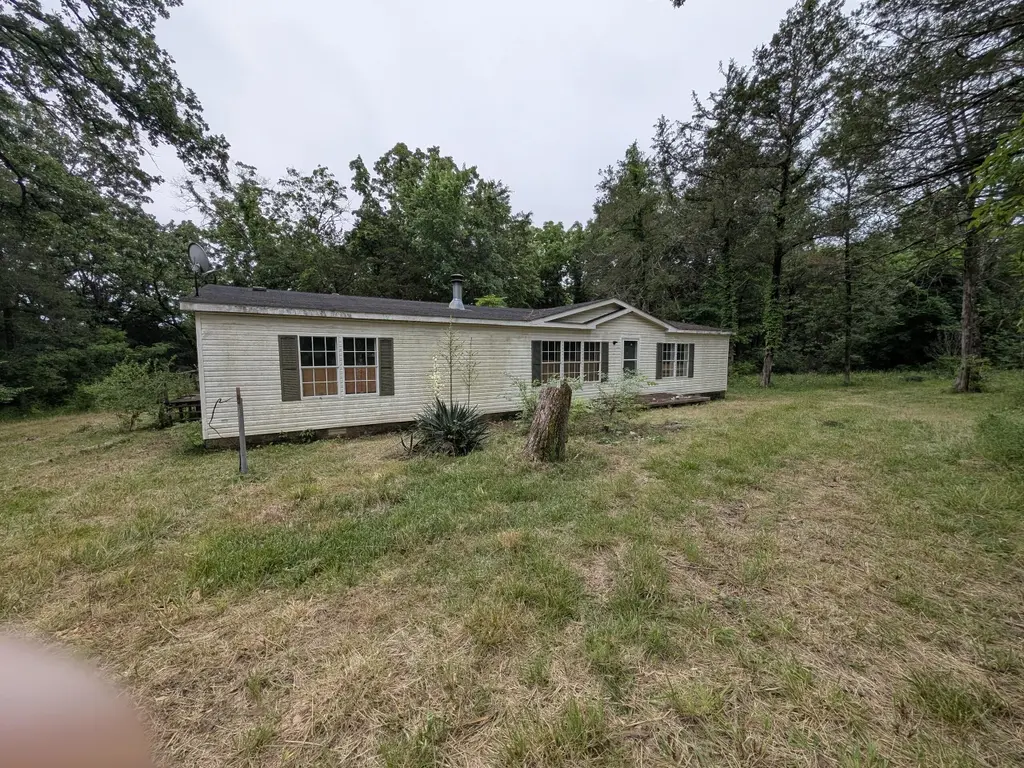
Listing remarks
This 11.65 wooded arces, complete with water, septic, and electric service to the homesite. It's conveniently located just a short drive from Bull Shoals Lake and Forsyth, MO. The home site is already theirs, and the sellers haven't placed much value (or any)on the mobile home, but it might be fixed, tore down or moved. Alternatively, you could build a new home on this beautiful piece of property. The property is being sold ''as-is. '' Just a heads-up, this won't qualify for a government loan. This is a nice piece of property.
Key facts
- 11.65 acre lot
- Built 1997
Neighborhood map
What this means for you Summary
Snapshot
- This is a 3-bed/1.0-bath other listed at $94k.
Deal economics
- At list price, monthly cash flow is $252 ($3k/yr) — positive.
- The deal already cash-flows at list — no discount required.
- Meets the 1% rule at list price ($1k rent vs $94k).
- Cap rate 9.5% vs local median 3.1% in Kissee Mills — top-decile yield for the area; either an underpriced asset or a hidden risk that comps aren't pricing in. Stress-test before assuming the spread holds.
Location & tenants
- Location reads 64/100 on livability (#310 in MO) — a middle-class / working-renter tenant base. Strengths: cost of living A+, housing A, crime B+; Watch: health & safety C-, employment D, amenities F.
- Forsyth R-III (town): math 44% / reading 51% proficiency, ranked #78 of 324 in MO (top 24%) — families likely to look elsewhere, expect single-tenant / working-renter base with shorter leases.
- Zoned schools: Forsyth Elem. (math 37% / reading 47%, grade F, #481 of 1,115 statewide, top 46%, 462 students, 63% FRL); Forsyth Middle (math 47% / reading 54%, grade C, #64 of 391 statewide, top 17%, 343 students, 66% FRL); Forsyth High (math 47% / reading 52%, grade D, #124 of 521 statewide, top 28%, 404 students, 54% FRL) — zoned schools at 61% FRL track the district average.
- Market conditions: 27 active listings in the ZIP; 331 units permitted in Taney County in 2024 (50 in 5+ unit buildings).
Forward outlook
- In year one you build about $451 of equity ($646 loan paydown + $-195 appreciation (-0.2% local appreciation)).
- Taney County population projected at +17% by 2050 — long-run rental-demand tailwind backs the buy-and-hold thesis.
- At projected returns (-0.2% appreciation + 3.0% rent growth), your $26k cash investment doubles in ~7 years — after that, you're playing with house money.
Negotiation context
- Only 0 days on market — expect competitive offers; lowballing is unlikely to land.
- 7 sale attempts since 16y ago with the ask held roughly flat each time — persistent listings suggest the price (not the market) is what's stuck; bring a comps-based counter.
Questions for the listing agent
- Is there a deadline driving the sale (1031 exchange, divorce, estate, relocation)? That informs how much negotiation room exists.
- Schools are F-rated, which usually means shorter tenancies and higher turnover. Who's the typical renter profile here, and what's been the actual vacancy rate?
- What's the average days-on-market for RENTAL listings here right now (not sales)? A rising rental-DOM trend means longer vacancies and softer asking-rent achievability than the comps imply.
- What's the recent tenant-quality profile in this submarket — average credit score on applications, eviction rate, late-payment / NSF rate, and stable-employment percentage? A property-management company in the area should have these aggregated.
- How much new for-sale + rental construction is in the pipeline within 1–3 miles? Heavy new supply typically softens prices + rents 12–24 months out; constrained supply supports both.
Investment metrics
- 1% rule
- 1.20% ✓
- Cap rate
- 9.53%
- Cash-on-cash
- 11.57%
- DSCR
- 1.51
- GRM
- 6.9
CMA / ARV
No comps found within radius.
Projected returns pro-forma
-0.21% appreciation · 3.0% rent growth · sell at horizon
- IRR
- 10.1%
- Equity multiple
- 1.48×
- Total profit
- $12,436
- Equity at exit
- $26,178
- IRR
- 15.2%
- Equity multiple
- 2.64×
- Total profit
- $42,814
- Equity at exit
- $30,703
Cash invested: $26,180 (down + closing). Projections, not guarantees.
Landlord ↔ Tenant lean methodology
- Overall (STATE)
- 81 Strongly Landlord-Friendly
- State Missouri
- 81 Strongly Landlord-Friendly · R+10
- County
- — inherits STATE
- City
- — inherits STATE
ZIP-level market 65680
- Home prices YoY
- -0.1%
- Active inventory
- 27
- Price-to-rent
- 6.9×
Monthly cashflow live
- Estimated rent
- $1,125 medium interval (Pro) →
- Mortgage (P&I)
- −$490
- Tax from tax record
- −$107 /mo · $1,282/yr
- Insurance
- −$39
- HOA
- −$0
- Vacancy / Maint / Mgmt
- −$236
- Net cashflow
- $252
Break-even live
UW: 25.0% down · 7.5% · 30yr · 1.5% tax · 5.0% vac · 8.0% maint · 8.0% mgmt
Financing live
Cash to close
- Down payment
- $23,375
- Closing costs
- $2,805
- Reserves months
- —
- Total cash needed
- —
Loan-product check · same deal, 3 products live
Conventional
25% down · 7.5% · 30yr
- Down + closing
- —
- Monthly P&I
- —
- Monthly cashflow
- —
- DSCR
- —
- Eligible?
- —
Personal DTI + credit; lowest rate.
DSCR
20% down · 8.5% · 30yr
- Down + closing
- —
- Monthly P&I
- —
- Monthly cashflow
- —
- DSCR
- —
- Eligible?
- —
No personal income docs; deal must DSCR.
Hard money
10% down · 12.0% · 12mo
- Down + closing
- —
- Monthly P&I
- —
- Monthly cashflow
- —
- DSCR
- —
- Eligible?
- —
Short-term bridge; refi at stabilization.
Listing history 16 events
-
2026-05-23historical
-
2026-05-22$93,500
-
2025-05-14soldstatus
-
2025-05-13soldstatus Closed
-
2025-04-05status Pending
-
2025-04-03$299,900 Active
-
2016-12-15soldstatus
-
2016-12-15soldstatus
-
2016-11-26$150,000
-
2015-01-14soldstatus
-
2015-01-12soldstatus
-
2014-11-29$130,000
-
2013-06-25$149,900
-
2011-02-02$143,500
-
2010-04-19$149,900
-
2006-09-15soldstatus
ⓘ Source: listings_history table (triggers on properties + properties_extension) + one-shot
backfill from property_details.listing_events for pre-trigger history.
Tax reassessment forecast MO · Resets to sale price
- Current annual tax
- $1,282 · $107/mo
- Projected year-2 tax
- $1,282 · $107/mo
- Expected delta
- $0/yr ($0/mo · 0.0%)
ⓘ Screening estimate from a state-policy table — verify with the county assessor before closing.
Climate risk First Street
- Flood 1/10 Low FEMA zone X (unshaded) · 0% chance over 30 yrs
- Wildfire 4/10 Moderate
- Heat 4/10 Moderate 7 d/yr ≥106°F today · 20 d/yr by 30 yrs out
- Wind 2/10 Low 100% chance of damaging wind over 30 yrs
- Air quality 2/10 Low 0 unhealthy d/yr today · 1 by 30 yrs out
Nearby sold comps map
Loading sold comps map…
Walkable amenities ~0.75 mi
Loading nearby amenities…
Taxation est. · year 1
- Rental income
- $13,496
- − Mortgage interest
- −$5,237
- − Property taxes
- −$1,282
- − Insurance
- −$468
- − Repairs & maintenance
- −$1,080
- − Management
- −$1,080
- − Depreciation
- −$2,720
- Taxable income
- $1,630
- Est. tax owed @ 24.0%
- −$391
- After-tax cash flow
- $2,637/yr
For passive investors: Depreciation is non-cash, so a rental often shows a tax loss while cash-flowing — sheltering income. Rental losses are passive: they offset passive income freely, and up to $25,000/yr can offset ordinary (W-2) income if you actively participate and your MAGI is under $100k (phasing out to $0 by $150k); unused losses carry forward. On sale, claimed depreciation is recaptured at up to 25%, and gains may owe capital-gains tax (a 1031 exchange can defer both). Figures are a year-1 estimate at your 24.0% rate — not tax advice; consult a CPA.
Schools (NCES district)
- District
- Forsyth R-III
- NCES district ID
- 2912240
- Math proficiency
- 44% ▬ 0.00%
- Reading proficiency
- 51% ▼ -3.00%
- Median HH income
- $35,521
- Composite
- 39.31/100
- National rank
- #3991
- State rank
- #78 of 324 in MO
Livability — Kissee Mills
- Score
- 64/100
- State rank
- #310
- US rank
- #14191
Category grades
Schools grade is shown separately in the Schools card above.
Census & demographics
- Census place
- Kissee Mills, MO
- Population (ZIP)
- 1,156
Population outlook (Taney County) Hauer SSP2
- Today (2025)
- 59,017 people
- By 2030
- 61,235 · +3.8%
- By 2040
- 65,225 · +10.5%
- By 2050
- 68,842 · +16.6%
- By 2075
- 77,705 · +31.7%
- By 2100
- 82,002 · +38.9%
Race, ethnicity, and origin ACS 2023
- Neighborhood character
- Predominantly White (89%)
- Race & ethnicity
- White 89% Hispanic / Latino 8% Two or more races 2%
- Hispanic origin (detail)
- Mexican 7%
- Common ancestry
- Romanian 2% Slovak 1% Italian 1%
- Foreign-born
- 2% · Canada
- Languages at home
- 98% English-only · Tagalog/Filipino 1% Spanish 1%
Political lean MEDSL · Taney
- 2024 margin
- Solid R (+59.3) · D 19.9% · R 79.2%
- 2008→2024 swing
- -22.2pp toward R · 2008: -37.2pp · 2024: -59.3pp
- All cycles
- 2024: R+59.3 2020: R+57.7 2016: R+59.3 2012: R+47.4 2008: R+37.2
Not yet ingested
- Civics
- —
Market trends
- HPI YoY
- ▼ -0.21%
- Current HPI
- 235.9719
- Rent YoY
- —
- Metro
- —
- State GDP YoY
- ▲ 1.84%
- F500 in state
- 20
Industry mix (Fortune 500 HQ in MO)
| Industry | F500 HQs | Revenue |
|---|---|---|
| Healthcare | 1 | $163B |
|
||
| Insurance | 1 | $21B |
|
||
| Industrial Technology | 1 | $17B |
|
||
| Retail | 1 | $16B |
|
||
| Industrial Distribution | 1 | $10B |
|
||
| Utilities | 1 | $9B |
|
||
Price history
-37.6% since first listed16 events — show timeline
- 2026-05-23 Delisted — SOMO
- 2026-05-22 Listed $93,500 SOMO
- 2025-05-14 Sold (Public Records) — Public Records
- 2025-05-13 Sold (MLS) — SOMO
- 2025-04-05 Pending — SOMO
- 2025-04-03 Listed $299,900 SOMO
- 2016-12-15 Sold (Public Records) — Public Records
- 2016-12-15 Sold (MLS) — SOMO
- 2016-11-26 Listed $150,000 SOMO
- 2015-01-14 Sold (Public Records) — Public Records
- 2015-01-12 Sold (MLS) — SOMO
- 2014-11-29 Listed $130,000 SOMO
- 2013-06-25 Listed $149,900 SOMO
- 2011-02-02 Listed $143,500 SOMO
- 2010-04-19 Listed $149,900 SOMO
- 2006-09-15 Sold (Public Records) — Public Records
Property tax history
+0.3%/yrLatest (2025): $1,282 · -9.3% YoY. Source: county tax records.
Cash-flow waterfall
monthlySold comps — $/sqft
last 12 mo · ≤1 miLoading sold comps…