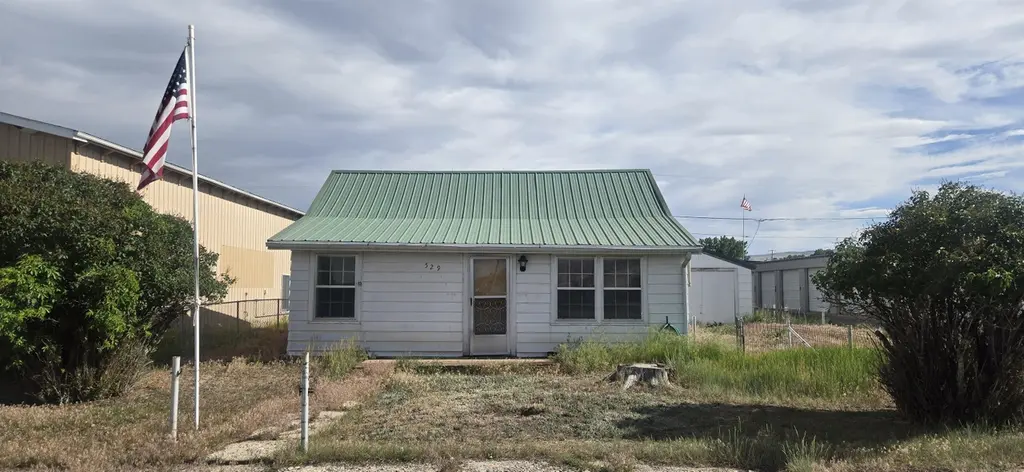
529 Washakie St · Thermopolis, WY
Flood risk 5/10 · Moderate
- FEMA flood zone
- —
- Chance of flooding over 30 yrs
- 0.33%
- Est. flood insurance / yr
- —
Fire risk 5/10 · Moderate
- Est. fire insurance / yr
- $564 – $1,046
Heat risk 4/10 · Minor
- Hot days now (above 93°F)
- 7 days/yr
- Hot days in 30 yrs
- 19 days/yr
Wind risk 1/10 · Minimal
- Chance of severe wind over 30 yrs
- —
Air-quality risk 2/10 · Minimal
- Unhealthy air days now
- 1 days/yr
- Unhealthy air days in 30 yrs
- 3 days/yr
Risk factors via First Street. Map © Google.
Why this score? — see what drove the B- grade
The composite is a weighted blend of 9 inputs, each scored 0–100. Each bar is that input's sub-score; the figure is the points it added to the 100-point composite (weight × sub-score).
- Cash flow +28.3/30.0
- DSCR +10.0/10.0
- ARV discount +7.5/15.0
- 1% rule +7.0/10.0
- Schools +5.5/10.0
- Livability +3.9/5.0
- Rent growth +2.5/5.0
- Condition / age +2.5/5.0
- Appreciation +0.2/10.0
$75,000
🖨 Deal sheet 📄 Offer letter ✓ Due diligence
Key facts
- 7,841 sq ft lot
- Garage
- Built 1917
Property features AI
Exterior
- Parking: Has garage; 1-car garage
- Utilities: Public water; Public sewer; Natural gas available
- Home design: Single-family residence; Residential property
- Construction: Metal siding
- Exterior features: Aluminum roof
Interior
- Kitchen: Range; Oven; Refrigerator; Dishwasher not listed
- Flooring: Carpet; Hardwood; Vinyl
- Heating & cooling: Forced air heating; Has heating
- Interior features: Partial basement; Has view
- Laundry & utility: Washer; Dryer
Neighborhood map
What this means for you Summary
Snapshot
- This is a 2-bed/1.0-bath single-family listed at $75k.
Deal economics
- At list price, monthly cash flow is $240 ($3k/yr) — positive.
- The deal already cash-flows at list — no discount required.
- Meets the 1% rule at list price ($896 rent vs $75k).
- Cap rate 10.1% vs local median 3.8% in Thermopolis — top-decile yield for the area; either an underpriced asset or a hidden risk that comps aren't pricing in. Stress-test before assuming the spread holds.
Location & tenants
- Location reads 77/100 on livability (#12 in WY, #3,016 nationally) — a middle-class / working-renter tenant base. Strengths: crime A+, cost of living A+, housing A+; Watch: amenities F, commute F.
- Hot Springs County School District #1 (town): math 66% / reading 65% proficiency, ranked #3 of 41 in WY (top 7%) — acceptable for families but not a draw, mixed tenant base, ~2y average lease.
- Zoned schools: Ralph Witters Elementary (math 62% / reading 62%, grade B, #30 of 151 statewide, top 26%, 242 students, 42% FRL); Thermopolis Middle School (math 77% / reading 74%, grade A, #1 of 55 statewide, top 0%, 197 students, 42% FRL); Hot Springs County High School (math 47% / reading 52%, grade D, #33 of 75 statewide, top 49%, 203 students, 31% FRL).
- Market conditions: 58 active listings in the ZIP; 7 units permitted in Hot Springs County in 2024 (0 in 5+ unit buildings).
Forward outlook
- Local home prices are declining (-3.0%/yr); year-one equity from $519 of loan paydown is wiped out by about $2k of value loss. Plan a longer hold.
- Hot Springs County population projected to shrink 7% by 2050 — rents likely to lag national; underwrite the cash flow, not the appreciation.
- At projected returns (-3.0% appreciation + 3.0% rent growth), your $21k cash investment doubles in ~9 years — after that, you're playing with house money.
Negotiation context
- Only 8 days on market — expect competitive offers; lowballing is unlikely to land.
Risks & watch-outs
- Watch-outs: built in 1917 — expect roof / HVAC / electrical / plumbing capex.
- Climate carrying-cost: moderate flood risk; moderate wildfire risk — expect insurance premiums to compound above CPI over the hold.
Questions for the listing agent
- Built in 1917 — when were the roof, HVAC, electrical panel, plumbing, and water heater last replaced?
- Is there a deadline driving the sale (1031 exchange, divorce, estate, relocation)? That informs how much negotiation room exists.
- Schools are B-rated — typically a magnet for longer-tenancy family renters. What's the average tenant stay here, and is there a school-zone premium baked into asking?
- What's the average days-on-market for RENTAL listings here right now (not sales)? A rising rental-DOM trend means longer vacancies and softer asking-rent achievability than the comps imply.
- What's the recent tenant-quality profile in this submarket — average credit score on applications, eviction rate, late-payment / NSF rate, and stable-employment percentage? A property-management company in the area should have these aggregated.
- How much new for-sale + rental construction is in the pipeline within 1–3 miles? Heavy new supply typically softens prices + rents 12–24 months out; constrained supply supports both.
Investment metrics
- 1% rule
- 1.20% ✓
- Cap rate
- 10.14%
- Cash-on-cash
- 13.73%
- DSCR
- 1.61
- GRM
- 7.0
CMA / ARV
- ARV (on-the-fly)
- $204,465
- Comps found
- 6
Show comp detail 6 sales within ~0.75 mi
| Address | Dist | Beds/Ba | Sqft | Sold | Price | $/sf | Match |
|---|---|---|---|---|---|---|---|
| 720 Richards St | 0.20mi | 2/1.0 | 973 (+2%) | 1mo | $130,000 | $134 | 86 |
| 629 Amoretti St | 0.18mi | 3/1.8 (+1) | 980 (+3%) | 13mo | $100,000 | $102 | 68 |
| 721 Broadway St | 0.48mi | 1/1.0 (-1) | 860 (-10%) | 2mo | $56,000 | $65 | 55 |
| 128 Clark St | 0.45mi | 2/1.8 | 897 (-6%) | 18mo | $198,000 | $221 | 52 |
| 222 N 7th St | 0.64mi | 3/1.0 (+1) | 988 (+4%) | 9mo | $219,000 | $222 | 52 |
| 1212 Clark St | 0.64mi | 2/1.5 | 1,071 (+13%) | 18mo | $229,900 | $215 | 32 |
Match score weights: distance 35% · size 25% · config 20% · recency 20%. Top-matched comps best support the ARV.
Projected returns pro-forma
-3.0% appreciation · 3.0% rent growth · sell at horizon
- IRR
- 3.9%
- Equity multiple
- 1.15×
- Total profit
- $3,131
- Equity at exit
- $11,183
- IRR
- 13.4%
- Equity multiple
- 2.06×
- Total profit
- $22,359
- Equity at exit
- $6,485
Cash invested: $21,000 (down + closing). Projections, not guarantees.
Landlord ↔ Tenant lean methodology
- Overall (STATE)
- 90 Strongly Landlord-Friendly
- State Wyoming
- 90 Strongly Landlord-Friendly · R+25
- County
- — inherits STATE
- City
- — inherits STATE
ZIP-level market 82443
- Home prices YoY
- -2.9%
- Active inventory
- 58
- Price-to-rent
- 7.0×
Monthly cashflow live
- Estimated rent
- $896 medium interval (Pro) →
- Mortgage (P&I)
- −$393
- Tax from tax record
- −$43 /mo · $521/yr
- Insurance
- −$31
- HOA
- −$0
- Vacancy / Maint / Mgmt
- −$188
- Net cashflow
- $240
Break-even live
UW: 25.0% down · 7.5% · 30yr · 1.5% tax · 5.0% vac · 8.0% maint · 8.0% mgmt
Financing live
Cash to close
- Down payment
- $18,750
- Closing costs
- $2,250
- Reserves months
- —
- Total cash needed
- —
Loan-product check · same deal, 3 products live
Conventional
25% down · 7.5% · 30yr
- Down + closing
- —
- Monthly P&I
- —
- Monthly cashflow
- —
- DSCR
- —
- Eligible?
- —
Personal DTI + credit; lowest rate.
DSCR
20% down · 8.5% · 30yr
- Down + closing
- —
- Monthly P&I
- —
- Monthly cashflow
- —
- DSCR
- —
- Eligible?
- —
No personal income docs; deal must DSCR.
Hard money
10% down · 12.0% · 12mo
- Down + closing
- —
- Monthly P&I
- —
- Monthly cashflow
- —
- DSCR
- —
- Eligible?
- —
Short-term bridge; refi at stabilization.
Listing history 7 events
-
2026-06-18days on market $75,000 Active 8 DOM
-
2026-06-17days on market $75,000 Active 7 DOM
-
2026-06-16days on market $75,000 Active 6 DOM
-
2026-06-15days on market $75,000 Active 5 DOM
-
2026-06-15days on market $75,000 Active 4 DOM
-
2026-06-13days on market $75,000 Active 3 DOM
-
2026-06-12$75,000 Active 2 DOM
ⓘ Source: listings_history table (triggers on properties + properties_extension) + one-shot
backfill from property_details.listing_events for pre-trigger history.
Tax reassessment forecast WY · Resets to sale price
- Current annual tax
- $521 · $43/mo
- Projected year-2 tax
- $521 · $43/mo
- Expected delta
- $0/yr ($0/mo · 0.0%)
ⓘ Screening estimate from a state-policy table — verify with the county assessor before closing.
Climate risk First Street
- Flood 5/10 Major 33% chance over 30 yrs
- Wildfire 5/10 Major
- Heat 4/10 Moderate 7 d/yr ≥93°F today · 19 d/yr by 30 yrs out
- Wind 1/10 Low
- Air quality 2/10 Low 1 unhealthy d/yr today · 3 by 30 yrs out
Nearby sold comps map
Loading sold comps map…
Walkable amenities ~0.75 mi
Loading nearby amenities…
Taxation est. · year 1
- Rental income
- $10,758
- − Mortgage interest
- −$4,201
- − Property taxes
- −$521
- − Insurance
- −$375
- − Repairs & maintenance
- −$861
- − Management
- −$861
- − Depreciation
- −$2,182
- Taxable income
- $1,758
- Est. tax owed @ 24.0%
- −$422
- After-tax cash flow
- $2,461/yr
For passive investors: Depreciation is non-cash, so a rental often shows a tax loss while cash-flowing — sheltering income. Rental losses are passive: they offset passive income freely, and up to $25,000/yr can offset ordinary (W-2) income if you actively participate and your MAGI is under $100k (phasing out to $0 by $150k); unused losses carry forward. On sale, claimed depreciation is recaptured at up to 25%, and gains may owe capital-gains tax (a 1031 exchange can defer both). Figures are a year-1 estimate at your 24.0% rate — not tax advice; consult a CPA.
Schools (NCES district)
- District
- Hot Springs County School District #1
- NCES district ID
- 5603310
- Math proficiency
- 66% ▲ 3.00%
- Reading proficiency
- 65% ▲ 4.00%
- Median HH income
- $45,061
- Composite
- 55.18/100
- National rank
- #1275
- State rank
- #3 of 41 in WY
Livability — Thermopolis
- Score
- 77/100
- State rank
- #12
- US rank
- #3016
Category grades
Schools grade is shown separately in the Schools card above.
Census & demographics
- Census place
- Thermopolis, WY
- Population (ZIP)
- 4,534
Population outlook (Hot Springs County) Hauer SSP2
- Today (2025)
- 4,645 people
- By 2030
- 4,542 · -2.2%
- By 2040
- 4,371 · -5.9%
- By 2050
- 4,337 · -6.6%
- By 2075
- 4,479 · -3.6%
- By 2100
- 4,570 · -1.6%
Race, ethnicity, and origin ACS 2023
- Neighborhood character
- Predominantly White (89%)
- Race & ethnicity
- White 89% Two or more races 7% Hispanic / Latino 4%
- Common ancestry
- Portuguese 6% Serbian 5% Italian 2%
- Foreign-born
- 1% · Canada
- Languages at home
- 98% English-only · Spanish 2%
Political lean MEDSL · Hot Springs
- 2024 margin
- Solid R (+61.2) · D 18.7% · R 80.0% · Other 1.3%
- 2008→2024 swing
- -13.5pp toward R · 2008: -47.7pp · 2024: -61.2pp
- All cycles
- 2024: R+61.2 2020: R+58.9 2016: R+60.7 2012: R+55.0 2008: R+47.7
Not yet ingested
- Civics
- —
Market trends
- HPI YoY
- ▼ -9.70%
- Current HPI
- 325.59
- Rent YoY
- —
- Metro
- —
- State GDP YoY
- —
- F500 in state
- 0
Price history
2 events — show timeline
- 2026-06-08 Listed $75,000 WMLS
- 2009-10-01 Sold (Public Records) — Public Records
Property tax history
+2.9%/yrLatest (2025): $521 · -21.1% YoY. Source: county tax records.
Cash-flow waterfall
monthlySold comps — $/sqft
last 12 mo · ≤1 miLoading sold comps…