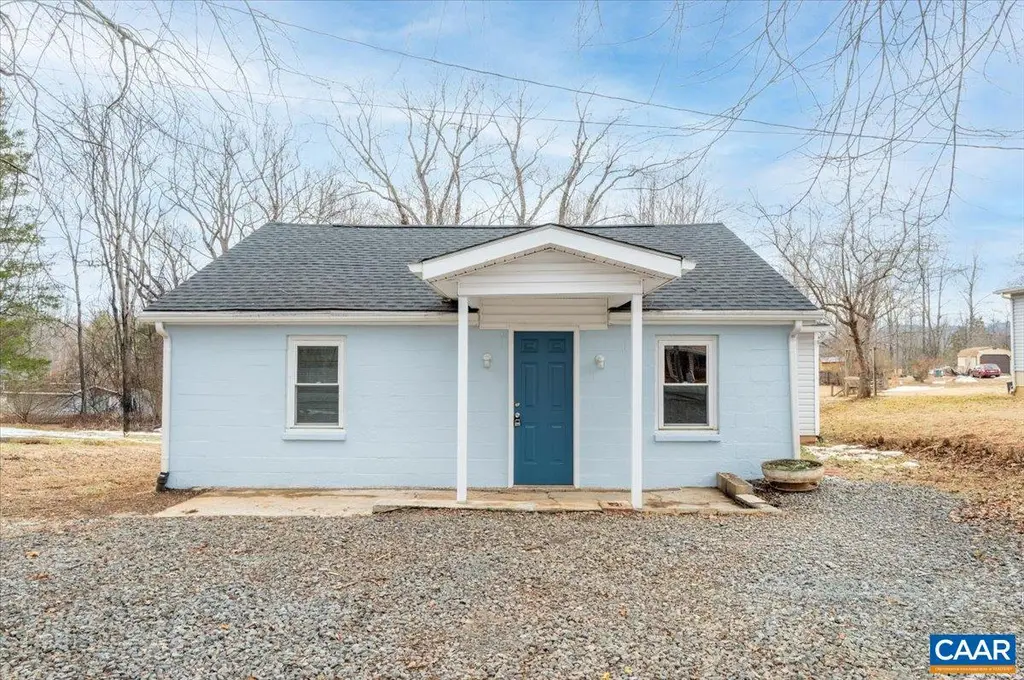
662 Celt Rd · Stanardsville, VA
Flood risk 1/10 · Minimal
- FEMA flood zone
- X (unshaded)
- Chance of flooding over 30 yrs
- 0.0%
- Est. flood insurance / yr
- $473 – $860
Fire risk 5/10 · Moderate
- Est. fire insurance / yr
- $666 – $1,236
Heat risk 6/10 · Moderate
- Hot days now (above 103°F)
- 7 days/yr
- Hot days in 30 yrs
- 17 days/yr
Wind risk 2/10 · Minimal
- Chance of severe wind over 30 yrs
- 2.0%
Air-quality risk 1/10 · Minimal
- Unhealthy air days now
- 0 days/yr
- Unhealthy air days in 30 yrs
- 0 days/yr
Risk factors via First Street. Map © Google.
Why this score? — see what drove the C grade
The composite is a weighted blend of 9 inputs, each scored 0–100. Each bar is that input's sub-score; the figure is the points it added to the 100-point composite (weight × sub-score).
- Cash flow +23.1/30.0
- ARV discount +9.0/15.0
- DSCR +7.4/10.0
- 1% rule +4.8/10.0
- Schools +4.5/10.0
- Livability +3.5/5.0
- Rent growth +2.5/5.0
- Condition / age +2.5/5.0
- Appreciation +0.0/10.0
$275,000
🖨 Deal sheet (PDF) 📄 Offer letter ✓ Due diligence
Listing remarks MLS
Come see this Affordable fully renovated 3 bed 1.5 bath in Stanardsville! This bungalow style home has been tastefully renovated and improved from top to bottom. All major systems, roof, windows, HVAC, water heater are brand new. Inside features all new LVP flooring, new insulated drywall and fresh paint throughout. Newer stainless appliances in the kitchen with new cabinets and granite counter tops. This house also features a convenient laundry room with washer and dryer that convey. The adjacent . 32 acre buildable lot (parcel 37 5 3) is also a part of this sale, and could be sold separately by the new owner. This house is Affordable and Move In ready. Come see it before it's Gone!
Key facts
- 0.28 acre lot
- Built 1965
- Listed 122 days
Neighborhood map
What this means for you Summary
Snapshot
- This is a 3-bed/1.0-bath single-family listed at $275k.
Deal economics
- At list price, monthly cash flow is $494 ($6k/yr) — positive.
- The deal already cash-flows at list — no discount required.
- To meet the 1% rule (rent ≥ 1% of price), the offer needs to be $269k (2.2% below list).
- Recommended offer: $242k (12.0% below list) — sets the bar for market timing.
- Cap rate 8.4% vs local median 4.8% in Stanardsville — top-decile yield for the area; either an underpriced asset or a hidden risk that comps aren't pricing in. Stress-test before assuming the spread holds.
Location & tenants
- Location reads 69/100 on livability (#243 in VA) — a middle-class / working-renter tenant base. Strengths: health & safety A+, cost of living A-, housing A-; Watch: employment D+, amenities F, commute F.
- Greene County Public School District (town): math 40% / reading 64% proficiency, ranked #88 of 131 in VA (top 67%) — acceptable for families but not a draw, mixed tenant base, ~2y average lease.
- Zoned schools: Nathanael Greene Elementary (math 38% / reading 54%, grade D-, #821 of 1,108 statewide, top 74%, 353 students, 68% FRL); William Monroe Middle (math 36% / reading 65%, grade C, #226 of 342 statewide, top 67%, 675 students, 67% FRL); William Monroe High (math 40% / reading 78%, grade C+, #256 of 319 statewide, top 81%, 957 students, 67% FRL) — zoned schools average 67% FRL vs 32% district-wide (36 pts higher); higher-poverty schools than district average — tighter screening recommended.
- Market conditions: 83 active listings in the ZIP; 1 comparable units currently listed for rent nearby; 204 units permitted in Greene County in 2024 (34 in 5+ unit buildings).
Forward outlook
- Local home prices are declining (-3.0%/yr); year-one equity from $2k of loan paydown is wiped out by about $8k of value loss. Plan a longer hold.
- Greene County population projected at +6% by 2050 — modest demand growth; plan on rents tracking national, not racing it.
Negotiation context
- It's been on market 122 days — a 12% lower offer ($242k) is reasonable based on typical stale-listing flexibility.
- 5 sale attempts since 3y ago with the ask held roughly flat each time — persistent listings suggest the price (not the market) is what's stuck; bring a comps-based counter.
- Current owner paid $102k; list at $275k implies a 168% gain — meaningful room to come down on a strong offer.
Risks & watch-outs
- Climate carrying-cost: moderate wildfire risk; extreme-heat days projected 7→17/yr by 2055 (HVAC capex compounding) — expect insurance premiums to compound above CPI over the hold.
Questions for the listing agent
- It's been on market 122 days. Have you received any prior offers? Is the seller open to a 12% concession, seller financing, or rate buy-down credit?
- Built in 1965 — when were the roof, HVAC, electrical panel, plumbing, and water heater last replaced?
- Why hasn't it sold? Are there any deal-killer items the seller is aware of (foundation, flood, title, zoning, code violations)?
- Is there a deadline driving the sale (1031 exchange, divorce, estate, relocation)? That informs how much negotiation room exists.
- Schools are A-rated — typically a magnet for longer-tenancy family renters. What's the average tenant stay here, and is there a school-zone premium baked into asking?
- What's the average days-on-market for RENTAL listings here right now (not sales)? A rising rental-DOM trend means longer vacancies and softer asking-rent achievability than the comps imply.
- What's the recent tenant-quality profile in this submarket — average credit score on applications, eviction rate, late-payment / NSF rate, and stable-employment percentage? A property-management company in the area should have these aggregated.
- How much new for-sale + rental construction is in the pipeline within 1–3 miles? Heavy new supply typically softens prices + rents 12–24 months out; constrained supply supports both.
Investment metrics
- 1% rule
- 0.98% ✗
- Cap rate
- 8.45%
- Cash-on-cash
- 7.70%
- DSCR
- 1.34
- GRM
- 8.5
CMA / ARV
- ARV (median comp)
- $284,693
- List price
- $275,000
- Delta
- -3.40%
- Verdict
- FAIR
- Comps
- 20 within 1.0 mi
Show comp detail 3 sales within ~0.75 mi
| Address | Dist | Beds/Ba | Sqft | Sold | Price | $/sf | Match |
|---|---|---|---|---|---|---|---|
| 60 Sunset Cir | 0.38mi | 2/1.0 (-1) | 1,080 (-1%) | 20mo | $280,000 | $259 | 60 |
| 300 William Mills Dr | 0.43mi | 2/2.0 (-1) | 1,092 (+0%) | 21mo | $280,000 | $256 | 53 |
| 81 Pendleton Way | 0.56mi | 2/2.0 (-1) | 1,103 (+1%) | 20mo | $280,000 | $254 | 46 |
Match score weights: distance 35% · size 25% · config 20% · recency 20%. Top-matched comps best support the ARV.
Projected returns pro-forma
-3.0% appreciation · 3.0% rent growth · sell at horizon
- IRR
- -4.6%
- Equity multiple
- 0.83×
- Total profit
- $-13,214
- Equity at exit
- $41,003
- IRR
- 5.0%
- Equity multiple
- 1.37×
- Total profit
- $28,512
- Equity at exit
- $23,777
Cash invested: $77,000 (down + closing). Projections, not guarantees.
Landlord ↔ Tenant lean methodology
- Overall (STATE)
- 55 Moderately Landlord-Leaning
- State Virginia
- 55 Moderately Landlord-Leaning · D+2
- County
- — inherits STATE
- City
- — inherits STATE
ZIP-level market 22973
- Home prices YoY
- -25.3%
- Active inventory
- 83
- Price-to-rent
- 8.5×
Monthly cashflow live
- Estimated rent
- $2,690 medium interval (Pro) →
- Mortgage (P&I)
- −$1,442
- Tax from tax record
- −$74 /mo · $891/yr
- Insurance
- −$115
- HOA
- −$0
- Vacancy / Maint / Mgmt
- −$565
- Net cashflow
- $494
Break-even live
Sensitivity live
| Price | -10% $650 | -5% $572 | +0% $494 | +5% $416 | +10% $338 |
|---|---|---|---|---|---|
| Rent | -10% $282 | -5% $388 | +0% $494 | +5% $600 | +10% $707 |
| Rate | -1.0pp $633 | -0.5pp $564 | base $494 | +0.5pp $423 | +1.0pp $350 |
UW: 25.0% down · 7.5% · 30yr · 1.5% tax · 5.0% vac · 8.0% maint · 8.0% mgmt
Financing live
Cash to close
- Down payment
- $68,750
- Closing costs
- $8,250
- Reserves months
- —
- Total cash needed
- —
Loan-product check · same deal, 3 products live
Conventional
25% down · 7.5% · 30yr
- Down + closing
- —
- Monthly P&I
- —
- Monthly cashflow
- —
- DSCR
- —
- Eligible?
- —
Personal DTI + credit; lowest rate.
DSCR
20% down · 8.5% · 30yr
- Down + closing
- —
- Monthly P&I
- —
- Monthly cashflow
- —
- DSCR
- —
- Eligible?
- —
No personal income docs; deal must DSCR.
Hard money
10% down · 12.0% · 12mo
- Down + closing
- —
- Monthly P&I
- —
- Monthly cashflow
- —
- DSCR
- —
- Eligible?
- —
Short-term bridge; refi at stabilization.
Rent comps 1 comps
| Address | Beds | Baths | Sqft | Rent | $/sqft | DOM | Units | Dist |
|---|---|---|---|---|---|---|---|---|
| 477 Westwood Rd Stanardsville, VA | 2.0 | 2.0 | 1450 | $2,690 | $1.86 | 0d | 1 | 0.85mi |
Listing history 31 events
-
2026-06-22days on market $275,000 Active 122 DOM
-
2026-06-19days on market $275,000 Active 120 DOM
-
2026-06-18days on market $275,000 Active 119 DOM
-
2026-06-17days on market $275,000 Active 118 DOM
-
2026-06-16days on market $275,000 Active 117 DOM
-
2026-06-15days on market $275,000 Active 116 DOM
-
2026-06-14days on market $275,000 Active 114 DOM
-
2026-06-13days on market $275,000 Active 113 DOM
-
2026-06-10days on market $275,000 Active 111 DOM
-
2026-06-09days on market $275,000 Active 110 DOM
-
2026-06-08days on market $275,000 Active 109 DOM
-
2026-06-07days on market $275,000 Active 108 DOM
-
2026-06-05days on market $275,000 Active 105 DOM
-
2026-06-03days on market $275,000 Active 104 DOM
-
2026-06-02days on market $275,000 Active 103 DOM
-
2026-06-01days on market $275,000 Active 102 DOM
-
2026-05-31days on market $275,000 Active 101 DOM
-
2026-05-30days on market $275,000 Active 100 DOM
-
2026-02-19$275,000 Active 692-char remark
Show marketing remark (692 chars)
Come see this Affordable fully renovated 3 bed 1.5 bath in Stanardsville! This bungalow style home has been tastefully renovated and improved from top to bottom. All major systems, roof, windows, HVAC, water heater are brand new. Inside features all new LVP flooring, new insulated drywall and fresh paint throughout. Newer stainless appliances in the kitchen with new cabinets and granite counter tops. This house also features a convenient laundry room with washer and dryer that convey. The adjacent . 32 acre buildable lot (parcel 37 5 3) is also a part of this sale, and could be sold separately by the new owner. This house is Affordable and Move In ready. Come see it before it's Gone!
-
2024-04-30historical
-
2024-04-30historical
-
2023-10-24price $265,000
-
2023-10-24price $265,000
-
2023-10-24price $265,000
-
2023-10-04$295,000 Active
-
2023-10-04$295,000 Active
-
2023-10-04$295,000 Active
-
2023-04-13soldstatus $102,500 Sold
-
2023-04-07soldstatus $102,500
-
2023-02-24status Pending
-
2023-02-17$84,000 Active
ⓘ Source: listings_history table (triggers on properties + properties_extension) + one-shot
backfill from property_details.listing_events for pre-trigger history.
Tax reassessment forecast VA · Resets to sale price
- Current annual tax
- $891 · $74/mo
- Projected year-2 tax
- $2,255 · $188/mo
- Expected delta
- +$1,364/yr (+$114/mo · 153.1%)
ⓘ Screening estimate from a state-policy table — verify with the county assessor before closing.
Climate risk First Street
- Flood 1/10 Low FEMA zone X (unshaded) · 0% chance over 30 yrs
- Wildfire 5/10 Major
- Heat 6/10 Major 7 d/yr ≥103°F today · 17 d/yr by 30 yrs out
- Wind 2/10 Low 2% chance of damaging wind over 30 yrs
- Air quality 1/10 Low 0 unhealthy d/yr today · 0 by 30 yrs out
Nearby sold comps map
Loading sold comps map…
Walkable amenities ~0.75 mi
Loading nearby amenities…
Taxation est. · year 1
- Rental income
- $32,280
- − Mortgage interest
- −$15,404
- − Property taxes
- −$891
- − Insurance
- −$1,375
- − Repairs & maintenance
- −$2,582
- − Management
- −$2,582
- − Depreciation
- −$8,000
- Taxable income
- $1,445
- Est. tax owed @ 24.0%
- −$347
- After-tax cash flow
- $5,583/yr
For passive investors: Depreciation is non-cash, so a rental often shows a tax loss while cash-flowing — sheltering income. Rental losses are passive: they offset passive income freely, and up to $25,000/yr can offset ordinary (W-2) income if you actively participate and your MAGI is under $100k (phasing out to $0 by $150k); unused losses carry forward. On sale, claimed depreciation is recaptured at up to 25%, and gains may owe capital-gains tax (a 1031 exchange can defer both). Figures are a year-1 estimate at your 24.0% rate — not tax advice; consult a CPA.
Schools (NCES district)
- District
- Greene County Public School District
- NCES district ID
- 5101710
- Math proficiency
- 40% ▼ -37.00%
- Reading proficiency
- 64% ▼ -7.00%
- Median HH income
- $59,129
- Composite
- 45.22/100
- National rank
- #2668
- State rank
- #88 of 131 in VA
Livability — Stanardsville
- Score
- 69/100
- State rank
- #243
- US rank
- #8223
Category grades
Schools grade is shown separately in the Schools card above.
Census & demographics
- Population (ZIP)
- 5,980
Population outlook (Greene County) Hauer SSP2
- Today (2025)
- 20,465 people
- By 2030
- 20,958 · +2.4%
- By 2040
- 21,619 · +5.6%
- By 2050
- 21,699 · +6.0%
- By 2075
- 21,656 · +5.8%
- By 2100
- 20,156 · -1.5%
Race, ethnicity, and origin ACS 2023
- Neighborhood character
- Predominantly White (82%)
- Race & ethnicity
- White 82% Two or more races 9% Black 6% Hispanic / Latino 4% Asian 2%
- Common ancestry
- Italian 3% Romanian 2% Serbian 2%
- Foreign-born
- 3% · Canada, China
- Languages at home
- 96% English-only · Spanish 2% German/W. Germanic 1%
Political lean MEDSL · Greene
- 2024 margin
- Strong R (+24.7) · D 37.0% · R 61.7% · Other 1.2%
- 2008→2024 swing
- -2.9pp toward R · 2008: -21.9pp · 2024: -24.7pp
- All cycles
- 2024: R+24.7 2020: R+23.9 2016: R+31.8 2012: R+25.3 2008: R+21.9
Not yet ingested
- Civics
- —
Market trends
- HPI YoY
- ▼ -61.51%
- Current HPI
- 181.8265
- Rent YoY
- —
- Metro
- —
- State GDP YoY
- ▲ 2.40%
- F500 in state
- 50
Industry mix (Fortune 500 HQ in VA)
| Industry | F500 HQs | Revenue |
|---|---|---|
| Aerospace / Defense | 4 | $236B |
|
||
| Technology / Defense | 3 | $32B |
|
||
| Financial Services | 2 | $176B |
|
||
| Utilities | 2 | $27B |
|
||
| Insurance | 2 | $25B |
|
||
| Technology | 2 | $15B |
|
||
Price history
+227.4% since first listed13 events — show timeline
- 2026-02-19 Listed $275,000 CAAR
- 2024-04-30 Listing Removed — BRIGHT MLS
- 2024-04-30 Listing Removed — CVRMLS
- 2023-10-24 Price Changed $265,000 BRIGHT MLS
- 2023-10-24 Price Changed $265,000 LMLS
- 2023-10-24 Price Changed $265,000 CVRMLS
- 2023-10-04 Listed $295,000 BRIGHT MLS
- 2023-10-04 Listed $295,000 CVRMLS
- 2023-10-04 Listed $295,000 LMLS
- 2023-04-13 Sold (MLS) $102,500 CAAR
- 2023-04-07 Sold (Public Records) $102,500 Public Records
- 2023-02-24 Pending — CAAR
- 2023-02-17 Listed $84,000 CAAR
Property tax history
+9.0%/yrLatest (2025): $891 · +4.9% YoY. Source: county tax records.
Cash-flow waterfall
monthlySold comps — $/sqft
last 12 mo · ≤1 miLoading sold comps…