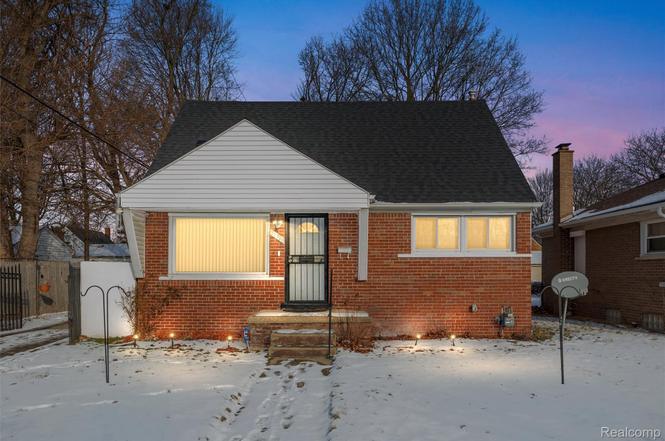
21720 Pembroke Ave · Detroit, MI
Flood risk 1/10 · Minimal
- FEMA flood zone
- X (unshaded)
- Chance of flooding over 30 yrs
- 0.0%
- Est. flood insurance / yr
- $473 – $860
Fire risk 1/10 · Minimal
- Est. fire insurance / yr
- $784 – $1,456
Heat risk 2/10 · Minimal
- Hot days now (above 98°F)
- 7 days/yr
- Hot days in 30 yrs
- 15 days/yr
Wind risk 2/10 · Minimal
- Chance of severe wind over 30 yrs
- —
Air-quality risk 3/10 · Minor
- Unhealthy air days now
- 2 days/yr
- Unhealthy air days in 30 yrs
- 3 days/yr
Risk factors via First Street. Map © Google.
Why this score? — see what drove the B grade
The composite is a weighted blend of 9 inputs, each scored 0–100. Each bar is that input's sub-score; the figure is the points it added to the 100-point composite (weight × sub-score).
- Cash flow +28.9/30.0
- ARV discount +15.0/15.0
- DSCR +10.0/10.0
- 1% rule +7.6/10.0
- Rent growth +4.5/5.0
- Livability +3.7/5.0
- Condition / age +2.5/5.0
- Schools +1.3/10.0
- Appreciation +0.0/10.0
$115,000
🖨 Deal sheet 📄 Offer letter ✓ Due diligence
Listing remarks MLS
DON'T MISS THIS INVESTOR OPPORTUNITY! 1,500 PER MONTH INCOME - Spacious, tenant-occupied 3-bed, 1-bath single-family home in Detroit with immediate cash flow. New roof w/ skylight installed in 2021 (under 5 years old!). Includes a detached garage on a standard lot. Recent renovations completed! READY TO GO! (Current rent increasing to $1,500/month in April) providing a steady income and upside. Brick exterior and solid footprint make this a great long-term hold in an established neighborhood. Property will not be delivered vacant!
Key facts
- Brick exterior
- Recent renovations
- Detached garage
Tags
Property features AI
Exterior
- Parking: Detached 1-car garage
- Utilities: Public water available; Public sewer available
- Home design: Single-family residence; One and one-half stories; Ground-level entry
- Construction: Brick construction; Brick/mortar foundation
- Exterior features: Paved road access; Lot dimensions approximately 53.5 x 110 (0.14 acre)
Interior
- Bathrooms: 1 full bathroom
- Heating & cooling: Forced air heating (natural gas); No cooling
- Interior features: Finished basement; Total of 5 rooms
Neighborhood map
What this means for you Summary
Snapshot
- This is a 3-bed/1.0-bath single-family listed at $115k.
Deal economics
- At list price, monthly cash flow is $391 ($5k/yr) — positive.
- The deal already cash-flows at list — no discount required.
- Meets the 1% rule at list price ($1k rent vs $115k).
- Recommended offer: $105k (9.0% below list) — sets the bar for market timing.
Location & tenants
- Location reads 73/100 on livability (#218 in MI) — a middle-class / working-renter tenant base. Strengths: amenities A+, commute A+, cost of living A+; Watch: schools F, crime F, employment F.
- Detroit Public Schools Community District (urban): math 10% / reading 24% proficiency, ranked #499 of 540 in MI (top 92%) — low school quality limits family demand, transient renter base, plan for 1-2y turnover; 90% free/reduced lunch — lower-income household profile, screen leases tightly.
- Market conditions: Rents rising fast (+8.0%/yr); 305 active listings in the ZIP; 36 comparable units currently listed for rent nearby; rentals at typical pace (median 25d on market — plan ~3-4 weeks tenant-placement turnaround); 44% of comp listings sitting > 30 days — soft ceiling on asking rent; lower-income renter base — watch delinquency; 2,639 units permitted in Wayne County in 2024 (1,216 in 5+ unit buildings).
- This rent runs 40% of the median local income ($44k/yr) — at the standard rent-burdened threshold; future hikes will face affordability resistance.
Forward outlook
- Local home prices are declining (-3.0%/yr); year-one equity from $795 of loan paydown is wiped out by about $3k of value loss. Plan a longer hold.
- Wayne County population projected at -17% by 2050 — secular population decline; favor cash flow + early exit over multi-decade hold.
- At projected returns (-3.0% appreciation + 8.0% rent growth), your $32k cash investment doubles in ~6 years — after that, you're playing with house money.
Negotiation context
- It's been on market 111 days — a 9% lower offer ($105k) is reasonable based on typical stale-listing flexibility.
- 4 sale attempts since 9y ago; this cycle's ask has dropped $26k (18%) from the opening price — seller is motivated, your offer sets the floor, not the list.
- Current owner paid $22k; list at $115k implies a 417% gain — meaningful room to come down on a strong offer.
Risks & watch-outs
- Watch-outs: built in 1951 — expect roof / HVAC / electrical / plumbing capex.
Questions for the listing agent
- It's been on market 111 days. Have you received any prior offers? Is the seller open to a 9% concession, seller financing, or rate buy-down credit?
- Built in 1951 — when were the roof, HVAC, electrical panel, plumbing, and water heater last replaced?
- Why hasn't it sold? Are there any deal-killer items the seller is aware of (foundation, flood, title, zoning, code violations)?
- Is there a deadline driving the sale (1031 exchange, divorce, estate, relocation)? That informs how much negotiation room exists.
- Schools are F-rated, which usually means shorter tenancies and higher turnover. Who's the typical renter profile here, and what's been the actual vacancy rate?
- Crime grade is F in this area — have there been break-ins, vandalism, or insurance claims at this property in the last 3 years? What carrier currently insures it and at what premium?
- What's the average days-on-market for RENTAL listings here right now (not sales)? A rising rental-DOM trend means longer vacancies and softer asking-rent achievability than the comps imply.
- What's the recent tenant-quality profile in this submarket — average credit score on applications, eviction rate, late-payment / NSF rate, and stable-employment percentage? A property-management company in the area should have these aggregated.
- How much new for-sale + rental construction is in the pipeline within 1–3 miles? Heavy new supply typically softens prices + rents 12–24 months out; constrained supply supports both.
Investment metrics
- 1% rule
- 1.26% ✓
- Cap rate
- 10.38%
- Cash-on-cash
- 14.58%
- DSCR
- 1.65
- GRM
- 6.6
CMA / ARV
- ARV (on-the-fly)
- $141,155
- Comps found
- 12
Show comp detail 12 sales within ~0.75 mi
| Address | Dist | Beds/Ba | Sqft | Sold | Price | $/sf | Match |
|---|---|---|---|---|---|---|---|
| 19795 Greydale Ave | 0.05mi | 3/1.5 | 1,247 (-4%) | 4mo | $129,997 | $104 | 86 |
| 20116 Greydale Ave | 0.21mi | 3/1.0 | 1,164 (-10%) | 2mo | $149,500 | $128 | 72 |
| 19950 Houghton St | 0.16mi | 3/2.0 | 1,200 (-7%) | 8mo | $153,000 | $128 | 70 |
| 19211 Pierson St | 0.65mi | 3/1.0 | 1,272 (-2%) | 2mo | $69,000 | $54 | 65 |
| 19900 Lahser Rd | 0.02mi | 2/1.0 (-1) | 1,450 (+12%) | 13mo | $45,000 | $31 | 63 |
| 19785 Chapel St | 0.15mi | 3/2.0 | 1,440 (+11%) | 9mo | $142,000 | $99 | 63 |
| 20274 Greydale Ave | 0.30mi | 3/2.0 | 1,472 (+14%) | 4mo | $159,800 | $109 | 56 |
| 20523 Burt Rd | 0.58mi | 3/2.0 | 1,356 (+5%) | 8mo | $185,000 | $136 | 55 |
| 19266 Cooley St | 0.36mi | 3/1.5 | 1,126 (-13%) | 6mo | $134,000 | $119 | 54 |
| 20370 Cherokee St | 0.72mi | 3/1.5 | 1,208 (-7%) | 1mo | $117,000 | $97 | 53 |
| 20052 Pierson St | 0.56mi | 2/1.5 (-1) | 1,389 (+7%) | 10mo | $88,155 | $63 | 47 |
| 20348 Berg Rd | 0.63mi | 3/1.5 | 1,136 (-12%) | 6mo | $135,000 | $119 | 43 |
Match score weights: distance 35% · size 25% · config 20% · recency 20%. Top-matched comps best support the ARV.
Projected returns pro-forma
-3.0% appreciation · 8.0% rent growth · sell at horizon
- IRR
- 10.4%
- Equity multiple
- 1.43×
- Total profit
- $13,911
- Equity at exit
- $17,147
- IRR
- 23.1%
- Equity multiple
- 3.45×
- Total profit
- $78,899
- Equity at exit
- $9,943
Cash invested: $32,200 (down + closing). Projections, not guarantees.
Landlord ↔ Tenant lean methodology
- Overall (STATE)
- 62 Landlord-Friendly
- State Michigan
- 62 Landlord-Friendly · EVEN
- County
- — inherits STATE
- City
- — inherits STATE
ZIP-level market 48219
- Home prices YoY
- -10.3%
- Rents YoY
- 8.0%
- Active inventory
- 305
- Price-to-rent
- 6.6×
Monthly cashflow live
- Estimated rent
- $1,443 high interval (Pro) →
- Mortgage (P&I)
- −$603
- Tax from tax record
- −$98 /mo · $1,175/yr
- Insurance
- −$48
- HOA
- −$0
- Vacancy / Maint / Mgmt
- −$303
- Net cashflow
- $391
Break-even live
UW: 25.0% down · 7.5% · 30yr · 1.5% tax · 5.0% vac · 8.0% maint · 8.0% mgmt
Financing live
Cash to close
- Down payment
- $28,750
- Closing costs
- $3,450
- Reserves months
- —
- Total cash needed
- —
Loan-product check · same deal, 3 products live
Conventional
25% down · 7.5% · 30yr
- Down + closing
- —
- Monthly P&I
- —
- Monthly cashflow
- —
- DSCR
- —
- Eligible?
- —
Personal DTI + credit; lowest rate.
DSCR
20% down · 8.5% · 30yr
- Down + closing
- —
- Monthly P&I
- —
- Monthly cashflow
- —
- DSCR
- —
- Eligible?
- —
No personal income docs; deal must DSCR.
Hard money
10% down · 12.0% · 12mo
- Down + closing
- —
- Monthly P&I
- —
- Monthly cashflow
- —
- DSCR
- —
- Eligible?
- —
Short-term bridge; refi at stabilization.
Rent comps 36 comps
| Address | Beds | Baths | Sqft | Rent | $/sqft | DOM | Units | Dist |
|---|---|---|---|---|---|---|---|---|
| 19928 Houghton St Detroit, MI | 3.0 | 1.0 | 880 | $1,495 | $1.70 | 11d | 1 | 0.14mi |
| 21422 Pembroke Ave Detroit, MI | 3.0 | 1.5 | 1000 | $1,695 | $1.70 | 16d | 1 | 0.19mi |
| 22238 Pembroke Ave Detroit, MI | 3.0 | 1.5 | 1100 | $1,500 | $1.36 | 43d | 1 | 0.20mi |
| 19810 Blackstone St Detroit, MI | 3.0 | 1.0 | 1216 | $1,395 | $1.15 | 43d | 1 | 0.36mi |
| 20555 Lahser Rd Detroit, MI | 1.0–2.0 | 1.0 | 737 | $975 | $1.32 | 43d | 2 | 0.36mi |
| 19501 Redfern St Detroit, MI | 2.0 | 1.5 | 1816 | $1,350 | $0.74 | 43d | 1 | 0.40mi |
| 22649 Frisbee St Detroit, MI | 3.0 | 1.0 | 1100 | $1,495 | $1.36 | 43d | 1 | 0.49mi |
| 19800 Berg Rd Detroit, MI | 3.0 | 1.0 | 1000 | $1,550 | $1.55 | 16d | 1 | 0.51mi |
| 47129 Wedgewood Southfield, MI | 1.0–2.0 | 1.0–2.0 | 1000 | $1,275 | $1.27 | 43d | 1 | 0.63mi |
| 22570 Seven Mile W Detroit, MI | 2.0 | 1.0 | 890 | $875 | $0.98 | 43d | 1 | 0.66mi |
| 20079 Patton St Detroit, MI | 3.0 | 1.0 | 1150 | $1,550 | $1.35 | 5d | 1 | 0.66mi |
| 19781 Fielding St Detroit, MI | 3.0 | 1.0 | 1000 | $1,294 | $1.29 | 5d | 1 | 0.68mi |
| 21455 Pickford St Detroit, MI | 2.0 | 1.0 | 1000 | $1,275 | $1.27 | 43d | 1 | 0.91mi |
| 18437 Trinity St Detroit, MI | 3.0 | 1.0 | 875 | $1,364 | $1.56 | 15d | 1 | 0.94mi |
| 21434 Karl St Detroit, MI | 2.0 | 1.0 | 1000 | $1,350 | $1.35 | 43d | 1 | 0.95mi |
| 19457 Evergreen Rd Detroit, MI | 2.0 | 1.0 | 1100 | $1,200 | $1.09 | 43d | 1 | 0.98mi |
| 17721 Westbrook St Detroit, MI | 4.0 | 1.0 | 1040 | $1,125 | $1.08 | 24d | 1 | 1.09mi |
| 21451 Glenco St Detroit, MI | 3.0 | 1.0 | 1026 | $1,400 | $1.36 | 16d | 1 | 1.10mi |
| 18556 Kentfield St Detroit, MI | 3.0 | 1.0 | 952 | $1,250 | $1.31 | 2d | 1 | 1.11mi |
| 20284 Melrose St Southfield, MI | 3.0 | 1.0 | 1200 | $1,550 | $1.29 | 43d | 1 | 1.16mi |
| 18461 Heyden St Detroit, MI | 2.0 | 1.0 | 1000 | $1,050 | $1.05 | 5d | 1 | 1.19mi |
| 21440 Bennett St Detroit, MI | 3.0 | 1.0 | 1037 | $1,394 | $1.34 | 16d | 1 | 1.20mi |
| 18205 Stout St Detroit, MI | 3.0 | 1.0 | 901 | $1,078 | $1.20 | 24d | 1 | 1.23mi |
| 20271 Grandville Ave Detroit, MI | 3.0 | 1.0 | 1010 | $1,550 | $1.53 | 24d | 1 | 1.29mi |
| 17624 Patton St Detroit, MI | 3.0 | 1.0 | 1260 | $1,695 | $1.35 | 43d | 1 | 1.30mi |
| 18191 Heyden St Detroit, MI | 2.0 | 1.0 | 917 | $1,100 | $1.20 | 24d | 1 | 1.31mi |
| 17355 McIntyre St Detroit, MI | 3.0 | 1.0 | 1500 | $1,250 | $0.83 | 43d | 1 | 1.38mi |
| 22419 Fairway Dr Southfield, MI | 3.0 | 1.0 | 1262 | $1,850 | $1.47 | 24d | 1 | 1.39mi |
| 19176 Grandville Ave Detroit, MI | 3.0 | 1.0 | 941 | $1,300 | $1.38 | 5d | 1 | 1.40mi |
| 18134 Vaughan St Detroit, MI | 3.0 | 1.0 | 1060 | $1,150 | $1.08 | 16d | 1 | 1.40mi |
| 17328 McIntyre St Unit 2 Detroit, MI | 3.0 | 1.0 | 1200 | $1,250 | $1.04 | 43d | 1 | 1.40mi |
| 17255 Westbrook St Detroit, MI | 3.0 | 2.0 | 1500 | $1,450 | $0.97 | 11d | 1 | 1.42mi |
| 18302 Wormer St Detroit, MI | 3.0 | 1.0 | 1046 | $1,475 | $1.41 | 43d | 1 | 1.46mi |
| 18450 Edinborough Rd Detroit, MI | 3.0 | 1.0 | 1000 | $1,500 | $1.50 | 43d | 1 | 1.46mi |
| 20083 Salem St Detroit, MI | 3.0 | 1.0 | 969 | $1,050 | $1.08 | 11d | 1 | 1.47mi |
| 20083 Salem St Detroit, MI | 3.0 | 1.0 | 969 | $1,050 | $1.08 | 5d | 1 | 1.47mi |
Listing history 16 events
-
2026-04-30status Pending 536-char remark
Show marketing remark (536 chars)
DON'T MISS THIS INVESTOR OPPORTUNITY! 1,500 PER MONTH INCOME - Spacious, tenant-occupied 3-bed, 1-bath single-family home in Detroit with immediate cash flow. New roof w/ skylight installed in 2021 (under 5 years old!). Includes a detached garage on a standard lot. Recent renovations completed! READY TO GO! (Current rent increasing to $1,500/month in April) providing a steady income and upside. Brick exterior and solid footprint make this a great long-term hold in an established neighborhood. Property will not be delivered vacant!
-
2026-04-30status Pending
Show marketing remark (536 chars)
DON'T MISS THIS INVESTOR OPPORTUNITY! 1,500 PER MONTH INCOME - Spacious, tenant-occupied 3-bed, 1-bath single-family home in Detroit with immediate cash flow. New roof w/ skylight installed in 2021 (under 5 years old!). Includes a detached garage on a standard lot. Recent renovations completed! READY TO GO! (Current rent increasing to $1,500/month in April) providing a steady income and upside. Brick exterior and solid footprint make this a great long-term hold in an established neighborhood. Property will not be delivered vacant!
-
2026-04-07price $115,000 536-char remark
Show marketing remark (536 chars)
DON'T MISS THIS INVESTOR OPPORTUNITY! 1,500 PER MONTH INCOME - Spacious, tenant-occupied 3-bed, 1-bath single-family home in Detroit with immediate cash flow. New roof w/ skylight installed in 2021 (under 5 years old!). Includes a detached garage on a standard lot. Recent renovations completed! READY TO GO! (Current rent increasing to $1,500/month in April) providing a steady income and upside. Brick exterior and solid footprint make this a great long-term hold in an established neighborhood. Property will not be delivered vacant!
-
2026-04-07price $115,000
Show marketing remark (536 chars)
DON'T MISS THIS INVESTOR OPPORTUNITY! 1,500 PER MONTH INCOME - Spacious, tenant-occupied 3-bed, 1-bath single-family home in Detroit with immediate cash flow. New roof w/ skylight installed in 2021 (under 5 years old!). Includes a detached garage on a standard lot. Recent renovations completed! READY TO GO! (Current rent increasing to $1,500/month in April) providing a steady income and upside. Brick exterior and solid footprint make this a great long-term hold in an established neighborhood. Property will not be delivered vacant!
-
2026-03-17price $125,900 536-char remark
Show marketing remark (536 chars)
DON'T MISS THIS INVESTOR OPPORTUNITY! 1,500 PER MONTH INCOME - Spacious, tenant-occupied 3-bed, 1-bath single-family home in Detroit with immediate cash flow. New roof w/ skylight installed in 2021 (under 5 years old!). Includes a detached garage on a standard lot. Recent renovations completed! READY TO GO! (Current rent increasing to $1,500/month in April) providing a steady income and upside. Brick exterior and solid footprint make this a great long-term hold in an established neighborhood. Property will not be delivered vacant!
-
2026-03-17price $125,900
Show marketing remark (536 chars)
DON'T MISS THIS INVESTOR OPPORTUNITY! 1,500 PER MONTH INCOME - Spacious, tenant-occupied 3-bed, 1-bath single-family home in Detroit with immediate cash flow. New roof w/ skylight installed in 2021 (under 5 years old!). Includes a detached garage on a standard lot. Recent renovations completed! READY TO GO! (Current rent increasing to $1,500/month in April) providing a steady income and upside. Brick exterior and solid footprint make this a great long-term hold in an established neighborhood. Property will not be delivered vacant!
-
2026-03-07price $134,900 536-char remark
Show marketing remark (536 chars)
DON'T MISS THIS INVESTOR OPPORTUNITY! 1,500 PER MONTH INCOME - Spacious, tenant-occupied 3-bed, 1-bath single-family home in Detroit with immediate cash flow. New roof w/ skylight installed in 2021 (under 5 years old!). Includes a detached garage on a standard lot. Recent renovations completed! READY TO GO! (Current rent increasing to $1,500/month in April) providing a steady income and upside. Brick exterior and solid footprint make this a great long-term hold in an established neighborhood. Property will not be delivered vacant!
-
2026-03-06price $134,900
-
2026-01-09$141,000 Active
Show marketing remark (536 chars)
DON'T MISS THIS INVESTOR OPPORTUNITY! 1,500 PER MONTH INCOME - Spacious, tenant-occupied 3-bed, 1-bath single-family home in Detroit with immediate cash flow. New roof w/ skylight installed in 2021 (under 5 years old!). Includes a detached garage on a standard lot. Recent renovations completed! READY TO GO! (Current rent increasing to $1,500/month in April) providing a steady income and upside. Brick exterior and solid footprint make this a great long-term hold in an established neighborhood. Property will not be delivered vacant!
-
2026-01-09$141,000 Active 536-char remark
Show marketing remark (536 chars)
DON'T MISS THIS INVESTOR OPPORTUNITY! 1,500 PER MONTH INCOME - Spacious, tenant-occupied 3-bed, 1-bath single-family home in Detroit with immediate cash flow. New roof w/ skylight installed in 2021 (under 5 years old!). Includes a detached garage on a standard lot. Recent renovations completed! READY TO GO! (Current rent increasing to $1,500/month in April) providing a steady income and upside. Brick exterior and solid footprint make this a great long-term hold in an established neighborhood. Property will not be delivered vacant!
-
2017-03-30soldstatus $22,244 Sold 296-char remark
Show marketing remark (296 chars)
Listing Broker and Seller assume no responsibility and make no guarantees, representations, warranties (express, implied or otherwise) as to the availability or accuracy of information contained herein. ‘4.5% buyer premium charged to buyer at closing. ’ SHOWING ID:0007090888392
-
2017-03-30soldstatus $22,244 Closed
Show marketing remark (296 chars)
Listing Broker and Seller assume no responsibility and make no guarantees, representations, warranties (express, implied or otherwise) as to the availability or accuracy of information contained herein. ‘4.5% buyer premium charged to buyer at closing. ’ SHOWING ID:0007090888392
-
2017-02-23status Pending
Show marketing remark (296 chars)
Listing Broker and Seller assume no responsibility and make no guarantees, representations, warranties (express, implied or otherwise) as to the availability or accuracy of information contained herein. ‘4.5% buyer premium charged to buyer at closing. ’ SHOWING ID:0007090888392
-
2017-02-23status Pending 296-char remark
Show marketing remark (296 chars)
Listing Broker and Seller assume no responsibility and make no guarantees, representations, warranties (express, implied or otherwise) as to the availability or accuracy of information contained herein. ‘4.5% buyer premium charged to buyer at closing. ’ SHOWING ID:0007090888392
-
2017-01-30$21,600 Active
Show marketing remark (296 chars)
Listing Broker and Seller assume no responsibility and make no guarantees, representations, warranties (express, implied or otherwise) as to the availability or accuracy of information contained herein. ‘4.5% buyer premium charged to buyer at closing. ’ SHOWING ID:0007090888392
-
2017-01-30$21,600 Active 296-char remark
Show marketing remark (296 chars)
Listing Broker and Seller assume no responsibility and make no guarantees, representations, warranties (express, implied or otherwise) as to the availability or accuracy of information contained herein. ‘4.5% buyer premium charged to buyer at closing. ’ SHOWING ID:0007090888392
ⓘ Source: listings_history table (triggers on properties + properties_extension) + one-shot
backfill from property_details.listing_events for pre-trigger history.
Tax reassessment forecast MI · Partial reset (capped growth)
- Current annual tax
- $1,175 · $98/mo
- Projected year-2 tax
- $1,473 · $123/mo
- Expected delta
- +$298/yr (+$25/mo · 25.4%)
ⓘ Screening estimate from a state-policy table — verify with the county assessor before closing.
Climate risk First Street
- Flood 1/10 Low FEMA zone X (unshaded) · 0% chance over 30 yrs
- Wildfire 1/10 Low
- Heat 2/10 Low 7 d/yr ≥98°F today · 15 d/yr by 30 yrs out
- Wind 2/10 Low
- Air quality 3/10 Moderate 2 unhealthy d/yr today · 3 by 30 yrs out
Nearby sold comps map
Loading sold comps map…
Walkable amenities ~0.75 mi
Loading nearby amenities…
Taxation est. · year 1
- Rental income
- $17,320
- − Mortgage interest
- −$6,442
- − Property taxes
- −$1,175
- − Insurance
- −$575
- − Repairs & maintenance
- −$1,386
- − Management
- −$1,386
- − Depreciation
- −$3,345
- Taxable income
- $3,012
- Est. tax owed @ 24.0%
- −$723
- After-tax cash flow
- $3,973/yr
For passive investors: Depreciation is non-cash, so a rental often shows a tax loss while cash-flowing — sheltering income. Rental losses are passive: they offset passive income freely, and up to $25,000/yr can offset ordinary (W-2) income if you actively participate and your MAGI is under $100k (phasing out to $0 by $150k); unused losses carry forward. On sale, claimed depreciation is recaptured at up to 25%, and gains may owe capital-gains tax (a 1031 exchange can defer both). Figures are a year-1 estimate at your 24.0% rate — not tax advice; consult a CPA.
Schools (NCES district)
- District
- Detroit Public Schools Community District
- NCES district ID
- 2601103
- Math proficiency
- 10% ▼ -2.00%
- Reading proficiency
- 24% ▲ 6.00%
- Median HH income
- $25,815
- Composite
- 13.06/100
- National rank
- #9564
- State rank
- #499 of 540 in MI
Livability — Detroit
- Score
- 73/100
- State rank
- #218
- US rank
- #5427
Category grades
Schools grade is shown separately in the Schools card above.
Census & demographics
- Census place
- Detroit, MI
- County
- Wayne County · 1,562,939 people
- City population
- 572,865
- Metro
- Detroit-Warren-Dearborn, MI
- Population (ZIP)
- 47,208
- Household income
- $43,655
- Rent vs Own
- Severe rent burden
- 3584.0
Population outlook (Wayne County) Hauer SSP2
- Today (2025)
- 1,675,273 people
- By 2030
- 1,620,300 · -3.3%
- By 2040
- 1,502,341 · -10.3%
- By 2050
- 1,384,039 · -17.4%
- By 2075
- 1,124,592 · -32.9%
- By 2100
- 881,193 · -47.4%
Race, ethnicity, and origin ACS 2023
- Neighborhood character
- Predominantly Black (88%)
- Race & ethnicity
- Black 88% White 5% Two or more races 4% Hispanic / Latino 1%
- Common ancestry
- Romanian 1% Lithuanian 1%
- Foreign-born
- 2% · Canada
- Languages at home
- 96% English-only · Spanish 1% French/Haitian/Cajun 1%
Political lean MEDSL · Wayne
- 2024 margin
- Strong D (+29.0) · D 62.7% · R 33.7% · Other 3.6%
- 2008→2024 swing
- -20.5pp toward R · 2008: 49.5pp · 2024: 29.0pp
- All cycles
- 2024: D+29.0 2020: D+38.1 2016: D+37.3 2012: D+46.9 2008: D+49.5
Not yet ingested
- Civics
- —
Market trends
- HPI YoY
- ▼ -65.06%
- Current HPI
- 563.3263
- Rent YoY
- ▲ 8.04%
- Metro
- Detroit-Warren-Dearborn, MI
- State GDP YoY
- ▲ 1.37%
- F500 in state
- 28
Industry mix (Fortune 500 HQ in MI)
| Industry | F500 HQs | Revenue |
|---|---|---|
| Automotive Parts | 3 | $48B |
|
||
| Automotive | 2 | $372B |
|
||
| Chemicals | 1 | $45B |
|
||
| Automotive Retail | 1 | $29B |
|
||
| Healthcare / Medical Devices | 1 | $23B |
|
||
| Automotive Technology | 1 | $20B |
|
||
Price history
+432.4% since first listed16 events — show timeline
- 2026-04-30 Pending — MiRealSource-MiMLS
- 2026-04-30 Pending — REALCOMP
- 2026-04-07 Price Changed $115,000 MiRealSource-MiMLS
- 2026-04-07 Price Changed $115,000 REALCOMP
- 2026-03-17 Price Changed $125,900 MiRealSource-MiMLS
- 2026-03-17 Price Changed $125,900 REALCOMP
- 2026-03-07 Price Changed $134,900 MiRealSource-MiMLS
- 2026-03-06 Price Changed $134,900 REALCOMP
- 2026-01-09 Listed $141,000 REALCOMP
- 2026-01-09 Listed $141,000 MiRealSource-MiMLS
- 2017-03-30 Sold (MLS) $22,244 MiRealSource-MiMLS
- 2017-03-30 Sold (MLS) $22,244 REALCOMP
- 2017-02-23 Pending — MiRealSource-MiMLS
- 2017-02-23 Pending — REALCOMP
- 2017-01-30 Listed $21,600 MiRealSource-MiMLS
- 2017-01-30 Listed $21,600 REALCOMP
Property tax history
-4.1%/yrLatest (2025): $1,175 · -37.0% YoY. Source: county tax records.
Cash-flow waterfall
monthlySold comps — $/sqft
last 12 mo · ≤1 miLoading sold comps…