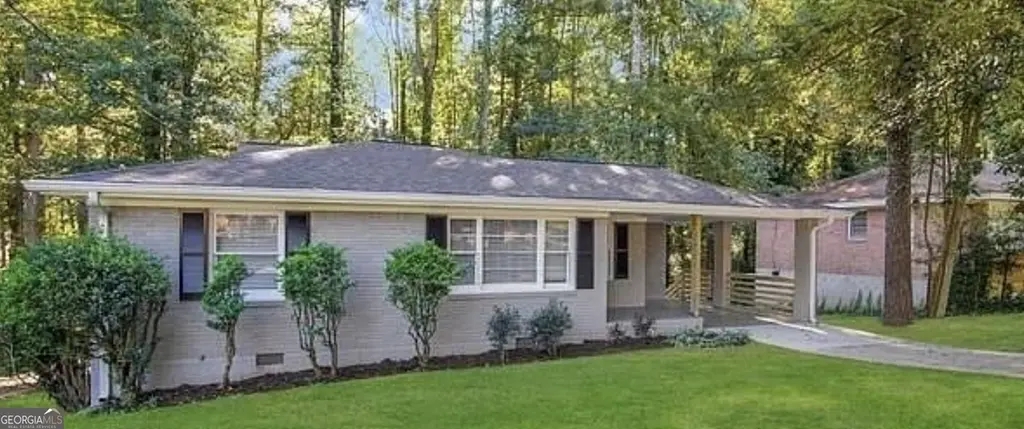
2364 Farley St · East Point, GA
Flood risk 1/10 · Minimal
- FEMA flood zone
- X (unshaded)
- Chance of flooding over 30 yrs
- 0.0%
- Est. flood insurance / yr
- $473 – $860
Fire risk 1/10 · Minimal
- Est. fire insurance / yr
- $963 – $1,789
Heat risk 5/10 · Moderate
- Hot days now (above 103°F)
- 7 days/yr
- Hot days in 30 yrs
- 17 days/yr
Wind risk 5/10 · Moderate
- Chance of severe wind over 30 yrs
- 25.0%
Air-quality risk 3/10 · Minor
- Unhealthy air days now
- 3 days/yr
- Unhealthy air days in 30 yrs
- 3 days/yr
Risk factors via First Street. Map © Google.
Why this score? — see what drove the D grade
The composite is a weighted blend of 9 inputs, each scored 0–100. Each bar is that input's sub-score; the figure is the points it added to the 100-point composite (weight × sub-score).
- ARV discount +12.0/15.0
- Cash flow +11.0/30.0
- Schools +4.5/10.0
- Livability +3.6/5.0
- DSCR +3.2/10.0
- 1% rule +2.8/10.0
- Rent growth +2.8/5.0
- Condition / age +2.5/5.0
- Appreciation +0.0/10.0
$207,000
🖨 Deal sheet (PDF) 📄 Offer letter ✓ Due diligence
Listing remarks MLS
**100% FINANCING AVAILABLE ON THIS HOME FOR QUALIFIED BUYERS** A beautifully renovated 3-bedroom, 1-bathroom ranch home. This home features stylish updates including stainless steel kitchen appliances, granite countertops, and updated flooring throughout. Conveniently located near shopping, dining, and more! Do not miss this opportunity! Contact SouthState Bank (Amy Buynoski NMLS#545254) at [email protected] for more information on 100% financing options. Advertised product assumes the purchase of a single-family primary residence, 600 minimum FICO, down payment of 0%, and loan amount up to the conforming loan amount limit. Buyer is free to shop financing offers from any lender to choose the best services and best rate.
Key facts
- Large level lot
- Updated flooring
- Granite countertops
Tags
Neighborhood map
What this means for you Summary
Snapshot
- This is a 3-bed/1.0-bath single-family listed at $207k.
Deal economics
- At list price, monthly cash flow is $-89 ($-1k/yr) — negative.
- To cash-flow at today's rent, offer at most $191k (7.6% below list).
- To meet the 1% rule (rent ≥ 1% of price), the offer needs to be $160k (22.5% below list).
- Recommended offer: $160k (22.5% below list) — sets the bar for 1% rule.
Location & tenants
- Location reads 72/100 on livability (#72 in GA) — a middle-class / working-renter tenant base. Strengths: commute A+, cost of living A+, housing A+; Watch: employment D+, crime F, amenities F.
- Fulton County (suburban): math 49% / reading 53% proficiency, ranked #12 of 174 in GA (top 7%) — acceptable for families but not a draw, mixed tenant base, ~2y average lease.
- Zoned schools: Amana Academy School (math 47% / reading 52%, grade D, #264 of 1,228 statewide, top 23%, 731 students, 30% FRL, charter); Paul D. West Middle School (math 17% / reading 17%, grade F, #381 of 470 statewide, top 82%, 803 students, 100% FRL); Tri-Cities High School (math 5% / reading 30%, grade F, #264 of 424 statewide, top 63%, 1,483 students, 100% FRL) — zoned schools average 77% FRL vs 41% district-wide (35 pts higher); higher-poverty schools than district average — tighter screening recommended.
- Zoned-school proficiency averages 28% at this address vs 51% district-wide (-23 pts) — the specific schools serving this property underperform the Fulton County average; the district grade overstates school quality for this exact location.
- Market conditions: Rents rising (+1.4%/yr); 295 active listings in the ZIP; 40 comparable units currently listed for rent nearby; rentals at typical pace (median 23d on market — plan ~3-4 weeks tenant-placement turnaround); 11,565 units permitted in Fulton County in 2024 (8,159 in 5+ unit buildings).
Forward outlook
- Local home prices are declining (-3.0%/yr); year-one equity from $1k of loan paydown is wiped out by about $6k of value loss. Plan a longer hold.
- Fulton County population projected at +38% by 2050 — long-run rental-demand tailwind backs the buy-and-hold thesis.
Negotiation context
- It's been on market 396 days — a 12% lower offer ($182k) is reasonable based on typical stale-listing flexibility.
- 2 sale attempts since 3y ago; this cycle's ask has dropped $13k (6%) from the opening price — seller is motivated, your offer sets the floor, not the list.
- Current owner paid $93k; list at $207k implies a 123% gain — meaningful room to come down on a strong offer.
Risks & watch-outs
- Watch-outs: built in 1954 — expect roof / HVAC / electrical / plumbing capex.
- Climate carrying-cost: moderate wind risk, 25% chance of damaging wind over 30y; extreme-heat days projected 7→17/yr by 2055 (HVAC capex compounding) — expect insurance premiums to compound above CPI over the hold.
Questions for the listing agent
- What do current leases actually rent for vs. the listed asking? Can we see a recent rent roll and the last 12 months of T-12 income?
- It's been on market 396 days. Have you received any prior offers? Is the seller open to a 22% concession, seller financing, or rate buy-down credit?
- Built in 1954 — when were the roof, HVAC, electrical panel, plumbing, and water heater last replaced?
- Why hasn't it sold? Are there any deal-killer items the seller is aware of (foundation, flood, title, zoning, code violations)?
- Is there a deadline driving the sale (1031 exchange, divorce, estate, relocation)? That informs how much negotiation room exists.
- Schools are F-rated, which usually means shorter tenancies and higher turnover. Who's the typical renter profile here, and what's been the actual vacancy rate?
- Crime grade is F in this area — have there been break-ins, vandalism, or insurance claims at this property in the last 3 years? What carrier currently insures it and at what premium?
- The area grade is low — what's the realistic commute time and amenity access for the typical tenant pool here? Any planned neighborhood developments (good or bad) we should know about?
- What's the average days-on-market for RENTAL listings here right now (not sales)? A rising rental-DOM trend means longer vacancies and softer asking-rent achievability than the comps imply.
- What's the recent tenant-quality profile in this submarket — average credit score on applications, eviction rate, late-payment / NSF rate, and stable-employment percentage? A property-management company in the area should have these aggregated.
- How much new for-sale + rental construction is in the pipeline within 1–3 miles? Heavy new supply typically softens prices + rents 12–24 months out; constrained supply supports both.
Investment metrics
- 1% rule
- 0.78% ✗
- Cap rate
- 5.78%
- Cash-on-cash
- -1.84%
- DSCR
- 0.92
- GRM
- 10.8
CMA / ARV
- ARV (median comp)
- $229,731
- List price
- $207,000
- Delta
- -9.89%
- Verdict
- FAIR
- Comps
- 20 within 1.0 mi
Show comp detail 10 sales within ~0.75 mi
| Address | Dist | Beds/Ba | Sqft | Sold | Price | $/sf | Match |
|---|---|---|---|---|---|---|---|
| 2168 Penrose Dr | 0.49mi | 3/1.0 | 1,025 (+0%) | 18mo | $90,000 | $88 | 62 |
| 2126 Ivydale St | 0.63mi | 3/1.0 | 1,100 (+7%) | 1mo | $163,000 | $148 | 58 |
| 2120 Penrose Dr | 0.57mi | 2/1.0 (-1) | 1,069 (+4%) | 5mo | $115,000 | $108 | 57 |
| 2479 Wood Valley Dr | 0.29mi | 2/1.0 (-1) | 1,141 (+11%) | 16mo | $188,500 | $165 | 50 |
| 2435 Hillcrest Dr | 0.50mi | 2/1.0 (-1) | 924 (-10%) | 8mo | $265,000 | $287 | 49 |
| 2261 Headland Ter | 0.41mi | 3/2.0 | 1,146 (+12%) | 13mo | $190,000 | $166 | 47 |
| 1891 Connally Dr | 0.58mi | 2/1.0 (-1) | 896 (-12%) | 2mo | $130,000 | $145 | 46 |
| 2016 Montrose Dr | 0.71mi | 2/1.0 (-1) | 1,059 (+3%) | 16mo | $225,000 | $212 | 43 |
| 2461 Old Colony Rd | 0.58mi | 3/2.5 | 1,139 (+11%) | 7mo | $250,000 | $219 | 42 |
| 2053 Wells Dr SW | 0.73mi | 3/1.0 | 1,100 (+7%) | 15mo | $202,000 | $184 | 41 |
Match score weights: distance 35% · size 25% · config 20% · recency 20%. Top-matched comps best support the ARV.
Projected returns pro-forma
-3.0% appreciation · 1.35% rent growth · sell at horizon
- IRR
- -21.1%
- Equity multiple
- 0.28×
- Total profit
- $-41,851
- Equity at exit
- $30,864
- IRR
- -18.7%
- Equity multiple
- 0.06×
- Total profit
- $-54,227
- Equity at exit
- $17,898
Cash invested: $57,960 (down + closing). Projections, not guarantees.
Landlord ↔ Tenant lean methodology
- Overall (STATE)
- 90 Strongly Landlord-Friendly
- State Georgia
- 90 Strongly Landlord-Friendly · R+3
- County
- — inherits STATE
- City
- — inherits STATE
ZIP-level market 30344
- Home prices YoY
- -31.0%
- Rents YoY
- 1.4%
- Active inventory
- 295
- Price-to-rent
- 10.8×
Monthly cashflow live
- Estimated rent
- $1,604 high interval (Pro) →
- Mortgage (P&I)
- −$1,086
- Tax from tax record
- −$185 /mo · $2,215/yr
- Insurance
- −$86
- HOA
- −$0
- Vacancy / Maint / Mgmt
- −$337
- Net cashflow
- $-89
Break-even live
Sensitivity live
| Price | -10% $28 | -5% $-30 | +0% $-89 | +5% $-148 | +10% $-206 |
|---|---|---|---|---|---|
| Rent | -10% $-216 | -5% $-152 | +0% $-89 | +5% $-26 | +10% $38 |
| Rate | -1.0pp $15 | -0.5pp $-36 | base $-89 | +0.5pp $-143 | +1.0pp $-197 |
UW: 25.0% down · 7.5% · 30yr · 1.5% tax · 5.0% vac · 8.0% maint · 8.0% mgmt
Financing live
Cash to close
- Down payment
- $51,750
- Closing costs
- $6,210
- Reserves months
- —
- Total cash needed
- —
Loan-product check · same deal, 3 products live
Conventional
25% down · 7.5% · 30yr
- Down + closing
- —
- Monthly P&I
- —
- Monthly cashflow
- —
- DSCR
- —
- Eligible?
- —
Personal DTI + credit; lowest rate.
DSCR
20% down · 8.5% · 30yr
- Down + closing
- —
- Monthly P&I
- —
- Monthly cashflow
- —
- DSCR
- —
- Eligible?
- —
No personal income docs; deal must DSCR.
Hard money
10% down · 12.0% · 12mo
- Down + closing
- —
- Monthly P&I
- —
- Monthly cashflow
- —
- DSCR
- —
- Eligible?
- —
Short-term bridge; refi at stabilization.
Rent comps 40 comps
| Address | Beds | Baths | Sqft | Rent | $/sqft | DOM | Units | Dist |
|---|---|---|---|---|---|---|---|---|
| 2284 Headland Dr Atlanta, GA | 3.0 | 3.5 | 1117 | $1,502 | $1.34 | 14d | 1 | 0.20mi |
| 2206 Delowe Dr Unit 2206D East Point, GA | 2.0 | 1.0 | 860 | $1,300 | $1.51 | 26d | 1 | 0.31mi |
| 2186 Delowe Dr Unit 2186J East Point, GA | 2.0 | 1.0 | 860 | $1,050 | $1.22 | 23d | 1 | 0.34mi |
| 2560 Wood Valley Dr Atlanta, GA | 4.0 | 2.5 | 1141 | $1,900 | $1.67 | 19d | 1 | 0.41mi |
| 2560 Wood Valley Dr Atlanta, GA | 4.0 | 2.5 | 1141 | $1,900 | $1.67 | 26d | 1 | 0.41mi |
| 2140 Delowe Dr Unit 2140A East Point, GA | 2.0 | 1.0 | 860 | $1,300 | $1.51 | 26d | 1 | 0.42mi |
| 2124 Delowe Dr Unit 2124J East Point, GA | 3.0 | 1.0 | 920 | $1,500 | $1.63 | 26d | 1 | 0.45mi |
| 2514 Riggs Dr Atlanta, GA | 4.0 | 2.0 | 1274 | $2,000 | $1.57 | 45d | 1 | 0.45mi |
| 2450 Hillcrest Dr Atlanta, GA | 2.0 | 1.5 | 918 | $2,400 | $2.61 | 18d | 1 | 0.53mi |
| 1902 Connally Dr Atlanta, GA | 2.0 | 1.5 | 993 | $2,450 | $2.47 | 45d | 1 | 0.53mi |
| 1903 Chattahoochee Pl Atlanta, GA | 3.0 | 2.0 | 1333 | $1,850 | $1.39 | 14d | 1 | 0.53mi |
| 1870 Grove Ave Atlanta, GA | 3.0 | 1.0 | 1433 | $1,600 | $1.12 | 0d | 1 | 0.61mi |
| 2467 Calvin Ave Atlanta, GA | 3.0 | 2.0 | 1200 | $1,950 | $1.62 | 26d | 1 | 0.61mi |
| 2610 Harmony Way Atlanta, GA | 3.0 | 1.0 | 1100 | $1,095 | $1.00 | 26d | 1 | 0.69mi |
| 2656 Westchester Dr Atlanta, GA | 3.0 | 1.0 | 1025 | $1,600 | $1.56 | 21d | 1 | 0.69mi |
| 2039 Bent Creek Way SW Atlanta, GA | 1.0–2.0 | 1.0 | 898 | $1,200 | $1.34 | 9d | 1 | 0.69mi |
| 2060 Alison Ct SW Atlanta, GA | 2.0 | 1.0 | 850 | $995 | $1.17 | 23d | 1 | 0.69mi |
| 1994 Bent Creek Way SW Atlanta, GA | 1.0–3.0 | 1.0–2.0 | 1041 | $1,455 | $1.40 | 9d | 1 | 0.71mi |
| 2065 Alison Ct SW Unit 7 Atlanta, GA | 2.0 | 1.5 | 760 | $995 | $1.31 | 4d | 1 | 0.72mi |
| 2065 Alison Ct SW Unit 7 Atlanta, GA | 2.0 | 1.5 | 760 | $995 | $1.31 | 0d | 1 | 0.72mi |
| 2055 Alison Ct SW Unit 3 Atlanta, GA | 2.0 | 1.5 | 760 | $995 | $1.31 | 4d | 1 | 0.73mi |
| 2055 Alison Ct SW Unit 3 Atlanta, GA | 2.0 | 1.5 | 760 | $995 | $1.31 | 0d | 1 | 0.73mi |
| 2045 Alison Ct SW Apt 3 Atlanta, GA | 2.0 | 1.5 | 760 | $995 | $1.31 | 0d | 1 | 0.75mi |
| 2045 Alison Ct SW Unit 4 Atlanta, GA | 2.0 | 1.5 | 760 | $995 | $1.31 | 4d | 1 | 0.75mi |
| 2481 Semmes St Atlanta, GA | 3.0 | 1.0 | 1500 | $1,850 | $1.23 | 45d | 1 | 0.75mi |
| 2756 Plantation Dr Atlanta, GA | 3.0 | 2.0 | 1119 | $1,950 | $1.74 | 22d | 1 | 0.77mi |
| 1932 Montrose Dr Atlanta, GA | 3.0 | 1.0 | 1200 | $1,750 | $1.46 | 20d | 1 | 0.78mi |
| 1914 Montrose Dr Atlanta, GA | 2.0 | 1.0 | 1216 | $2,000 | $1.64 | 45d | 1 | 0.81mi |
| 2764 Riggs Dr Atlanta, GA | 3.0 | 2.0 | 1147 | $2,050 | $1.79 | 45d | 1 | 0.84mi |
| 2400 Campbellton Rd SW Atlanta, GA | 1.0–3.0 | 1.0–2.5 | 1350 | $1,450 | $1.07 | 9d | 2 | 0.85mi |
| 2400 Campbellton Rd SW Atlanta, GA | 2.0 | 2.0 | 1125 | $1,250 | $1.11 | 26d | 1 | 0.85mi |
| 2400 Campbellton Rd SW Atlanta, GA | 2.0–3.0 | 1.5–2.5 | 1237 | $1,450 | $1.17 | 18d | 3 | 0.85mi |
| 2328 Campbellton Rd SW Atlanta, GA | 1.0–3.0 | 1.0–2.0 | 1014 | $1,400 | $1.38 | 26d | 9 | 0.88mi |
| 2641 Connally Dr East Point, GA | 2.0 | 1.0 | 1000 | $1,500 | $1.50 | 45d | 1 | 0.91mi |
| 2637 Lester St Atlanta, GA | 2.0 | 1.0 | 750 | $1,300 | $1.73 | 21d | 1 | 0.91mi |
| 2730 Pearl St Unit 1 East Point, GA | 2.0 | 1.0 | 910 | $1,175 | $1.29 | 45d | 1 | 0.92mi |
| 2040 Stanton Rd Atlanta, GA | 2.0 | 1.0 | 759 | $1,295 | $1.71 | 17d | 13 | 0.94mi |
| 2523 Ben Hill Rd Atlanta, GA | 3.0 | 1.5 | 1412 | $3,000 | $2.12 | 23d | 1 | 0.94mi |
| 2675 Headland Dr Atlanta, GA | 3.0 | 2.0 | 1408 | $1,600 | $1.14 | 19d | 1 | 0.94mi |
| 1870 Myrtle Dr SW Atlanta, GA | 1.0–3.0 | 1.0–2.0 | 900 | $1,375 | $1.53 | 23d | 26 | 0.95mi |
Listing history 21 events
-
2026-06-21days on market $207,000 Active 396 DOM
-
2026-06-18days on market $207,000 Active 393 DOM
-
2026-06-17days on market $207,000 Active 392 DOM
-
2026-06-16days on market $207,000 Active 391 DOM
-
2026-06-15days on market $207,000 Active 390 DOM
-
2026-06-13days on market $207,000 Active 388 DOM
-
2026-06-09days on market $207,000 Active 384 DOM
-
2026-06-08days on market $207,000 Active 383 DOM
-
2026-06-08days on market $207,000 Active 382 DOM
-
2026-06-04days on market $207,000 Active 379 DOM
-
2026-06-03days on market $207,000 Active 378 DOM
-
2026-06-01days on market $207,000 Active 376 DOM
-
2026-05-31days on market $207,000 Active 375 DOM
-
2026-04-10price $207,000 745-char remark
Show marketing remark (745 chars)
**100% FINANCING AVAILABLE ON THIS HOME FOR QUALIFIED BUYERS** A beautifully renovated 3-bedroom, 1-bathroom ranch home. This home features stylish updates including stainless steel kitchen appliances, granite countertops, and updated flooring throughout. Conveniently located near shopping, dining, and more! Do not miss this opportunity! Contact SouthState Bank (Amy Buynoski NMLS#545254) at [email protected] for more information on 100% financing options. Advertised product assumes the purchase of a single-family primary residence, 600 minimum FICO, down payment of 0%, and loan amount up to the conforming loan amount limit. Buyer is free to shop financing offers from any lender to choose the best services and best rate.
-
2025-05-21$220,000 New 745-char remark
Show marketing remark (745 chars)
**100% FINANCING AVAILABLE ON THIS HOME FOR QUALIFIED BUYERS** A beautifully renovated 3-bedroom, 1-bathroom ranch home. This home features stylish updates including stainless steel kitchen appliances, granite countertops, and updated flooring throughout. Conveniently located near shopping, dining, and more! Do not miss this opportunity! Contact SouthState Bank (Amy Buynoski NMLS#545254) at [email protected] for more information on 100% financing options. Advertised product assumes the purchase of a single-family primary residence, 600 minimum FICO, down payment of 0%, and loan amount up to the conforming loan amount limit. Buyer is free to shop financing offers from any lender to choose the best services and best rate.
-
2024-01-02historical $1,450
-
2023-12-16$1,450
-
2019-12-27soldstatus $92,700
-
2019-12-27soldstatus $105,000
-
1997-12-22soldstatus $74,500
-
1985-04-15soldstatus $44,500
ⓘ Source: listings_history table (triggers on properties + properties_extension) + one-shot
backfill from property_details.listing_events for pre-trigger history.
Tax reassessment forecast GA · Resets to sale price
- Current annual tax
- $2,215 · $185/mo
- Projected year-2 tax
- $2,215 · $185/mo
- Expected delta
- $0/yr ($0/mo · 0.0%)
ⓘ Screening estimate from a state-policy table — verify with the county assessor before closing.
Climate risk First Street
- Flood 1/10 Low FEMA zone X (unshaded) · 0% chance over 30 yrs
- Wildfire 1/10 Low
- Heat 5/10 Major 7 d/yr ≥103°F today · 17 d/yr by 30 yrs out
- Wind 5/10 Major 25% chance of damaging wind over 30 yrs
- Air quality 3/10 Moderate 3 unhealthy d/yr today · 3 by 30 yrs out
Nearby sold comps map
Loading sold comps map…
Walkable amenities ~0.75 mi
Loading nearby amenities…
Taxation est. · year 1
- Rental income
- $19,252
- − Mortgage interest
- −$11,595
- − Property taxes
- −$2,215
- − Insurance
- −$1,035
- − Repairs & maintenance
- −$1,540
- − Management
- −$1,540
- − Depreciation
- −$6,022
- Taxable loss
- −$4,696
- Est. tax savings @ 24.0%
- +$1,127
- After-tax cash flow
- $59/yr
For passive investors: Depreciation is non-cash, so a rental often shows a tax loss while cash-flowing — sheltering income. Rental losses are passive: they offset passive income freely, and up to $25,000/yr can offset ordinary (W-2) income if you actively participate and your MAGI is under $100k (phasing out to $0 by $150k); unused losses carry forward. On sale, claimed depreciation is recaptured at up to 25%, and gains may owe capital-gains tax (a 1031 exchange can defer both). Figures are a year-1 estimate at your 24.0% rate — not tax advice; consult a CPA.
Schools (NCES district)
- District
- Fulton County
- NCES district ID
- 1302280
- Math proficiency
- 49% ▼ -2.00%
- Reading proficiency
- 53% ▬ 0.00%
- Median HH income
- $68,035
- Composite
- 45.33/100
- National rank
- #2640
- State rank
- #12 of 174 in GA
Livability — East Point
- Score
- 72/100
- State rank
- #72
- US rank
- #6314
Category grades
Schools grade is shown separately in the Schools card above.
Census & demographics
- Census place
- East Point, GA
- County
- Fulton County · 1,094,430 people
- City population
- 35,456
- Metro
- Atlanta-Sandy Springs-Alpharetta, GA
- Population (ZIP)
- 35,456
- Household income
- $68,380
- Rent vs Own
- Severe rent burden
- 2226.0
Population outlook (Fulton County) Hauer SSP2
- Today (2025)
- 1,203,707 people
- By 2030
- 1,299,706 · +8.0%
- By 2040
- 1,488,256 · +23.6%
- By 2050
- 1,664,580 · +38.3%
- By 2075
- 2,036,072 · +69.2%
- By 2100
- 2,222,402 · +84.6%
Race, ethnicity, and origin ACS 2023
- Neighborhood character
- Predominantly Black (74%)
- Race & ethnicity
- Black 74% White 11% Hispanic / Latino 11% Two or more races 6%
- Hispanic origin (detail)
- Mexican 7% Puerto Rican 1%
- Common ancestry
- Italian 1% Swiss 1% Russian 1%
- Foreign-born
- 6% · Canada, Jamaica
- Languages at home
- 87% English-only · Spanish 9% Other Indo-European 1% German/W. Germanic 1%
Political lean MEDSL · Fulton
- 2024 margin
- Solid D (+44.9) · D 71.9% · R 27.0% · Other 1.1%
- 2008→2024 swing
- +9.8pp toward D · 2008: 35.0pp · 2024: 44.9pp
- All cycles
- 2024: D+44.9 2020: D+46.4 2016: D+42.1 2012: D+29.6 2008: D+35.0
Not yet ingested
- Civics
- —
Market trends
- HPI YoY
- ▼ -113.15%
- Current HPI
- 251.7916
- Rent YoY
- ▲ 1.35%
- Metro
- Atlanta-Sandy Springs-Alpharetta, GA
- State GDP YoY
- ▲ 2.66%
- F500 in state
- 28
Industry mix (Fortune 500 HQ in GA)
| Industry | F500 HQs | Revenue |
|---|---|---|
| Paper / Packaging | 2 | $29B |
|
||
| Retail | 1 | $160B |
|
||
| Transportation / Logistics | 1 | $91B |
|
||
| Airlines | 1 | $62B |
|
||
| Consumer Goods | 1 | $47B |
|
||
| Utilities | 1 | $25B |
|
||
Price history
+365.2% since first listed8 events — show timeline
- 2026-04-10 Price Changed $207,000 GAMLS
- 2025-05-21 Listed $220,000 GAMLS
- 2024-01-02 Rental Removed $1,450 FMLS
- 2023-12-16 Listed for Rent $1,450 FMLS
- 2019-12-27 Sold (Public Records) $105,000 Public Records
- 2019-12-27 Sold (Public Records) $92,700 Public Records
- 1997-12-22 Sold (Public Records) $74,500 Public Records
- 1985-04-15 Sold (Public Records) $44,500 Public Records
Property tax history
+4.1%/yrLatest (2025): $2,215 · -0.0% YoY. Source: county tax records.
Cash-flow waterfall
monthlySold comps — $/sqft
last 12 mo · ≤1 miLoading sold comps…