 🏷️ Likely Rental
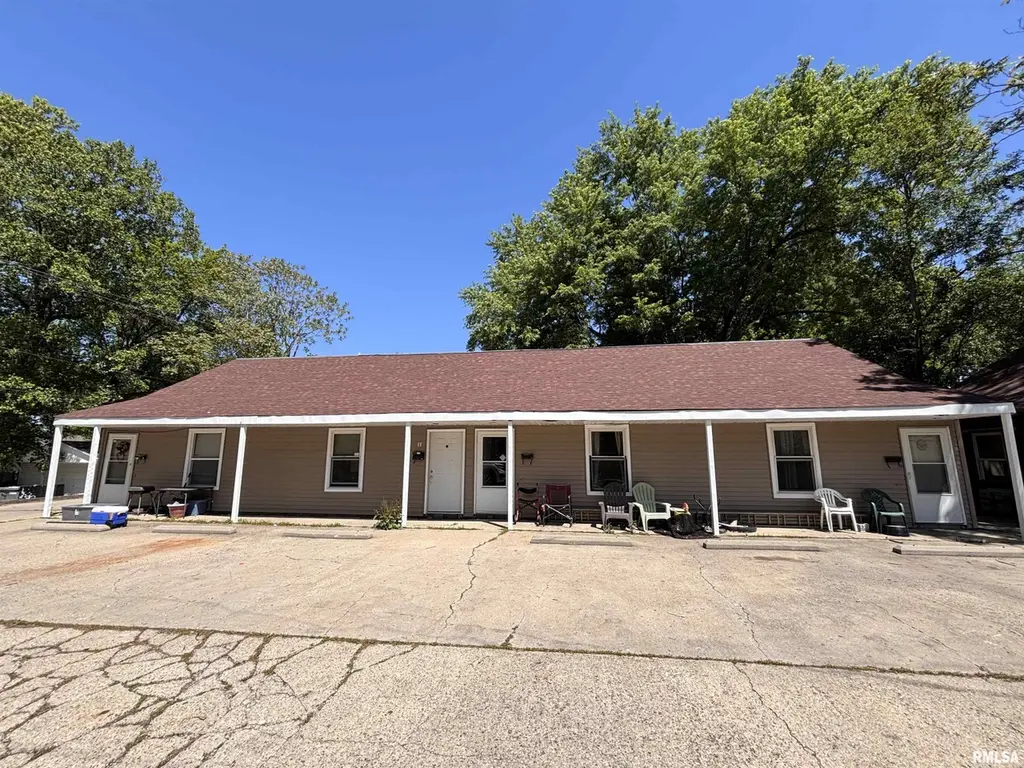
524 E Ridgely Ave Unit G, H, I, J, K & L · Springfield, IL
Flood risk No data
- FEMA flood zone
- —
- Chance of flooding over 30 yrs
- —
- Est. flood insurance / yr
- —
Fire risk No data
- Est. fire insurance / yr
- —
Heat risk No data
- Hot days now (above threshold)
- —
- Hot days in 30 yrs
- —
Wind risk No data
- Chance of severe wind over 30 yrs
- —
Air-quality risk No data
- Unhealthy air days now
- —
- Unhealthy air days in 30 yrs
- —
Risk factors via First Street. Map © Google.
Why this score? — see what drove the C- grade
The composite is a weighted blend of 9 inputs, each scored 0–100. Each bar is that input's sub-score; the figure is the points it added to the 100-point composite (weight × sub-score).
- Cash flow +17.8/30.0
- ARV discount +15.0/15.0
- DSCR +5.6/10.0
- 1% rule +4.8/10.0
- Livability +4.0/5.0
- Rent growth +3.7/5.0
- Condition / age +2.2/5.0
- Schools +1.7/10.0
- Appreciation +0.0/10.0
$250,000
🖨 Deal sheet 📄 Offer letter ✓ Due diligence
Multi-family units
County records classify this as Multi-Family (5+ Unit). Listing-text estimate: 2 units. estimate disagrees with records
5+ unit building — per-unit beds/baths from public records are typically unavailable; the breakdown below (if shown) is an estimate from the listing text.
Listing remarks MLS
Great opportunity to own a 6 units just a couple blocks away from Lincoln Park. One building is a 4-plex and the other is a duplex. All fully occupied with a total gross monthly income of $3,850. New roof layover just installed in August 2024. New siding on the 4-plex. Tenant pays for all utilities. Owner pays for garbage expense.
Key facts
- New siding
- New roof layover
- 6 parking spots
Tags
Neighborhood map
What this means for you Summary
Snapshot
- This is a 2 × 2-bed/?-bath units multifamily listed at $250k. Condition is rated fair.
Deal economics
- At list price, monthly cash flow is $206 ($2k/yr) — positive. Per door: $103/mo.
- The deal already cash-flows at list — no discount required.
- To meet the 1% rule (rent ≥ 1% of price), the offer needs to be $245k (2.1% below list).
- Recommended offer: $242k (3.0% below list) — sets the bar for market timing.
- Cap rate 7.3% vs local median 4.9% in Springfield — top-decile yield for the area; either an underpriced asset or a hidden risk that comps aren't pricing in. Stress-test before assuming the spread holds.
Location & tenants
- Location reads 79/100 on livability (#122 in IL, #2,138 nationally) — a middle-class / working-renter tenant base. Strengths: amenities A+, commute A+, cost of living A+; Watch: schools D+, crime F.
- Springfield SD 186 (urban): math 17% / reading 22% proficiency, ranked #438 of 620 in IL (top 71%) — low school quality limits family demand, transient renter base, plan for 1-2y turnover; 64% free/reduced lunch — lower-income household profile, screen leases tightly.
- Market conditions: Rents rising fast (+5.0%/yr); 131 active listings in the ZIP; 225 units permitted in Sangamon County in 2024 (48 in 5+ unit buildings).
- At $2,448/mo this rent would consume 57% of the median local household income ($51k/yr) (locally 1230% of renters already pay >50% of income on rent) — very limited rent-growth headroom before tenants either downsize or default.
Forward outlook
- Local home prices are declining (-3.0%/yr); year-one equity from $2k of loan paydown is wiped out by about $8k of value loss. Plan a longer hold.
- Sangamon County population projected to shrink 9% by 2050 — rents likely to lag national; underwrite the cash flow, not the appreciation.
Negotiation context
- It's been on market 39 days — a 3% lower offer ($242k) is reasonable based on typical stale-listing flexibility.
Questions for the listing agent
- It's been on market 39 days. Have you received any prior offers? Is the seller open to a 3% concession, seller financing, or rate buy-down credit?
- Can we see the unit-by-unit rent roll, current vacancy, and any below-market leases? What's the average tenancy length?
- What capital expenditures (roof, boiler, parking lot, exteriors) have been made in the last 5 years, and what's planned in the next 2?
- Have any recent inspections been done? Can we get a copy of the seller's disclosures and any deferred-maintenance estimates?
- Is there a deadline driving the sale (1031 exchange, divorce, estate, relocation)? That informs how much negotiation room exists.
- Schools are D-rated, which usually means shorter tenancies and higher turnover. Who's the typical renter profile here, and what's been the actual vacancy rate?
- Crime grade is F in this area — have there been break-ins, vandalism, or insurance claims at this property in the last 3 years? What carrier currently insures it and at what premium?
- What's the average days-on-market for RENTAL listings here right now (not sales)? A rising rental-DOM trend means longer vacancies and softer asking-rent achievability than the comps imply.
- What's the recent tenant-quality profile in this submarket — average credit score on applications, eviction rate, late-payment / NSF rate, and stable-employment percentage? A property-management company in the area should have these aggregated.
- How much new apartment / multifamily construction is in the pipeline within 1–3 miles? Heavy new supply (>2% of stock underway) typically softens rents 12–24 months out; light construction supports rent growth.
Investment metrics
- 1% rule
- 0.98% ✗
- Cap rate
- 7.28%
- Cash-on-cash
- 3.54%
- DSCR
- 1.16
- GRM
- 8.5
CMA / ARV
- ARV (median comp)
- $406,681
- List price
- $250,000
- Delta
- -38.53%
- Verdict
- UNDERPRICED
- Comps
- 4 within 2.0 mi
Projected returns pro-forma
-3.0% appreciation · 4.95% rent growth · sell at horizon
- IRR
- -8.6%
- Equity multiple
- 0.68×
- Total profit
- $-22,443
- Equity at exit
- $37,276
- IRR
- 3.3%
- Equity multiple
- 1.26×
- Total profit
- $18,429
- Equity at exit
- $21,615
Cash invested: $70,000 (down + closing). Projections, not guarantees.
Landlord ↔ Tenant lean methodology
- Overall (STATE)
- 43 Moderately Tenant-Leaning
- State Illinois
- 43 Moderately Tenant-Leaning · D+7
- County
- — inherits STATE
- City
- — inherits STATE
ZIP-level market 62702
- Home prices YoY
- -34.9%
- Rents YoY
- 5.0%
- Active inventory
- 131
- Price-to-rent
- 17.0×
Monthly cashflow live
- Estimated rent
- $2,448 medium interval (Pro) →
- Mortgage (P&I)
- −$1,311
- Tax est. 1.5%
- −$312 /mo · $3,750/yr
- Insurance
- −$104
- HOA
- −$0
- Vacancy / Maint / Mgmt
- −$514
- Net cashflow
- $206
Break-even live
2-unit breakdown (identical units grouped — click to expand)
| Units | Beds | Baths | Est. rent |
|---|---|---|---|
| 2× units | 2 | — | $2,448 |
| #1 | 2 | — | $1,224 |
| #2 | 2 | — | $1,224 |
| Total (2 units) | $2,448 | ||
UW: 25.0% down · 7.5% · 30yr · 1.5% tax · 5.0% vac · 8.0% maint · 8.0% mgmt
Financing live
Cash to close
- Down payment
- $62,500
- Closing costs
- $7,500
- Reserves months
- —
- Total cash needed
- —
Loan-product check · same deal, 3 products live
Conventional
25% down · 7.5% · 30yr
- Down + closing
- —
- Monthly P&I
- —
- Monthly cashflow
- —
- DSCR
- —
- Eligible?
- —
Personal DTI + credit; lowest rate.
DSCR
20% down · 8.5% · 30yr
- Down + closing
- —
- Monthly P&I
- —
- Monthly cashflow
- —
- DSCR
- —
- Eligible?
- —
No personal income docs; deal must DSCR.
Hard money
10% down · 12.0% · 12mo
- Down + closing
- —
- Monthly P&I
- —
- Monthly cashflow
- —
- DSCR
- —
- Eligible?
- —
Short-term bridge; refi at stabilization.
Listing history 18 events
-
2026-06-19days on market $250,000 Active 39 DOM
-
2026-06-18days on market $250,000 Active 38 DOM
-
2026-06-17days on market $250,000 Active 37 DOM
-
2026-06-16days on market $250,000 Active 36 DOM
-
2026-06-15days on market $250,000 Active 35 DOM
-
2026-06-14days on market $250,000 Active 33 DOM
-
2026-06-13days on market $250,000 Active 32 DOM
-
2026-06-10days on market $250,000 Active 30 DOM
-
2026-06-09days on market $250,000 Active 29 DOM
-
2026-06-08days on market $250,000 Active 28 DOM
-
2026-06-07days on market $250,000 Active 27 DOM
-
2026-06-05days on market $250,000 Active 24 DOM
-
2026-06-03days on market $250,000 Active 23 DOM
-
2026-06-02days on market $250,000 Active 22 DOM
-
2026-06-01days on market $250,000 Active 21 DOM
-
2026-05-31days on market $250,000 Active 20 DOM
-
2026-05-30days on market $250,000 Active 19 DOM
-
2026-05-11$250,000 Active 334-char remark
Show marketing remark (334 chars)
Great opportunity to own a 6 units just a couple blocks away from Lincoln Park. One building is a 4-plex and the other is a duplex. All fully occupied with a total gross monthly income of $3,850. New roof layover just installed in August 2024. New siding on the 4-plex. Tenant pays for all utilities. Owner pays for garbage expense.
ⓘ Source: listings_history table (triggers on properties + properties_extension) + one-shot
backfill from property_details.listing_events for pre-trigger history.
Nearby sold comps map
Loading sold comps map…
Walkable amenities ~0.75 mi
Loading nearby amenities…
Taxation est. · year 1
- Rental income
- $29,376
- − Mortgage interest
- −$14,004
- − Property taxes
- −$3,750
- − Insurance
- −$1,250
- − Repairs & maintenance
- −$2,350
- − Management
- −$2,350
- − Depreciation
- −$7,273
- Taxable loss
- −$1,601
- Est. tax savings @ 24.0%
- +$384
- After-tax cash flow
- $2,859/yr
For passive investors: Depreciation is non-cash, so a rental often shows a tax loss while cash-flowing — sheltering income. Rental losses are passive: they offset passive income freely, and up to $25,000/yr can offset ordinary (W-2) income if you actively participate and your MAGI is under $100k (phasing out to $0 by $150k); unused losses carry forward. On sale, claimed depreciation is recaptured at up to 25%, and gains may owe capital-gains tax (a 1031 exchange can defer both). Figures are a year-1 estimate at your 24.0% rate — not tax advice; consult a CPA.
Condition & rehab AI · 3 photos
This multi-family property requires moderate renovations to improve its curb appeal and overall condition. Repairs to the driveway, exterior walls, and landscaping are necessary to increase its resale and rental value.
Repairs flagged
- Major Driveway — Cracked and uneven concrete needs repair.
- Moderate Exterior walls — Signs of wear and tear on the siding and exterior walls.
- Major Interior walls/paint — No visible photos, but given the exterior condition, it's likely the interior needs updating.
- Moderate Systems — No visible photos, but given the exterior condition, it's likely the systems need updating.
- Major Landscaping — Overgrown and unkempt, needs trimming and landscaping improvements.
Value-add opportunities
- Both Paint exterior walls — Fresh paint can improve the curb appeal and make the property look more inviting.
- Both Repair driveway — A repaired driveway will improve the property's appearance and make it more attractive to potential buyers or renters.
- Both Landscaping — A well-maintained landscape can significantly enhance the property's curb appeal and attract more interest from potential buyers or renters.
Renovation cost estimate screening
| Repair item | Severity | Est. cost |
|---|---|---|
| Driveway · Cracked and uneven concrete needs repair. | Major | $15,000–50,000 |
| Exterior walls · Signs of wear and tear on the siding and exterior walls. | Moderate | $3,000–15,000 |
| Interior walls/paint · No visible photos, but given the exterior condition, it's likely the interior needs updating. | Major | $15,000–50,000 |
| Systems · No visible photos, but given the exterior condition, it's likely the systems need updating. | Moderate | $3,000–15,000 |
| Landscaping · Overgrown and unkempt, needs trimming and landscaping improvements. | Major | $15,000–50,000 |
| Total estimated repair cost · 5 items | $51,000–180,000 |
Value-add ROI direction
- Both Paint exterior walls — Fresh paint can improve the curb appeal and make the property look more inviting. ↑
- Both Repair driveway — A repaired driveway will improve the property's appearance and make it more attractive to potential buyers or renters. ↑
- Both Landscaping — A well-maintained landscape can significantly enhance the property's curb appeal and attract more interest from potential buyers or renters. ↑
ⓘ Cost ranges are severity-bucket heuristics (US national rule-of-thumb). Get contractor quotes + a written scope before underwriting a rehab budget.
Schools (NCES district)
- District
- Springfield SD 186
- NCES district ID
- 1737080
- Math proficiency
- 17% ▼ -7.00%
- Reading proficiency
- 22% ▼ -5.00%
- Median HH income
- $43,744
- Composite
- 16.89/100
- National rank
- #9142
- State rank
- #438 of 620 in IL
Livability — Springfield
- Score
- 79/100
- State rank
- #122
- US rank
- #2138
Category grades
Schools grade is shown separately in the Schools card above.
Census & demographics
- Census place
- Springfield, IL
- County
- Sangamon County · 115,414 people
- City population
- 59,955
- Metro
- Springfield, IL
- Population (ZIP)
- 31,033
- Household income
- $51,136
- Rent vs Own
- Severe rent burden
- 1230.0
Population outlook (Sangamon County) Hauer SSP2
- Today (2025)
- 198,317 people
- By 2030
- 196,127 · -1.1%
- By 2040
- 188,664 · -4.9%
- By 2050
- 179,624 · -9.4%
- By 2075
- 155,027 · -21.8%
- By 2100
- 122,588 · -38.2%
Race, ethnicity, and origin ACS 2023
- Neighborhood character
- Predominantly White (72%)
- Race & ethnicity
- White 72% Black 17% Two or more races 8% Hispanic / Latino 3%
- Common ancestry
- Romanian 2% Slovak 2% Serbian 1%
- Foreign-born
- 2% · Canada
- Languages at home
- 96% English-only · Spanish 1% French/Haitian/Cajun 1% Other Indo-European 1%
Political lean MEDSL · Sangamon
- 2024 margin
- Toss-up / Even · D 46.6% · R 51.6% · Other 1.8%
- 2008→2024 swing
- -9.3pp toward R · 2008: 4.4pp · 2024: -5.0pp
- All cycles
- 2024: R+5.0 2020: R+4.4 2016: R+9.4 2012: R+8.7 2008: D+4.4
Not yet ingested
- Civics
- —
Market trends
- HPI YoY
- ▼ -79.98%
- Current HPI
- 149.1926
- Rent YoY
- ▲ 4.95%
- Metro
- Springfield, IL
- State GDP YoY
- ▲ 1.59%
- F500 in state
- 60
Industry mix (Fortune 500 HQ in IL)
| Industry | F500 HQs | Revenue |
|---|---|---|
| Insurance | 4 | $201B |
|
||
| Consumer Goods | 4 | $87B |
|
||
| Industrial Machinery | 3 | $64B |
|
||
| Healthcare | 2 | $55B |
|
||
| Retail / Pharmacy | 1 | $148B |
|
||
| Agriculture / Food | 1 | $86B |
|
||
Price history
1 event — show timeline
- 2026-05-11 Listed $250,000 RMLSA as Distributed by MLS Grid
Cash-flow waterfall
monthlySold comps — $/sqft
last 12 mo · ≤1 miLoading sold comps…