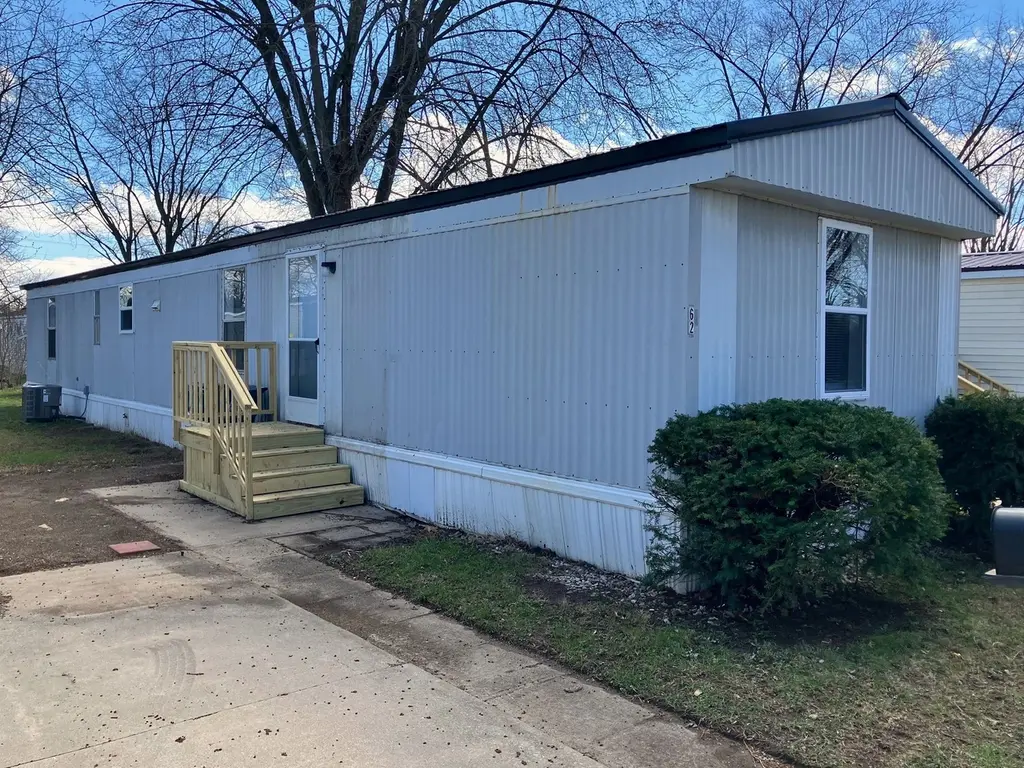
705 E 4th St #62 · Rochester, IN
Flood risk No data
- FEMA flood zone
- —
- Chance of flooding over 30 yrs
- —
- Est. flood insurance / yr
- —
Fire risk No data
- Est. fire insurance / yr
- —
Heat risk No data
- Hot days now (above threshold)
- —
- Hot days in 30 yrs
- —
Wind risk No data
- Chance of severe wind over 30 yrs
- —
Air-quality risk No data
- Unhealthy air days now
- —
- Unhealthy air days in 30 yrs
- —
Risk factors via First Street. Map © Google.
Why this score? — see what drove the D+ grade
The composite is a weighted blend of 9 inputs, each scored 0–100. Each bar is that input's sub-score; the figure is the points it added to the 100-point composite (weight × sub-score).
- Cash flow +15.0/30.0
- ARV discount +7.5/15.0
- 1% rule +5.0/10.0
- DSCR +5.0/10.0
- Condition / age +4.0/5.0
- Livability +3.5/5.0
- Schools +3.0/10.0
- Rent growth +2.5/5.0
- Appreciation +0.0/10.0
$22,200
🖨 Deal sheet (PDF) 📄 Offer letter ✓ Due diligence
Listing remarks
* THIS IS A RESALE LISTING * This welcoming, well-maintained 2 bedroom, 1 bathroom home is a perfect place to raise your family. For your convenience, we have onsite community management to assist you when you need it. With our family-friendly community amenities such as community events, , and , your family will be excited to live here. This home won't be on the market long, so call us today for more information or to schedule a tour. Deposits & Fees are subject to change.
Key facts
- Built 2026
- Listed 51 days
Property features AI
Finance
- Other: Listing status: Active
- Financial info: List price $21,700
Exterior
- Utilities: Natural gas heating; Central air conditioning
- Home design: Spec inventory type; Plan name 91575
- Exterior features: Address: 705 E 4th St #62, Rochester, IN 46975
Interior
- Bedrooms: 2 bedrooms
- Bathrooms: 1 full bathroom
- Heating & cooling: Natural gas heating; Central air conditioning
- Interior features: Living area of 980
Neighborhood map
What this means for you Summary
Snapshot
- This is a 2-bed/1.0-bath manufactured listed at $22k. Condition is rated good.
Deal economics
- At list price, monthly cash flow is $641 ($8k/yr) — positive.
- The deal already cash-flows at list — no discount required.
- Meets the 1% rule at list price ($1k rent vs $22k).
- Recommended offer: $22k (3.0% below list) — sets the bar for market timing.
- Cap rate 41.0% vs local median 2.4% in Rochester — top-decile yield for the area; either an underpriced asset or a hidden risk that comps aren't pricing in. Stress-test before assuming the spread holds.
Location & tenants
- Location reads 69/100 on livability (#206 in IN) — a middle-class / working-renter tenant base. Strengths: cost of living A+, housing A+, health & safety A; Watch: employment D, amenities F, commute F.
- Rochester Community School Corporation (town): math 31% / reading 41% proficiency, ranked #188 of 301 in IN (top 62%) — families likely to look elsewhere, expect single-tenant / working-renter base with shorter leases.
- Zoned schools: George M Riddle Elementary School (math 37% / reading 34%, grade F, #584 of 994 statewide, top 59%, 364 students, 58% FRL); Rochester Community Middle School (math 28% / reading 42%, grade F, #164 of 330 statewide, top 50%, 317 students, 58% FRL); Rochester Community High School (math 27% / reading 62%, grade F, #169 of 369 statewide, top 51%, 610 students, 57% FRL) — zoned schools average 58% FRL vs 41% district-wide (16 pts higher); higher-poverty schools than district average — tighter screening recommended.
- Market conditions: 100 active listings in the ZIP; 4 comparable units currently listed for rent nearby; rentals lingering (median 46d on market — plan ~5-8 weeks vacancy on turnover, expect pricing pressure); 50% of comp listings sitting > 30 days — soft ceiling on asking rent; 23 units permitted in Fulton County in 2024 (0 in 5+ unit buildings).
Forward outlook
- Local home prices are declining (-3.0%/yr); year-one equity from $153 of loan paydown is wiped out by about $666 of value loss. Plan a longer hold.
- Fulton County population projected at -13% by 2050 — secular population decline; favor cash flow + early exit over multi-decade hold.
- At projected returns (-3.0% appreciation + 3.0% rent growth), your $6k cash investment doubles in ~1 year — after that, you're playing with house money.
Negotiation context
- It's been on market 51 days — a 3% lower offer ($22k) is reasonable based on typical stale-listing flexibility.
Questions for the listing agent
- It's been on market 51 days. Have you received any prior offers? Is the seller open to a 3% concession, seller financing, or rate buy-down credit?
- Is there a deadline driving the sale (1031 exchange, divorce, estate, relocation)? That informs how much negotiation room exists.
- Schools are F-rated, which usually means shorter tenancies and higher turnover. Who's the typical renter profile here, and what's been the actual vacancy rate?
- The area grade is low — what's the realistic commute time and amenity access for the typical tenant pool here? Any planned neighborhood developments (good or bad) we should know about?
- What's the average days-on-market for RENTAL listings here right now (not sales)? A rising rental-DOM trend means longer vacancies and softer asking-rent achievability than the comps imply.
- What's the recent tenant-quality profile in this submarket — average credit score on applications, eviction rate, late-payment / NSF rate, and stable-employment percentage? A property-management company in the area should have these aggregated.
- How much new for-sale + rental construction is in the pipeline within 1–3 miles? Heavy new supply typically softens prices + rents 12–24 months out; constrained supply supports both.
Investment metrics
- 1% rule
- 4.53% ✓
- Cap rate
- 40.95%
- Cash-on-cash
- 123.79%
- DSCR
- 6.51
- GRM
- 1.8
CMA / ARV
No comps found within radius.
Projected returns pro-forma
-3.0% appreciation · 3.0% rent growth · sell at horizon
- IRR
- —
- Equity multiple
- 6.99×
- Total profit
- $37,259
- Equity at exit
- $3,310
- IRR
- —
- Equity multiple
- 14.69×
- Total profit
- $85,095
- Equity at exit
- $1,919
Cash invested: $6,216 (down + closing). Projections, not guarantees.
Landlord ↔ Tenant lean methodology
- Overall (STATE)
- 90 Strongly Landlord-Friendly
- State Indiana
- 90 Strongly Landlord-Friendly · R+11
- County
- — inherits STATE
- City
- — inherits STATE
ZIP-level market 46975
- Home prices YoY
- -28.7%
- Active inventory
- 100
- Price-to-rent
- 1.8×
Monthly cashflow live
- Estimated rent
- $1,006 medium interval (Pro) →
- Mortgage (P&I)
- −$116
- Tax est. 1.5%
- −$28 /mo · $333/yr
- Insurance
- −$9
- HOA
- −$0
- Vacancy / Maint / Mgmt
- −$211
- Net cashflow
- $641
Break-even live
Sensitivity live
| Price | -10% $657 | -5% $649 | +0% $641 | +5% $634 | +10% $626 |
|---|---|---|---|---|---|
| Rent | -10% $562 | -5% $602 | +0% $641 | +5% $681 | +10% $721 |
| Rate | -1.0pp $652 | -0.5pp $647 | base $641 | +0.5pp $635 | +1.0pp $630 |
UW: 25.0% down · 7.5% · 30yr · 1.5% tax · 5.0% vac · 8.0% maint · 8.0% mgmt
Financing live
Cash to close
- Down payment
- $5,550
- Closing costs
- $666
- Reserves months
- —
- Total cash needed
- —
Loan-product check · same deal, 3 products live
Conventional
25% down · 7.5% · 30yr
- Down + closing
- —
- Monthly P&I
- —
- Monthly cashflow
- —
- DSCR
- —
- Eligible?
- —
Personal DTI + credit; lowest rate.
DSCR
20% down · 8.5% · 30yr
- Down + closing
- —
- Monthly P&I
- —
- Monthly cashflow
- —
- DSCR
- —
- Eligible?
- —
No personal income docs; deal must DSCR.
Hard money
10% down · 12.0% · 12mo
- Down + closing
- —
- Monthly P&I
- —
- Monthly cashflow
- —
- DSCR
- —
- Eligible?
- —
Short-term bridge; refi at stabilization.
Rent comps 4 comps
| Address | Beds | Baths | Sqft | Rent | $/sqft | DOM | Units | Dist |
|---|---|---|---|---|---|---|---|---|
| 1707 Madison St Rochester, IN | 2.0 | 1.0 | 1000 | $1,195 | $1.20 | 25d | 1 | 1.14mi |
| 2203 E State Road 14 Unit 3 Rochester, IN | 2.0 | 1.0 | 650 | $950 | $1.46 | 46d | 1 | 1.19mi |
| 2203 Indiana 14 Rochester, IN | 2.0 | 1.0 | 650 | $950 | $1.46 | 46d | 1 | 1.20mi |
| 421 Westwood Ln Rochester, IN | 2.0 | 1.0 | 657 | $910 | $1.38 | 25d | 1 | 1.27mi |
Listing history 16 events
-
2026-06-22days on market $22,200 Active 51 DOM
-
2026-06-18days on market $22,200 Active 48 DOM
-
2026-06-17days on market $22,200 Active 47 DOM
-
2026-06-16days on market $22,200 Active 46 DOM
-
2026-06-15days on market $22,200 Active 45 DOM
-
2026-06-14days on market $22,200 Active 43 DOM
-
2026-06-10days on market $22,200 Active 40 DOM
-
2026-06-09days on market $22,200 Active 39 DOM
-
2026-06-08days on market $22,200 Active 38 DOM
-
2026-06-07days on market $22,200 Active 37 DOM
-
2026-06-03days on market $22,200 Active 33 DOM
-
2026-06-02days on market $22,200 Active 32 DOM
-
2026-06-01pricedays on market $22,200 Active 31 DOM
-
2026-05-31days on market $21,700 Active 30 DOM
-
2026-05-31days on market $21,700 Active 29 DOM
-
2026-05-02$21,700 Active 487-char remark
ⓘ Source: listings_history table (triggers on properties + properties_extension) + one-shot
backfill from property_details.listing_events for pre-trigger history.
Nearby sold comps map
Loading sold comps map…
Walkable amenities ~0.75 mi
Loading nearby amenities…
Taxation est. · year 1
- Rental income
- $12,071
- − Mortgage interest
- −$1,244
- − Property taxes
- −$333
- − Insurance
- −$111
- − Repairs & maintenance
- −$966
- − Management
- −$966
- − Depreciation
- −$646
- Taxable income
- $7,806
- Est. tax owed @ 24.0%
- −$1,873
- After-tax cash flow
- $5,821/yr
For passive investors: Depreciation is non-cash, so a rental often shows a tax loss while cash-flowing — sheltering income. Rental losses are passive: they offset passive income freely, and up to $25,000/yr can offset ordinary (W-2) income if you actively participate and your MAGI is under $100k (phasing out to $0 by $150k); unused losses carry forward. On sale, claimed depreciation is recaptured at up to 25%, and gains may owe capital-gains tax (a 1031 exchange can defer both). Figures are a year-1 estimate at your 24.0% rate — not tax advice; consult a CPA.
Condition & rehab AI · 8 photos
This well-maintained 2-bedroom, 1-bathroom mobile home is ready for immediate move-in. It features new flooring, appliances, and fixtures, with a good exterior and landscaping. Minor exterior painting and interior updates would further enhance its value.
Value-add opportunities
- Both Paint exterior siding — Enhances curb appeal and value.
- Both Replace carpet in bedrooms — Freshens up the interior and adds value.
- Both Install new window treatments — Improves energy efficiency and aesthetics.
Renovation cost estimate screening
Value-add ROI direction
- Both Paint exterior siding — Enhances curb appeal and value. ↑
- Both Replace carpet in bedrooms — Freshens up the interior and adds value. ↑
- Both Install new window treatments — Improves energy efficiency and aesthetics. ↑
ⓘ Cost ranges are severity-bucket heuristics (US national rule-of-thumb). Get contractor quotes + a written scope before underwriting a rehab budget.
Schools (NCES district)
- District
- Rochester Community School Corporation
- NCES district ID
- 1809630
- Math proficiency
- 31% ▼ -4.00%
- Reading proficiency
- 41% ▲ 2.00%
- Median HH income
- $42,645
- Composite
- 30.44/100
- National rank
- #6231
- State rank
- #188 of 301 in IN
Livability — Rochester
- Score
- 69/100
- State rank
- #206
- US rank
- #9060
Category grades
Schools grade is shown separately in the Schools card above.
Census & demographics
- Census place
- Rochester, IN
- County
- Fulton County · 13,824 people
- City population
- 13,824
- Metro
- nan
- Population (ZIP)
- 13,824
- Household income
- $61,185
- Rent vs Own
- Severe rent burden
- 238.0
Population outlook (Fulton County) Hauer SSP2
- Today (2025)
- 19,537 people
- By 2030
- 19,013 · -2.7%
- By 2040
- 17,959 · -8.1%
- By 2050
- 17,038 · -12.8%
- By 2075
- 15,117 · -22.6%
- By 2100
- 13,179 · -32.5%
Race, ethnicity, and origin ACS 2023
- Neighborhood character
- Predominantly White (91%)
- Race & ethnicity
- White 91% Hispanic / Latino 4% Two or more races 3%
- Common ancestry
- Iranian 2% Scottish 2% Lithuanian 2%
- Foreign-born
- 1% · Canada
- Languages at home
- 97% English-only · German/W. Germanic 2% Spanish 1%
Political lean MEDSL · Fulton
- 2024 margin
- Solid R (+51.2) · D 23.7% · R 74.9% · Other 1.4%
- 2008→2024 swing
- -35.2pp toward R · 2008: -16.0pp · 2024: -51.2pp
- All cycles
- 2024: R+51.2 2020: R+48.2 2016: R+48.4 2012: R+33.2 2008: R+16.0
Not yet ingested
- Civics
- —
Market trends
- HPI YoY
- ▼ -85.72%
- Current HPI
- 212.9033
- Rent YoY
- —
- Metro
- nan
- State GDP YoY
- ▲ 2.90%
- F500 in state
- 18
Industry mix (Fortune 500 HQ in IN)
| Industry | F500 HQs | Revenue |
|---|---|---|
| Industrial Machinery | 2 | $37B |
|
||
| Healthcare | 1 | $177B |
|
||
| Pharmaceuticals | 1 | $45B |
|
||
| Metals / Steel | 1 | $18B |
|
||
| Agriculture | 1 | $17B |
|
||
| Packaging | 1 | $12B |
|
||
Cash-flow waterfall
monthlySold comps — $/sqft
last 12 mo · ≤1 miLoading sold comps…