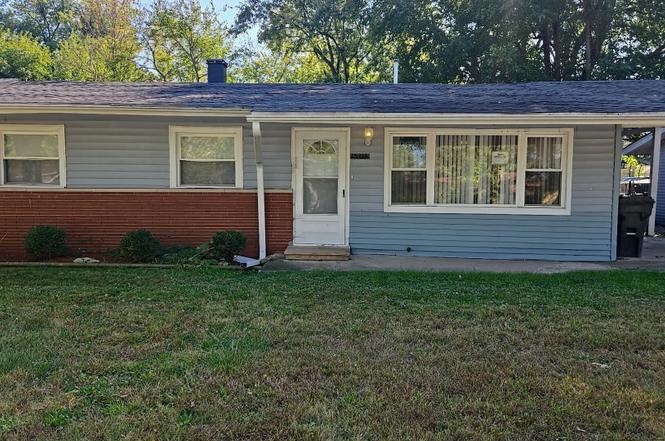
15333 Cherry Ln · Markham, IL
Flood risk 4/10 · Minor
- FEMA flood zone
- X (unshaded)
- Chance of flooding over 30 yrs
- 0.22%
- Est. flood insurance / yr
- $473 – $860
Fire risk 1/10 · Minimal
- Est. fire insurance / yr
- $804 – $1,492
Heat risk 3/10 · Minor
- Hot days now (above 102°F)
- 7 days/yr
- Hot days in 30 yrs
- 15 days/yr
Wind risk 2/10 · Minimal
- Chance of severe wind over 30 yrs
- —
Air-quality risk 3/10 · Minor
- Unhealthy air days now
- 4 days/yr
- Unhealthy air days in 30 yrs
- 4 days/yr
Risk factors via First Street. Map © Google.
Why this score? — see what drove the B+ grade
The composite is a weighted blend of 9 inputs, each scored 0–100. Each bar is that input's sub-score; the figure is the points it added to the 100-point composite (weight × sub-score).
- Cash flow +30.0/30.0
- 1% rule +10.0/10.0
- DSCR +10.0/10.0
- Appreciation +10.0/10.0
- ARV discount +7.5/15.0
- Livability +3.8/5.0
- Rent growth +2.5/5.0
- Condition / age +2.5/5.0
- Schools +1.5/10.0
$84,500
🖨 Deal sheet 📄 Offer letter ✓ Due diligence
Listing remarks
Exciting opportunity! This frame 1 story home offers 3 bedrooms, 1 full bath, and a 1-car attached carport! This property is waiting for the right owner to unlock its full potential and turn it into a stunning home. Conveniently located near shopping and transportation, this home is ideal for a first-time buyer ready to transform it into a fabulous living space or an investor looking to add to their rental portfolio.
Key facts
- Built 1960
- Listed 227 days
Property features AI
Finance
- HOA & community: No master association fee required
Exterior
- Utilities: Public water; Public sewer
- Home design: Detached single-family home; One-story; Fee simple ownership; Built before 1978
- Construction: Frame construction
- Exterior features: Lot less than 0.25 acre; Lot dimensions: 0.17
Interior
- Kitchen: Kitchen (main level, 18 x 6)
- Bedrooms: Master bedroom (main level, 12 x 11); Bedroom 2 (main level, 11 x 11); Bedroom 3 (main level, 11 x 10)
- Bathrooms: 1 full bathroom
- Heating & cooling: Natural gas heating; Forced air
- Interior features: Five total rooms; Dining room; Family room; Living room
- Laundry & utility: Laundry room
Neighborhood map
What this means for you Summary
Snapshot
- This is a 3-bed/1.0-bath single-family listed at $84k.
Deal economics
- At list price, monthly cash flow is $575 ($7k/yr) — positive.
- The deal already cash-flows at list — no discount required.
- Meets the 1% rule at list price ($1k rent vs $84k).
- Recommended offer: $74k (12.0% below list) — sets the bar for market timing.
- Cap rate 14.5% vs local median 10.2% in Markham — top-decile yield for the area; either an underpriced asset or a hidden risk that comps aren't pricing in. Stress-test before assuming the spread holds.
Location & tenants
- Location reads 76/100 on livability (#186 in IL, #3,539 nationally) — a middle-class / working-renter tenant base. Strengths: commute A+, cost of living A+, housing A+; Watch: crime D, amenities D, employment D.
- Bremen Chsd 228 (suburban): math 15% / reading 17% proficiency, ranked #468 of 620 in IL (top 76%) — low school quality limits family demand, transient renter base, plan for 1-2y turnover.
- Market conditions: 65 active listings in the ZIP; 3 comparable units currently listed for rent nearby; rentals leasing fast (median 6d on market — plan ~1-2 weeks tenant-placement turnaround); 6,272 units permitted in Cook County in 2024 (4,658 in 5+ unit buildings).
Forward outlook
- In year one you build about $9k of equity ($584 loan paydown + $8k appreciation (10.0% local appreciation)).
- At projected returns (10.0% appreciation + 3.0% rent growth), your $24k cash investment doubles in ~2 years — after that, you're playing with house money.
- By year 4, paydown + projected appreciation supports a ~$32k cash-out refi (75% LTV) — recoverable capital for the next deal without selling this one.
Negotiation context
- It's been on market 227 days — a 12% lower offer ($74k) is reasonable based on typical stale-listing flexibility.
- 2 sale attempts; this cycle's ask has dropped $50k (37%) from the opening price — seller is motivated, your offer sets the floor, not the list.
- Current owner paid $70k; 22% above their basis — modest negotiation headroom, anchor on the comps not their cost.
Questions for the listing agent
- It's been on market 227 days. Have you received any prior offers? Is the seller open to a 12% concession, seller financing, or rate buy-down credit?
- Built in 1960 — when were the roof, HVAC, electrical panel, plumbing, and water heater last replaced?
- Why hasn't it sold? Are there any deal-killer items the seller is aware of (foundation, flood, title, zoning, code violations)?
- Is there a deadline driving the sale (1031 exchange, divorce, estate, relocation)? That informs how much negotiation room exists.
- Schools are F-rated, which usually means shorter tenancies and higher turnover. Who's the typical renter profile here, and what's been the actual vacancy rate?
- Crime grade is D in this area — have there been break-ins, vandalism, or insurance claims at this property in the last 3 years? What carrier currently insures it and at what premium?
- What's the average days-on-market for RENTAL listings here right now (not sales)? A rising rental-DOM trend means longer vacancies and softer asking-rent achievability than the comps imply.
- What's the recent tenant-quality profile in this submarket — average credit score on applications, eviction rate, late-payment / NSF rate, and stable-employment percentage? A property-management company in the area should have these aggregated.
- How much new for-sale + rental construction is in the pipeline within 1–3 miles? Heavy new supply typically softens prices + rents 12–24 months out; constrained supply supports both.
Investment metrics
- 1% rule
- 1.74% ✓
- Cap rate
- 14.46%
- Cash-on-cash
- 29.16%
- DSCR
- 2.30
- GRM
- 4.8
CMA / ARV
- ARV (on-the-fly)
- $184,800
- Comps found
- 12
Show comp detail 12 sales within ~0.75 mi
| Address | Dist | Beds/Ba | Sqft | Sold | Price | $/sf | Match |
|---|---|---|---|---|---|---|---|
| 15315 Cherry Ln | 0.05mi | 3/1.0 | 1,040 (-6%) | 3mo | $195,000 | $188 | 86 |
| 15313 Cherry Ln | 0.06mi | 3/1.0 | 1,036 (-6%) | 3mo | $89,000 | $86 | 85 |
| 15417 Cherry Ln | 0.07mi | 3/1.0 | 1,040 (-6%) | 5mo | $157,000 | $151 | 83 |
| 15422 Cherry Ln | 0.09mi | 3/1.5 | 1,040 (-6%) | 4mo | $175,000 | $168 | 81 |
| 15330 Cherry Ln | 0.05mi | 4/2.0 (+1) | 1,036 (-6%) | 2mo | $249,900 | $241 | 78 |
| 15435 Hamlin Ave | 0.44mi | 3/1.0 | 1,107 (+1%) | 3mo | $155,000 | $140 | 76 |
| 3236 Roesner Dr | 0.31mi | 3/1.0 | 1,036 (-6%) | 5mo | $77,000 | $74 | 72 |
| 3813 153rd St | 0.42mi | 2/1.0 (-1) | 1,075 (-2%) | 1mo | $268,130 | $249 | 71 |
| 15120 Springfield Ave | 0.60mi | 3/2.0 | 1,127 (+2%) | 1mo | $236,000 | $209 | 63 |
| 14850 Homan Ave | 0.64mi | 3/1.5 | 1,107 (+1%) | 5mo | $185,000 | $167 | 63 |
| 14820 Turner Ave | 0.71mi | 3/1.0 | 1,064 (-3%) | 3mo | $150,000 | $141 | 59 |
| 14839 Lawndale Ave | 0.70mi | 3/2.0 | 1,086 (-1%) | 4mo | $217,000 | $200 | 58 |
Match score weights: distance 35% · size 25% · config 20% · recency 20%. Top-matched comps best support the ARV.
Projected returns pro-forma
10.0% appreciation · 3.0% rent growth · sell at horizon
- IRR
- 46.4%
- Equity multiple
- 4.49×
- Total profit
- $82,665
- Equity at exit
- $76,124
- IRR
- 40.3%
- Equity multiple
- 10.07×
- Total profit
- $214,680
- Equity at exit
- $164,165
Cash invested: $23,660 (down + closing). Projections, not guarantees.
Landlord ↔ Tenant lean methodology
- Overall (STATE)
- 43 Moderately Tenant-Leaning
- State Illinois
- 43 Moderately Tenant-Leaning · D+7
- County
- — inherits STATE
- City
- — inherits STATE
ZIP-level market 60428
- Home prices YoY
- 8.5%
- Active inventory
- 65
- Price-to-rent
- 4.8×
Monthly cashflow live
- Estimated rent
- $1,467 medium interval (Pro) →
- Mortgage (P&I)
- −$443
- Tax est. 1.5%
- −$106 /mo · $1,268/yr
- Insurance
- −$35
- HOA
- −$0
- Vacancy / Maint / Mgmt
- −$308
- Net cashflow
- $575
Break-even live
UW: 25.0% down · 7.5% · 30yr · 1.5% tax · 5.0% vac · 8.0% maint · 8.0% mgmt
Financing live
Cash to close
- Down payment
- $21,125
- Closing costs
- $2,535
- Reserves months
- —
- Total cash needed
- —
Loan-product check · same deal, 3 products live
Conventional
25% down · 7.5% · 30yr
- Down + closing
- —
- Monthly P&I
- —
- Monthly cashflow
- —
- DSCR
- —
- Eligible?
- —
Personal DTI + credit; lowest rate.
DSCR
20% down · 8.5% · 30yr
- Down + closing
- —
- Monthly P&I
- —
- Monthly cashflow
- —
- DSCR
- —
- Eligible?
- —
No personal income docs; deal must DSCR.
Hard money
10% down · 12.0% · 12mo
- Down + closing
- —
- Monthly P&I
- —
- Monthly cashflow
- —
- DSCR
- —
- Eligible?
- —
Short-term bridge; refi at stabilization.
Rent comps 3 comps
| Address | Beds | Baths | Sqft | Rent | $/sqft | DOM | Units | Dist |
|---|---|---|---|---|---|---|---|---|
| 3349 147th St Unit 3240 06 Midlothian, IL | 2.0 | 1.0 | 817 | $1,500 | $1.84 | 5d | 1 | 0.86mi |
| 3542 147th St Midlothian, IL | 2.0 | 1.0 | 817 | $1,500 | $1.84 | 6d | 2 | 0.91mi |
| 14521 Richmond Ave Unit 3 Posen, IL | 2.0 | 1.0 | 850 | $1,375 | $1.62 | 24d | 1 | 1.28mi |
Listing history 19 events
-
2026-06-13statusdays on market $84,500 Pending 227 DOM
-
2026-06-09days on market $84,500 Active 226 DOM
-
2026-06-08days on market $84,500 Active 225 DOM
-
2026-06-07days on market $84,500 Active 224 DOM
-
2026-06-04days on market $84,500 Active 221 DOM
-
2026-06-03days on market $84,500 Active 220 DOM
-
2026-06-02days on market $84,500 Active 219 DOM
-
2026-06-01days on market $84,500 Active 218 DOM
-
2026-05-31days on market $84,500 Active 217 DOM
-
2026-04-23price $87,900
-
2026-03-19price $95,000
-
2026-03-10status Active
-
2026-03-04status Pending
-
2026-02-05price $99,900
-
2026-01-02price $115,000
-
2025-11-20price $119,500
-
2025-10-20$134,900 Active
-
2025-07-24historical
-
2003-11-20soldstatus $69,500
ⓘ Source: listings_history table (triggers on properties + properties_extension) + one-shot
backfill from property_details.listing_events for pre-trigger history.
Climate risk First Street
- Flood 4/10 Moderate FEMA zone X (unshaded) · 22% chance over 30 yrs
- Wildfire 1/10 Low
- Heat 3/10 Moderate 7 d/yr ≥102°F today · 15 d/yr by 30 yrs out
- Wind 2/10 Low
- Air quality 3/10 Moderate 4 unhealthy d/yr today · 4 by 30 yrs out
Nearby sold comps map
Loading sold comps map…
Walkable amenities ~0.75 mi
Loading nearby amenities…
Taxation est. · year 1
- Rental income
- $17,604
- − Mortgage interest
- −$4,733
- − Property taxes
- −$1,268
- − Insurance
- −$422
- − Repairs & maintenance
- −$1,408
- − Management
- −$1,408
- − Depreciation
- −$2,458
- Taxable income
- $5,906
- Est. tax owed @ 24.0%
- −$1,418
- After-tax cash flow
- $5,483/yr
For passive investors: Depreciation is non-cash, so a rental often shows a tax loss while cash-flowing — sheltering income. Rental losses are passive: they offset passive income freely, and up to $25,000/yr can offset ordinary (W-2) income if you actively participate and your MAGI is under $100k (phasing out to $0 by $150k); unused losses carry forward. On sale, claimed depreciation is recaptured at up to 25%, and gains may owe capital-gains tax (a 1031 exchange can defer both). Figures are a year-1 estimate at your 24.0% rate — not tax advice; consult a CPA.
Schools (NCES district)
- District
- Bremen Chsd 228
- NCES district ID
- 1707050
- Math proficiency
- 15% ▼ -4.00%
- Reading proficiency
- 17% ▼ -5.00%
- Median HH income
- $57,625
- Composite
- 15.32/100
- National rank
- #9327
- State rank
- #468 of 620 in IL
Livability — Markham
- Score
- 76/100
- State rank
- #186
- US rank
- #3539
Category grades
Schools grade is shown separately in the Schools card above.
Census & demographics
- Census place
- Markham, IL
- City population
- 10,980
- Population (ZIP)
- 10,980
Population outlook (Cook County) Hauer SSP2
- Today (2025)
- 5,347,519 people
- By 2030
- 5,357,703 · +0.2%
- By 2040
- 5,324,924 · -0.4%
- By 2050
- 5,230,762 · -2.2%
- By 2075
- 4,785,735 · -10.5%
- By 2100
- 4,188,836 · -21.7%
Race, ethnicity, and origin ACS 2023
- Neighborhood character
- Predominantly Black (69%)
- Race & ethnicity
- Black 69% Hispanic / Latino 17% White 11% Two or more races 4%
- Hispanic origin (detail)
- Mexican 16%
- Common ancestry
- Romanian 1% Lithuanian 1% Iranian 1%
- Foreign-born
- 8% · Canada
- Languages at home
- 86% English-only · Spanish 14%
Political lean MEDSL · Cook
- 2024 margin
- Solid D (+42.0) · D 70.4% · R 28.4% · Other 1.2%
- 2008→2024 swing
- -11.4pp toward R · 2008: 53.4pp · 2024: 42.0pp
- All cycles
- 2024: D+42.0 2020: D+50.3 2016: D+53.0 2012: D+49.4 2008: D+53.4
Not yet ingested
- Civics
- —
Market trends
- HPI YoY
- ▲ 23.63%
- Current HPI
- 302.333
- Rent YoY
- —
- Metro
- —
- State GDP YoY
- ▲ 1.59%
- F500 in state
- 60
Industry mix (Fortune 500 HQ in IL)
| Industry | F500 HQs | Revenue |
|---|---|---|
| Insurance | 4 | $201B |
|
||
| Consumer Goods | 4 | $87B |
|
||
| Industrial Machinery | 3 | $64B |
|
||
| Healthcare | 2 | $55B |
|
||
| Retail / Pharmacy | 1 | $148B |
|
||
| Agriculture / Food | 1 | $86B |
|
||
Price history
+26.5% since first listed10 events — show timeline
- 2026-04-23 Price Changed $87,900 MRED as Distributed by MLS Grid
- 2026-03-19 Price Changed $95,000 MRED as Distributed by MLS Grid
- 2026-03-10 Relisted — MRED as Distributed by MLS Grid
- 2026-03-04 Pending — MRED as Distributed by MLS Grid
- 2026-02-05 Price Changed $99,900 MRED as Distributed by MLS Grid
- 2026-01-02 Price Changed $115,000 MRED as Distributed by MLS Grid
- 2025-11-20 Price Changed $119,500 MRED as Distributed by MLS Grid
- 2025-10-20 Listed $134,900 MRED as Distributed by MLS Grid
- 2025-07-24 Listing Removed — MRED as Distributed by MLS Grid
- 2003-11-20 Sold (Public Records) $69,500 Public Records
Property tax history
+4.9%/yrLatest (2023): $5,338 · +57.7% YoY. Source: county tax records.
Cash-flow waterfall
monthlySold comps — $/sqft
last 12 mo · ≤1 miLoading sold comps…