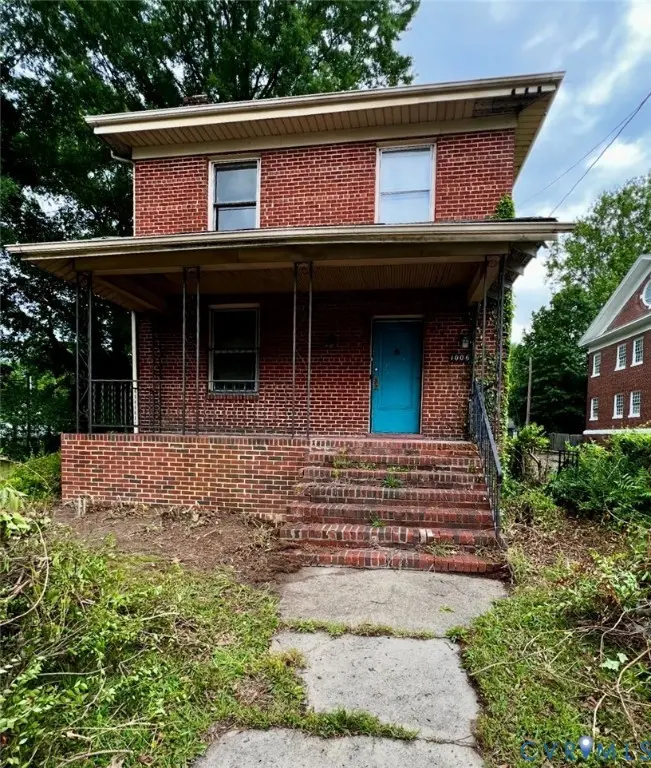
1006 E Brookland Park Blvd · Richmond, VA
Flood risk 1/10 · Minimal
- FEMA flood zone
- X (unshaded)
- Chance of flooding over 30 yrs
- 0.0%
- Est. flood insurance / yr
- $473 – $860
Fire risk 1/10 · Minimal
- Est. fire insurance / yr
- $666 – $1,236
Heat risk 7/10 · Major
- Hot days now (above 105°F)
- 7 days/yr
- Hot days in 30 yrs
- 16 days/yr
Wind risk 6/10 · Moderate
- Chance of severe wind over 30 yrs
- 27.0%
Air-quality risk 2/10 · Minimal
- Unhealthy air days now
- 1 days/yr
- Unhealthy air days in 30 yrs
- 3 days/yr
Risk factors via First Street. Map © Google.
Why this score? — see what drove the C grade
The composite is a weighted blend of 9 inputs, each scored 0–100. Each bar is that input's sub-score; the figure is the points it added to the 100-point composite (weight × sub-score).
- Cash flow +24.5/30.0
- DSCR +7.9/10.0
- ARV discount +7.5/15.0
- 1% rule +5.6/10.0
- Rent growth +4.4/5.0
- Livability +4.2/5.0
- Schools +3.3/10.0
- Condition / age +2.5/5.0
- Appreciation +0.0/10.0
$180,000
🖨 Deal sheet 📄 Offer letter ✓ Due diligence
Listing remarks
Exceptional investment and renovation opportunity in one of Richmond's growing neighborhoods. Situated on a corner lot near historic churches and just minutes from downtown, this property offers the chance to restore and reimagine a home with character and potential. Key improvements are already underway, including a new front door and replacement windows, providing a strong starting point for your renovation plans and helping offset initial project costs. This growing area continues to attract attention for its historic architecture, vibrant community, local businesses, and convenient access to downtown Richmond, VCU, major highways, parks, and cultural amenities. Sold strictly as-is, the
Key facts
- New front door
- Corner lot
- Replacement windows
Tags
Property features AI
Exterior
- Parking: On-street parking
- Utilities: Public water; Public sewer
- Home design: 2-story property; Resale condition; R-5 zoning
- Construction: Brick and block construction; Composition shingle roof; Below-grade unfinished area (~720); Above-grade finished area (~1,440); Built (year type recorded as Actual)
- Exterior features: Partial chain link fenced yard
Interior
- Bedrooms: Bedrooms located on second level
- Flooring: Wood flooring
- Bathrooms: One full bathroom with tub and shower on second level; One half bathroom on second level
- Heating & cooling: Electric heating; Heat pump cooling
- Interior features: Wood flooring throughout; Unfinished basement; Masonry wood-burning fireplace
Neighborhood map
What this means for you Summary
Snapshot
- This is a 3-bed/1.0-bath single-family listed at $180k.
Deal economics
- At list price, monthly cash flow is $369 ($4k/yr) — positive.
- The deal already cash-flows at list — no discount required.
- Meets the 1% rule at list price ($2k rent vs $180k).
- Cap rate 8.8% vs local median 3.3% in Richmond — top-decile yield for the area; either an underpriced asset or a hidden risk that comps aren't pricing in. Stress-test before assuming the spread holds.
Location & tenants
- Location reads 84/100 on livability (#33 in VA, #793 nationally) — a professional / high-income tenant draw. Strengths: amenities A+, commute A+, health & safety A+; Watch: crime D-.
- Richmond City Public School District (urban): math 32% / reading 47% proficiency, ranked #123 of 131 in VA (top 94%) — families likely to look elsewhere, expect single-tenant / working-renter base with shorter leases; 74% free/reduced lunch — lower-income household profile, screen leases tightly.
- Market conditions: Rents rising fast (+7.4%/yr); 179 active listings in the ZIP; 40 comparable units currently listed for rent nearby; rentals at typical pace (median 24d on market — plan ~3-4 weeks tenant-placement turnaround); 2,540 units permitted in Richmond city in 2024 (2,077 in 5+ unit buildings).
- This rent runs 37% of the median local income ($61k/yr) — at the standard rent-burdened threshold; future hikes will face affordability resistance.
Forward outlook
- Local home prices are declining (-3.0%/yr); year-one equity from $1k of loan paydown is wiped out by about $5k of value loss. Plan a longer hold.
- Richmond County population projected at +40% by 2050 — long-run rental-demand tailwind backs the buy-and-hold thesis.
- At projected returns (-3.0% appreciation + 7.4% rent growth), your $50k cash investment doubles in ~8 years — after that, you're playing with house money.
Negotiation context
- Only 1 days on market — expect competitive offers; lowballing is unlikely to land.
- 2 sale attempts since 16y ago with the ask held roughly flat each time — persistent listings suggest the price (not the market) is what's stuck; bring a comps-based counter.
Risks & watch-outs
- Watch-outs: built in 1923 — expect roof / HVAC / electrical / plumbing capex.
- Climate carrying-cost: major wind risk, 27% chance of damaging wind over 30y; extreme-heat days projected 7→16/yr by 2055 (HVAC capex compounding) — expect insurance premiums to compound above CPI over the hold.
Questions for the listing agent
- Built in 1923 — when were the roof, HVAC, electrical panel, plumbing, and water heater last replaced?
- Is there a deadline driving the sale (1031 exchange, divorce, estate, relocation)? That informs how much negotiation room exists.
- Schools are A-rated — typically a magnet for longer-tenancy family renters. What's the average tenant stay here, and is there a school-zone premium baked into asking?
- Crime grade is D in this area — have there been break-ins, vandalism, or insurance claims at this property in the last 3 years? What carrier currently insures it and at what premium?
- What's the average days-on-market for RENTAL listings here right now (not sales)? A rising rental-DOM trend means longer vacancies and softer asking-rent achievability than the comps imply.
- What's the recent tenant-quality profile in this submarket — average credit score on applications, eviction rate, late-payment / NSF rate, and stable-employment percentage? A property-management company in the area should have these aggregated.
- How much new for-sale + rental construction is in the pipeline within 1–3 miles? Heavy new supply typically softens prices + rents 12–24 months out; constrained supply supports both.
Investment metrics
- 1% rule
- 1.06% ✓
- Cap rate
- 8.76%
- Cash-on-cash
- 8.80%
- DSCR
- 1.39
- GRM
- 7.9
CMA / ARV
- ARV (on-the-fly)
- $372,960
- Comps found
- 12
Show comp detail 12 sales within ~0.75 mi
| Address | Dist | Beds/Ba | Sqft | Sold | Price | $/sf | Match |
|---|---|---|---|---|---|---|---|
| 1206 Newbury Ave | 0.07mi | 3/2.5 | 1,337 (-7%) | 1mo | $325,000 | $243 | 78 |
| 603 Arnold Ave | 0.25mi | 3/1.5 | 1,284 (-11%) | 0mo | $345,000 | $269 | 68 |
| 636 Overby Bend Rd | 0.55mi | 3/2.0 | 1,492 (+4%) | 2mo | $355,000 | $238 | 63 |
| 3020 Woodrow Ave | 0.47mi | 3/1.0 | 1,290 (-10%) | 1mo | $190,000 | $147 | 60 |
| 640 Overby Bend Rd | 0.54mi | 3/2.5 | 1,344 (-7%) | 2mo | $348,393 | $259 | 56 |
| 3520 Delaware Ave | 0.67mi | 3/2.5 | 1,496 (+4%) | 1mo | $430,000 | $287 | 55 |
| 504 Arnold Ave | 0.34mi | 3/2.5 | 1,254 (-13%) | 2mo | $340,000 | $271 | 55 |
| 3120 Woodrow Ave | 0.51mi | 4/1.5 (+1) | 1,560 (+8%) | 2mo | $255,000 | $163 | 54 |
| 611 Pollock St | 0.42mi | 2/1.0 (-1) | 1,254 (-13%) | 0mo | $280,000 | $223 | 54 |
| 3415 Delaware Ave | 0.54mi | 4/2.0 (+1) | 1,548 (+8%) | 2mo | $415,000 | $268 | 52 |
| 3510 Maryland Ave | 0.62mi | 3/2.0 | 1,305 (-9%) | 1mo | $350,000 | $268 | 50 |
| 514 Pollock St | 0.48mi | 3/2.5 | 1,642 (+14%) | 0mo | $394,000 | $240 | 48 |
Match score weights: distance 35% · size 25% · config 20% · recency 20%. Top-matched comps best support the ARV.
Projected returns pro-forma
-3.0% appreciation · 7.43% rent growth · sell at horizon
- IRR
- 1.6%
- Equity multiple
- 1.06×
- Total profit
- $3,210
- Equity at exit
- $26,839
- IRR
- 15.0%
- Equity multiple
- 2.45×
- Total profit
- $72,899
- Equity at exit
- $15,563
Cash invested: $50,400 (down + closing). Projections, not guarantees.
Landlord ↔ Tenant lean methodology
- Overall (STATE)
- 55 Moderately Landlord-Leaning
- State Virginia
- 55 Moderately Landlord-Leaning · D+2
- County
- — inherits STATE
- City
- — inherits STATE
ZIP-level market 23222
- Rents YoY
- 7.4%
- Active inventory
- 179
- Price-to-rent
- 7.9×
Monthly cashflow live
- Estimated rent
- $1,908 high interval (Pro) →
- Mortgage (P&I)
- −$944
- Tax from tax record
- −$119 /mo · $1,428/yr
- Insurance
- −$75
- HOA
- −$0
- Vacancy / Maint / Mgmt
- −$401
- Net cashflow
- $369
Break-even live
UW: 25.0% down · 7.5% · 30yr · 1.5% tax · 5.0% vac · 8.0% maint · 8.0% mgmt
Financing live
Cash to close
- Down payment
- $45,000
- Closing costs
- $5,400
- Reserves months
- —
- Total cash needed
- —
Loan-product check · same deal, 3 products live
Conventional
25% down · 7.5% · 30yr
- Down + closing
- —
- Monthly P&I
- —
- Monthly cashflow
- —
- DSCR
- —
- Eligible?
- —
Personal DTI + credit; lowest rate.
DSCR
20% down · 8.5% · 30yr
- Down + closing
- —
- Monthly P&I
- —
- Monthly cashflow
- —
- DSCR
- —
- Eligible?
- —
No personal income docs; deal must DSCR.
Hard money
10% down · 12.0% · 12mo
- Down + closing
- —
- Monthly P&I
- —
- Monthly cashflow
- —
- DSCR
- —
- Eligible?
- —
Short-term bridge; refi at stabilization.
Rent comps 40 comps
| Address | Beds | Baths | Sqft | Rent | $/sqft | DOM | Units | Dist |
|---|---|---|---|---|---|---|---|---|
| 2810 2nd Ave Richmond, VA | 2.0 | 1.0 | 1120 | $1,950 | $1.74 | 43d | 1 | 0.15mi |
| 3117 Meadowbridge Rd Richmond, VA | 2.0 | 1.0 | 887 | $1,225 | $1.38 | 43d | 1 | 0.28mi |
| 2919 4th Ave #2 Richmond, VA | 2.0 | 2.0 | 950 | $1,287 | $1.35 | 43d | 1 | 0.29mi |
| 3017 Dill Ave Richmond, VA | 4.0 | 2.0 | 1578 | $1,895 | $1.20 | 3d | 1 | 0.29mi |
| 3202 1st Ave Richmond, VA | 3.0 | 2.5 | 1440 | $2,062 | $1.43 | 21d | 1 | 0.31mi |
| 3103 Dill Ave Richmond, VA | 3.0 | 1.5 | 1380 | $2,050 | $1.49 | 23d | 1 | 0.34mi |
| 3211 Maryland Ave Richmond, VA | 4.0 | 1.5 | 1344 | $1,871 | $1.39 | 43d | 1 | 0.35mi |
| 622 Pollock St Richmond, VA | 3.0 | 1.5 | 1122 | $2,300 | $2.05 | 23d | 1 | 0.46mi |
| 3418 Carolina Ave Unit A Richmond, VA | 2.0 | 1.0 | 1000 | $1,524 | $1.52 | 43d | 1 | 0.55mi |
| 3425 Carolina Ave Unit A Richmond, VA | 3.0 | 1.0 | 1300 | $1,400 | $1.08 | 43d | 1 | 0.56mi |
| 3324 Meadowbridge Rd Richmond, VA | 4.0 | 2.5 | 1667 | $2,175 | $1.30 | 17d | 1 | 0.57mi |
| 3425 Carolina Ave Unit B Richmond, VA | 3.0 | 1.0 | 1300 | $1,400 | $1.08 | 23d | 1 | 0.57mi |
| 3511 1st Ave Richmond, VA | 4.0 | 1.5 | 1600 | $2,050 | $1.28 | 23d | 1 | 0.62mi |
| 3317 Waverly Blvd Unit B Richmond, VA | 3.0 | 2.0 | 1500 | $1,875 | $1.25 | 17d | 1 | 0.62mi |
| 2420 Barton Ave Apt 2 Richmond, VA | 2.0 | 1.0 | 900 | $1,150 | $1.28 | 23d | 1 | 0.69mi |
| 2416 Barton Ave Apt 2 Richmond, VA | 2.0 | 1.0 | 1000 | $1,150 | $1.15 | 43d | 1 | 0.70mi |
| 3501 Meadowbridge Rd Richmond, VA | 3.0 | 1.0 | 1383 | $1,495 | $1.08 | 20d | 1 | 0.72mi |
| 3501 Meadowbridge Rd Richmond, VA | 3.0 | 1.0 | 1383 | $1,495 | $1.08 | 23d | 1 | 0.72mi |
| 3101 Divine Dr Richmond, VA | 3.0 | 2.5 | 1525 | $2,700 | $1.77 | 3d | 1 | 0.73mi |
| 3204 North Ave Richmond, VA | 3.0 | 2.5 | 1626 | $2,395 | $1.47 | 4d | 1 | 0.74mi |
| 3621 Enslow Ave Richmond, VA | 2.0 | 1.5 | 1232 | $2,850 | $2.31 | 23d | 1 | 0.76mi |
| 3311 Cliff Ave Richmond, VA | 2.0 | 1.5 | 1567 | $2,000 | $1.28 | 43d | 1 | 0.78mi |
| 3615 Missouri Ave Richmond, VA | 3.0 | 2.0 | 1758 | $2,150 | $1.22 | 43d | 1 | 0.80mi |
| 1519 Byron St Richmond, VA | 3.0 | 1.5 | 1384 | $1,700 | $1.23 | 3d | 1 | 0.85mi |
| 200 Minor St Unit A Richmond, VA | 3.0 | 1.0 | 1100 | $1,295 | $1.18 | 23d | 1 | 0.92mi |
| 1801 Monteiro Ave Unit 1 Richmond, VA | 2.0 | 2.0 | 1500 | $1,550 | $1.03 | 4d | 1 | 0.94mi |
| 1910 North Ave Richmond, VA | 3.0 | 1.0 | 1010 | $1,595 | $1.58 | 10d | 1 | 0.96mi |
| 2807 Edgewood Ave Richmond, VA | 3.0 | 1.0 | 1320 | $1,750 | $1.33 | 43d | 1 | 0.97mi |
| 3716 Delmont St Richmond, VA | 2.0 | 2.0 | 890 | $1,122 | $1.26 | 43d | 1 | 0.97mi |
| 207 Welford St Richmond, VA | 3.0 | 1.5 | 1348 | $1,850 | $1.37 | 23d | 1 | 0.97mi |
| 3909 Patrick Ave Richmond, VA | 3.0 | 1.5 | 1200 | $2,650 | $2.21 | 43d | 1 | 0.99mi |
| 3007 Moss Side Ave Richmond, VA | 3.0 | 2.5 | 1772 | $2,495 | $1.41 | 23d | 1 | 1.10mi |
| 2423 Whitcomb St Richmond, VA | 3.0 | 1.0 | 1000 | $1,100 | $1.10 | 23d | 1 | 1.15mi |
| 3800 North Ave Richmond, VA | 3.0 | 1.0 | 1008 | $1,650 | $1.64 | 11d | 1 | 1.16mi |
| 2806 Hawthorne Ave Unit 1 Richmond, VA | 2.0 | 1.0 | 1144 | $1,400 | $1.22 | 43d | 1 | 1.17mi |
| 2922 Noble Ave Unit A Richmond, VA | 2.0 | 1.0 | 1200 | $1,499 | $1.25 | 4d | 1 | 1.18mi |
| 4008 Wilmont Dr Richmond, VA | 3.0 | 1.0 | 1040 | $2,095 | $2.01 | 23d | 1 | 1.29mi |
| 1806 Sussex St Richmond, VA | 4.0 | 2.0 | 1197 | $2,500 | $2.09 | 43d | 1 | 1.29mi |
| 403 Fritz St Richmond, VA | 2.0 | 1.0 | 1000 | $1,595 | $1.59 | 43d | 1 | 1.31mi |
| 1601 Roane St Richmond, VA | 1.0–3.0 | 1.0–2.5 | 914 | $2,100 | $2.30 | 1d | 28 | 1.39mi |
Listing history 2 events
-
2026-06-07remarks 699-char remark
-
2026-06-07$180,000 Pending 1 DOM
ⓘ Source: listings_history table (triggers on properties + properties_extension) + one-shot
backfill from property_details.listing_events for pre-trigger history.
Tax reassessment forecast VA · Resets to sale price
- Current annual tax
- $1,428 · $119/mo
- Projected year-2 tax
- $1,476 · $123/mo
- Expected delta
- +$48/yr (+$4/mo · 3.4%)
ⓘ Screening estimate from a state-policy table — verify with the county assessor before closing.
Climate risk First Street
- Flood 1/10 Low FEMA zone X (unshaded) · 0% chance over 30 yrs
- Wildfire 1/10 Low
- Heat 7/10 Severe 7 d/yr ≥105°F today · 16 d/yr by 30 yrs out
- Wind 6/10 Major 27% chance of damaging wind over 30 yrs
- Air quality 2/10 Low 1 unhealthy d/yr today · 3 by 30 yrs out
Nearby sold comps map
Loading sold comps map…
Walkable amenities ~0.75 mi
Loading nearby amenities…
Taxation est. · year 1
- Rental income
- $22,897
- − Mortgage interest
- −$10,083
- − Property taxes
- −$1,428
- − Insurance
- −$900
- − Repairs & maintenance
- −$1,832
- − Management
- −$1,832
- − Depreciation
- −$5,236
- Taxable income
- $1,586
- Est. tax owed @ 24.0%
- −$381
- After-tax cash flow
- $4,053/yr
For passive investors: Depreciation is non-cash, so a rental often shows a tax loss while cash-flowing — sheltering income. Rental losses are passive: they offset passive income freely, and up to $25,000/yr can offset ordinary (W-2) income if you actively participate and your MAGI is under $100k (phasing out to $0 by $150k); unused losses carry forward. On sale, claimed depreciation is recaptured at up to 25%, and gains may owe capital-gains tax (a 1031 exchange can defer both). Figures are a year-1 estimate at your 24.0% rate — not tax advice; consult a CPA.
Schools (NCES district)
- District
- Richmond City Public School District
- NCES district ID
- 5103240
- Math proficiency
- 32% ▼ -24.00%
- Reading proficiency
- 47% ▼ -9.00%
- Median HH income
- $40,276
- Composite
- 33.09/100
- National rank
- #5564
- State rank
- #123 of 131 in VA
Livability — Richmond
- Score
- 84/100
- State rank
- #33
- US rank
- #793
Category grades
Schools grade is shown separately in the Schools card above.
Census & demographics
- Census place
- Richmond, VA
- County
- Richmond City · 178,280 people
- City population
- 287,109
- Metro
- Richmond, VA
- Population (ZIP)
- 26,322
- Household income
- $61,345
- Rent vs Own
- Severe rent burden
- 1325.0
Population outlook (Richmond County) Hauer SSP2
- Today (2025)
- 262,263 people
- By 2030
- 284,503 · +8.5%
- By 2040
- 327,353 · +24.8%
- By 2050
- 367,946 · +40.3%
- By 2075
- 449,560 · +71.4%
- By 2100
- 500,301 · +90.8%
Race, ethnicity, and origin ACS 2023
- Neighborhood character
- Predominantly Black (70%)
- Race & ethnicity
- Black 70% White 21% Two or more races 4% Hispanic / Latino 3% Asian 2%
- Common ancestry
- Lithuanian 1% Italian 1% Serbian 1%
- Foreign-born
- 5% · Canada
- Languages at home
- 95% English-only · Spanish 2% Other Indo-European 1%
Political lean MEDSL · Richmond
- 2024 margin
- Solid D (+66.3) · D 82.0% · R 15.8% · Other 2.2%
- 2008→2024 swing
- +7.2pp toward D · 2008: 59.1pp · 2024: 66.3pp
- All cycles
- 2024: D+66.3 2020: D+68.0 2016: D+63.8 2012: D+55.7 2008: D+59.1
Not yet ingested
- Civics
- —
Market trends
- HPI YoY
- ▼ -288.72%
- Current HPI
- 428.4029
- Rent YoY
- ▲ 7.43%
- Metro
- Richmond, VA
- State GDP YoY
- ▲ 2.40%
- F500 in state
- 50
Industry mix (Fortune 500 HQ in VA)
| Industry | F500 HQs | Revenue |
|---|---|---|
| Aerospace / Defense | 4 | $236B |
|
||
| Technology / Defense | 3 | $32B |
|
||
| Financial Services | 2 | $176B |
|
||
| Utilities | 2 | $27B |
|
||
| Insurance | 2 | $25B |
|
||
| Technology | 2 | $15B |
|
||
Price history
+89.5% since first listed4 events — show timeline
- 2026-06-04 Pending — CVRMLS
- 2026-06-03 Listed $180,000 CVRMLS
- 2011-04-12 Listing Removed — CVRMLS
- 2010-10-13 Listed $95,000 CVRMLS
Property tax history
+37.6%/yrLatest (2022): $1,428 · +141.8% YoY. Source: county tax records.
Cash-flow waterfall
monthlySold comps — $/sqft
last 12 mo · ≤1 miLoading sold comps…