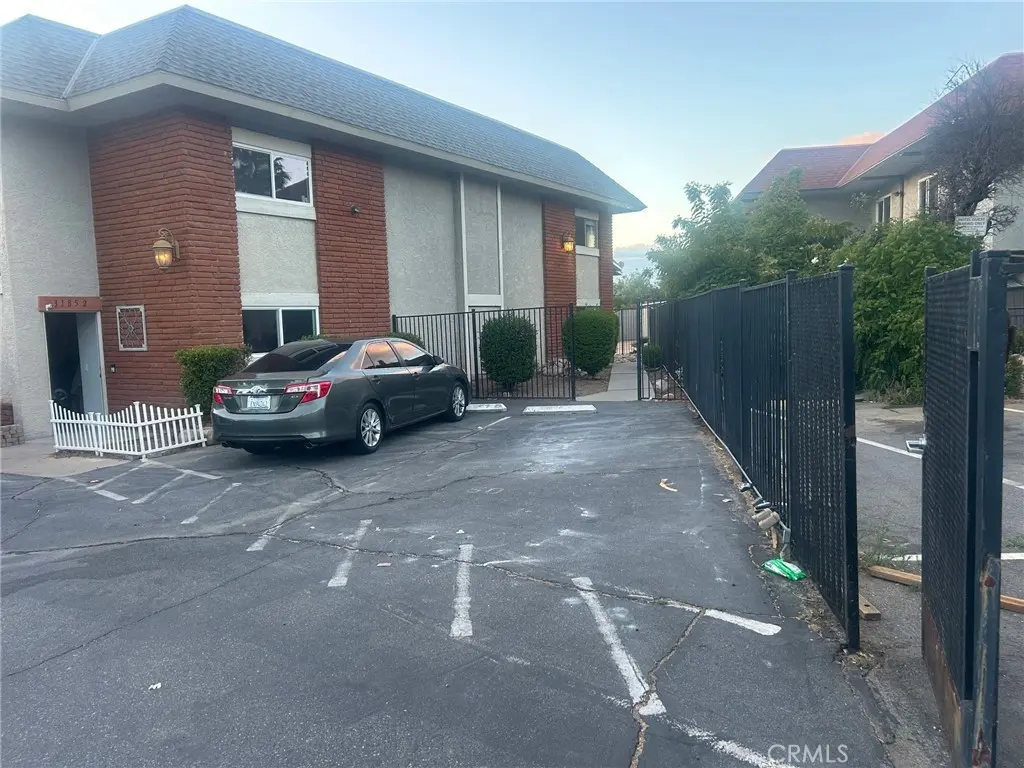
31848 Railroad canyon Rd · Canyon Lake, CA
Flood risk 1/10 · Minimal
- FEMA flood zone
- X (unshaded)
- Chance of flooding over 30 yrs
- 0.0%
- Est. flood insurance / yr
- $507 – $1,088
Fire risk 6/10 · Moderate
- Est. fire insurance / yr
- $659 – $1,223
Heat risk 6/10 · Moderate
- Hot days now (above 104°F)
- 7 days/yr
- Hot days in 30 yrs
- 18 days/yr
Wind risk 1/10 · Minimal
- Chance of severe wind over 30 yrs
- —
Air-quality risk 6/10 · Moderate
- Unhealthy air days now
- 9 days/yr
- Unhealthy air days in 30 yrs
- 11 days/yr
Risk factors via First Street. Map © Google.
Why this score? — see what drove the D grade
The composite is a weighted blend of 9 inputs, each scored 0–100. Each bar is that input's sub-score; the figure is the points it added to the 100-point composite (weight × sub-score).
- Cash flow +13.0/30.0
- ARV discount +7.5/15.0
- 1% rule +5.6/10.0
- DSCR +3.9/10.0
- Schools +3.7/10.0
- Livability +2.8/5.0
- Rent growth +2.5/5.0
- Condition / age +2.5/5.0
- Appreciation +0.0/10.0
$304,950
🖨 Deal sheet (PDF) 📄 Offer letter ✓ Due diligence
Listing remarks MLS
* * * * COME STEAL A REAL DEAL * * * * * * * MOVE IN READY CONDO * * * * * * 2 BEDROOMS, 2 BATHROOMS, LIVING ROOM AND DINING ROOM. “SELLER WANTS SOLD” AND WILL CONTRIBUTE UP TO MAX 3% OF THE SALES PRICE TOWARDS BUYER COSTS ( “Seller will credit buyer up to a maximum 3% of sales price towards closing costs if negotiated in final signed counter offer. ” ) * * * * * SUBMIT ALL OFFERS * * * * *
Key facts
- Swimming pools
- 18 hole golf course
- Community pool area
Tags
Property features AI
Finance
- Other: Parcel number: 355300025
- Financial info: Subject to special assessments
- HOA & community: Part of an association (CLPOA); Monthly association fee of $362; Secondary monthly association fee of $390; Community amenities include sport court, hiking trails, pickleball, horse trails, playground, dock, electricity, tennis, golf, pool, dog park, barbecue, club house, picnic area, biking trails; Community features include watersports, hiking, fishing, riding/stables, lake, biking, park, dog park; Community of 12 units
Exterior
- Parking: Garage (1 garage space, 1 total parking space)
- Utilities: Public sewer; District/public water
- Home design: Attached property in a planned development; Two total stories; Single-unit (one total unit)
- Construction: Year built source: public records
- Exterior features: House structure; Association, community, and private pool access
Interior
- Kitchen: Kitchen (appliances not specified)
- Bedrooms: Main floor bedroom
- Bathrooms: One full bathroom; One three-quarter bathroom
- Heating & cooling: Central furnace heating; Central cooling
- Interior features: Two levels; Main-level entry; Has a view
- Laundry & utility: Laundry inside (washer and dryer included); Washer hookup; Laundry in closet; Laundry on upper level
Neighborhood map
What this means for you Summary
Snapshot
- This is a 2-bed/2.0-bath condo listed at $305k.
Deal economics
- At list price, monthly cash flow is $-16 ($-190/yr) — negative.
- To cash-flow at today's rent, offer at most $302k (0.9% below list).
- Meets the 1% rule at list price ($3k rent vs $305k).
- Recommended offer: $300k (1.5% below list) — sets the bar for market timing.
- Cap rate 6.2% vs local median 2.3% in Canyon Lake — top-decile yield for the area; either an underpriced asset or a hidden risk that comps aren't pricing in. Stress-test before assuming the spread holds.
Location & tenants
- Location reads 56/100 on livability (#825 in CA) — a working-class tenant base; expect higher turnover. Strengths: crime A+, employment A+, housing A+; Watch: health & safety C-, amenities F, commute F.
- Lake Elsinore Unified (suburban): math 34% / reading 49% proficiency, ranked #210 of 517 in CA (top 41%) — families likely to look elsewhere, expect single-tenant / working-renter base with shorter leases.
- Zoned schools: Cottonwood Canyon Elementary (math 54% / reading 54%, grade C, #311 of 1,571 statewide, top 21%, 789 students, 50% FRL); Canyon Lake Middle (math 44% / reading 64%, grade B-, #78 of 498 statewide, top 15%, 955 students, 51% FRL); Temescal Canyon High (math 50% / reading 90%, grade B+, #112 of 1,170 statewide, top 10%, 2,176 students, 59% FRL).
- Zoned-school proficiency averages 60% at this address vs 42% district-wide (+18 pts) — the actual schools serving this property are materially stronger than the Lake Elsinore Unified average implies; a family-tenant draw the district grade alone would hide.
- Market conditions: 255 active listings in the ZIP; 12 comparable units currently listed for rent nearby; rentals at typical pace (median 26d on market — plan ~3-4 weeks tenant-placement turnaround); 9,195 units permitted in Riverside County in 2024 (1,512 in 5+ unit buildings).
Forward outlook
- Local home prices are declining (-3.0%/yr); year-one equity from $2k of loan paydown is wiped out by about $9k of value loss. Plan a longer hold.
- Riverside County population projected at +22% by 2050 — long-run rental-demand tailwind backs the buy-and-hold thesis.
Negotiation context
- It's been on market 18 days — a 2% lower offer ($300k) is reasonable based on typical stale-listing flexibility.
- 4 sale attempts since 21y ago with the ask held roughly flat each time — persistent listings suggest the price (not the market) is what's stuck; bring a comps-based counter.
- Current owner paid $52k; list at $305k implies a 486% gain — meaningful room to come down on a strong offer.
Risks & watch-outs
- Watch-outs: HOA is 23% of rent.
- Climate carrying-cost: major wildfire risk; extreme-heat days projected 7→18/yr by 2055 (HVAC capex compounding) — expect insurance premiums to compound above CPI over the hold.
Questions for the listing agent
- What do current leases actually rent for vs. the listed asking? Can we see a recent rent roll and the last 12 months of T-12 income?
- Built in 1976 — when were the roof, HVAC, electrical panel, plumbing, and water heater last replaced?
- What does the HOA fee cover, when was the last increase, and are there any pending special assessments or reserve-fund shortfalls?
- Any open or pending special assessments — roof, HVAC, plumbing, elevator, façade? What's the per-unit balance and payoff schedule, and is the seller paying it off at close or rolling it to the buyer?
- Is there a deadline driving the sale (1031 exchange, divorce, estate, relocation)? That informs how much negotiation room exists.
- Schools are D-rated, which usually means shorter tenancies and higher turnover. Who's the typical renter profile here, and what's been the actual vacancy rate?
- The area grade is low — what's the realistic commute time and amenity access for the typical tenant pool here? Any planned neighborhood developments (good or bad) we should know about?
- What's the average days-on-market for RENTAL listings here right now (not sales)? A rising rental-DOM trend means longer vacancies and softer asking-rent achievability than the comps imply.
- What's the recent tenant-quality profile in this submarket — average credit score on applications, eviction rate, late-payment / NSF rate, and stable-employment percentage? A property-management company in the area should have these aggregated.
- How much new apartment / multifamily construction is in the pipeline within 1–3 miles? Heavy new supply (>2% of stock underway) typically softens rents 12–24 months out; light construction supports rent growth.
Investment metrics
- 1% rule
- 1.06% ✓
- Cap rate
- 6.23%
- Cash-on-cash
- -0.22%
- DSCR
- 0.99
- GRM
- 7.9
CMA / ARV
No comps found within radius.
Projected returns pro-forma
-3.0% appreciation · 3.0% rent growth · sell at horizon
- IRR
- -16.5%
- Equity multiple
- 0.41×
- Total profit
- $-50,094
- Equity at exit
- $45,469
- IRR
- -8.1%
- Equity multiple
- 0.49×
- Total profit
- $-43,581
- Equity at exit
- $26,367
Cash invested: $85,386 (down + closing). Projections, not guarantees.
Landlord ↔ Tenant lean methodology
- Overall (STATE)
- 18 Strongly Tenant-Friendly
- State California
- 18 Strongly Tenant-Friendly · D+13
- County
- — inherits STATE
- City
- — inherits STATE
ZIP-level market 92587
- Active inventory
- 255
- Price-to-rent
- 7.9×
Monthly cashflow live
- Estimated rent
- $3,227 high interval (Pro) →
- Mortgage (P&I)
- −$1,599
- Tax from tax record
- −$87 /mo · $1,043/yr
- Insurance
- −$127
- HOA
- −$752
- Vacancy / Maint / Mgmt
- −$678
- Net cashflow
- $-16
Break-even live
Sensitivity live
| Price | -10% $157 | -5% $70 | +0% $-16 | +5% $-102 | +10% $-188 |
|---|---|---|---|---|---|
| Rent | -10% $-271 | -5% $-143 | +0% $-16 | +5% $112 | +10% $239 |
| Rate | -1.0pp $138 | -0.5pp $62 | base $-16 | +0.5pp $-95 | +1.0pp $-175 |
UW: 25.0% down · 7.5% · 30yr · 1.5% tax · 5.0% vac · 8.0% maint · 8.0% mgmt
Financing live
Cash to close
- Down payment
- $76,238
- Closing costs
- $9,148
- Reserves months
- —
- Total cash needed
- —
Loan-product check · same deal, 3 products live
Conventional
25% down · 7.5% · 30yr
- Down + closing
- —
- Monthly P&I
- —
- Monthly cashflow
- —
- DSCR
- —
- Eligible?
- —
Personal DTI + credit; lowest rate.
DSCR
20% down · 8.5% · 30yr
- Down + closing
- —
- Monthly P&I
- —
- Monthly cashflow
- —
- DSCR
- —
- Eligible?
- —
No personal income docs; deal must DSCR.
Hard money
10% down · 12.0% · 12mo
- Down + closing
- —
- Monthly P&I
- —
- Monthly cashflow
- —
- DSCR
- —
- Eligible?
- —
Short-term bridge; refi at stabilization.
Rent comps 12 comps
| Address | Beds | Baths | Sqft | Rent | $/sqft | DOM | Units | Dist |
|---|---|---|---|---|---|---|---|---|
| 30820 Early Round Dr Canyon Lake, CA | 3.0 | 2.0 | 1408 | $3,450 | $2.45 | 7d | 1 | 0.44mi |
| 22910 Pheasant Dr Canyon Lake, CA | 3.0 | 2.0 | 1535 | $3,500 | $2.28 | 26d | 1 | 0.46mi |
| 30505 Canyon Hills Rd #1502 Lake Elsinore, CA | 3.0 | 2.5 | 1565 | $3,500 | $2.24 | 20d | 1 | 0.57mi |
| 30505 Canyon Hills Rd Lake Elsinore, CA | 2.0 | 2.5 | 1274 | $2,725 | $2.14 | 45d | 2 | 0.59mi |
| 34281 Woodmont Lake Elsinore, CA | 3.0 | 2.5 | 1767 | $2,995 | $1.69 | 13d | 1 | 0.93mi |
| 22392 Canyon Club Dr Canyon Lake, CA | 2.0 | 2.0 | 1423 | $2,600 | $1.83 | 45d | 1 | 1.06mi |
| 24024 Roybal Way Lake Elsinore, CA | 3.0 | 2.5 | 1792 | $3,400 | $1.90 | 18d | 1 | 1.07mi |
| 24024 Savory Way Lake Elsinore, CA | 3.0 | 2.5 | 1805 | $3,000 | $1.66 | 45d | 1 | 1.17mi |
| 30345 Little Harbor Dr Canyon Lake, CA | 3.0 | 2.0 | 1611 | $3,945 | $2.45 | 0d | 1 | 1.18mi |
| 23685 Casa Bonita Ave Menifee, CA | 3.0 | 2.0 | 1277 | $2,795 | $2.19 | 0d | 1 | 1.29mi |
| 21963 Strawberry Ln Canyon Lake, CA | 3.0 | 3.0 | 1347 | $3,950 | $2.93 | 26d | 1 | 1.38mi |
| 30062 Big Range Rd Canyon Lake, CA | 1.0 | 1.0 | 1150 | $2,400 | $2.09 | 45d | 1 | 1.47mi |
HOA detail condo
- Monthly dues
- $752 · $9,024/yr
- Assessments
- None detected in remarks — confirm with the listing agent.
Listing history 12 events
-
2026-06-21days on market $304,950 Active 18 DOM
-
2026-06-18days on market $304,950 Active 15 DOM
-
2026-06-17days on market $304,950 Active 14 DOM
-
2026-06-16days on market $304,950 Active 13 DOM
-
2026-06-15days on market $304,950 Active 12 DOM
-
2026-06-13days on market $304,950 Active 10 DOM
-
2026-06-13days on market $304,950 Active 9 DOM
-
2026-06-09days on market $304,950 Active 6 DOM
-
2026-06-08days on market $304,950 Active 5 DOM
-
2026-06-07days on market $304,950 Active 4 DOM
-
2026-06-04remarks 686-char remark
-
2026-06-04$304,950 Active 1 DOM
ⓘ Source: listings_history table (triggers on properties + properties_extension) + one-shot
backfill from property_details.listing_events for pre-trigger history.
Tax reassessment forecast CA · Resets to sale price
- Current annual tax
- $1,043 · $87/mo
- Projected year-2 tax
- $2,318 · $193/mo
- Expected delta
- +$1,274/yr (+$106/mo · 122.1%)
ⓘ Screening estimate from a state-policy table — verify with the county assessor before closing.
Climate risk First Street
- Flood 1/10 Low FEMA zone X (unshaded) · 0% chance over 30 yrs
- Wildfire 6/10 Major
- Heat 6/10 Major 7 d/yr ≥104°F today · 18 d/yr by 30 yrs out
- Wind 1/10 Low
- Air quality 6/10 Major 9 unhealthy d/yr today · 11 by 30 yrs out
Nearby sold comps map
Loading sold comps map…
Walkable amenities ~0.75 mi
Loading nearby amenities…
Taxation est. · year 1
- Rental income
- $38,724
- − Mortgage interest
- −$17,082
- − Property taxes
- −$1,043
- − Insurance
- −$1,525
- − Repairs & maintenance
- −$3,098
- − Management
- −$3,098
- − HOA
- −$9,024
- − Depreciation
- −$8,871
- Taxable loss
- −$5,017
- Est. tax savings @ 24.0%
- +$1,204
- After-tax cash flow
- $1,014/yr
For passive investors: Depreciation is non-cash, so a rental often shows a tax loss while cash-flowing — sheltering income. Rental losses are passive: they offset passive income freely, and up to $25,000/yr can offset ordinary (W-2) income if you actively participate and your MAGI is under $100k (phasing out to $0 by $150k); unused losses carry forward. On sale, claimed depreciation is recaptured at up to 25%, and gains may owe capital-gains tax (a 1031 exchange can defer both). Figures are a year-1 estimate at your 24.0% rate — not tax advice; consult a CPA.
Schools (NCES district)
- District
- Lake Elsinore Unified
- NCES district ID
- 0600027
- Math proficiency
- 34% ▲ 5.00%
- Reading proficiency
- 49% ▲ 8.00%
- Median HH income
- $63,829
- Composite
- 37.01/100
- National rank
- #4518
- State rank
- #210 of 517 in CA
Livability — Canyon Lake
- Score
- 56/100
- State rank
- #825
- US rank
- #23089
Category grades
Schools grade is shown separately in the Schools card above.
Census & demographics
- Census place
- Canyon Lake, CA
- Population (ZIP)
- 18,382
Population outlook (Riverside County) Hauer SSP2
- Today (2025)
- 2,664,475 people
- By 2030
- 2,802,692 · +5.2%
- By 2040
- 3,050,904 · +14.5%
- By 2050
- 3,256,783 · +22.2%
- By 2075
- 3,655,058 · +37.2%
- By 2100
- 3,766,594 · +41.4%
Race, ethnicity, and origin ACS 2023
- Neighborhood character
- Diverse neighborhood (Simpson 0.60)
- Race & ethnicity
- White 55% Hispanic / Latino 30% Two or more races 15% Black 4% Asian 3% Native American 1%
- Hispanic origin (detail)
- Mexican 25% Puerto Rican 1%
- Common ancestry
- Lithuanian 2% Italian 1% Slovak 1%
- Foreign-born
- 10% · Canada, Vietnam
- Languages at home
- 80% English-only · Spanish 17% Other Asian/Pacific 1% Vietnamese 1%
Political lean MEDSL · Riverside
- 2024 margin
- Toss-up / Even · D 48.0% · R 49.3% · Other 2.6%
- 2008→2024 swing
- -3.6pp toward R · 2008: 2.3pp · 2024: -1.3pp
- All cycles
- 2024: R+1.3 2020: D+8.0 2016: D+4.3 2012: R+0.4 2008: D+2.3
Not yet ingested
- Civics
- —
Market trends
- HPI YoY
- ▼ -403.17%
- Current HPI
- 336.4209
- Rent YoY
- —
- Metro
- —
- State GDP YoY
- ▲ 3.21%
- F500 in state
- 116
Industry mix (Fortune 500 HQ in CA)
| Industry | F500 HQs | Revenue |
|---|---|---|
| Technology | 27 | $1,492B |
|
||
| Financial Services | 3 | $174B |
|
||
| Retail | 3 | $44B |
|
||
| Insurance | 3 | $26B |
|
||
| Media / Entertainment | 2 | $115B |
|
||
| Pharmaceuticals / Biotech | 2 | $62B |
|
||
Price history
+384.0% since first listed11 events — show timeline
- 2026-06-03 Listed $304,950 CRMLS
- 2009-06-23 Sold (MLS) $52,000 CRMLS
- 2009-06-06 Listing Removed — CRMLS
- 2009-05-28 Listed $55,500 CRMLS
- 2009-04-01 Listing Removed — CRMLS
- 2008-10-01 Listed $120,000 CRMLS
- 2005-07-08 Sold (MLS) $214,500 CRMLS
- 2005-07-07 Sold (Public Records) $214,500 Public Records
- 2005-04-07 Listed $225,900 CRMLS
- 2001-12-07 Sold (Public Records) $88,000 Public Records
- 1995-10-27 Sold (Public Records) $63,000 Public Records
Property tax history
-4.8%/yrLatest (2025): $1,043 · +3.2% YoY. Source: county tax records.
Cash-flow waterfall
monthlySold comps — $/sqft
last 12 mo · ≤1 miLoading sold comps…