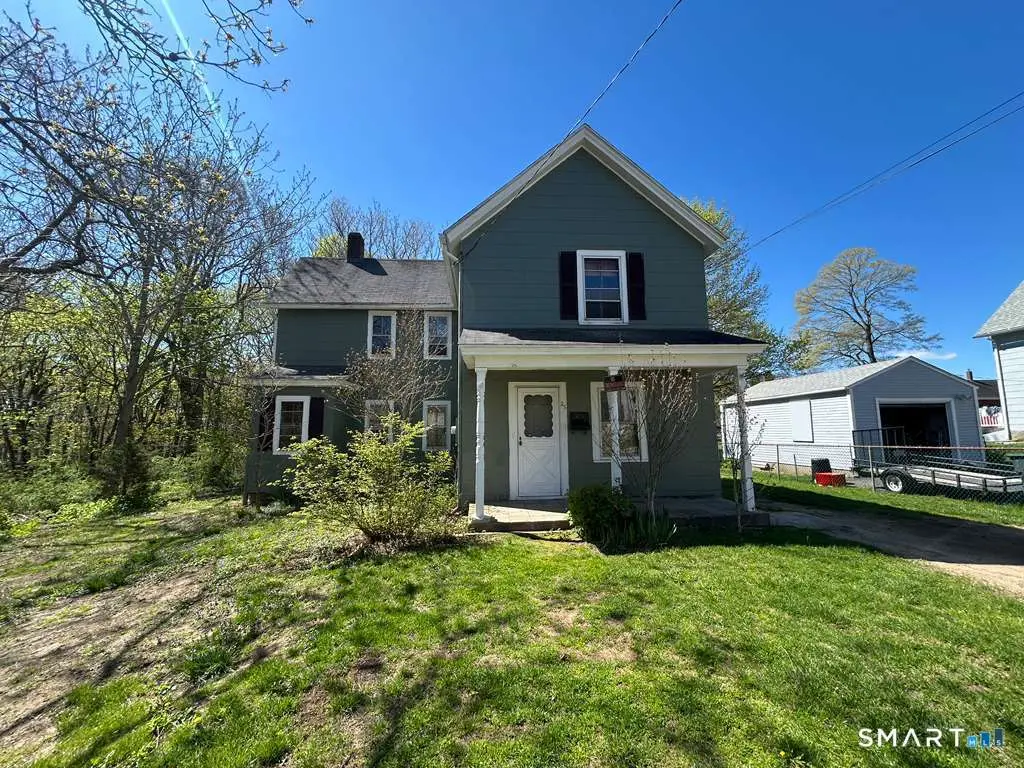
25 Morgan Ct · Groton, CT
Flood risk No data
- FEMA flood zone
- —
- Chance of flooding over 30 yrs
- —
- Est. flood insurance / yr
- —
Fire risk No data
- Est. fire insurance / yr
- —
Heat risk No data
- Hot days now (above threshold)
- —
- Hot days in 30 yrs
- —
Wind risk No data
- Chance of severe wind over 30 yrs
- —
Air-quality risk No data
- Unhealthy air days now
- —
- Unhealthy air days in 30 yrs
- —
Risk factors via First Street. Map © Google.
Why this score? — see what drove the C- grade
The composite is a weighted blend of 9 inputs, each scored 0–100. Each bar is that input's sub-score; the figure is the points it added to the 100-point composite (weight × sub-score).
- Cash flow +15.7/30.0
- ARV discount +15.0/15.0
- DSCR +4.8/10.0
- 1% rule +4.2/10.0
- Schools +3.6/10.0
- Livability +3.6/5.0
- Rent growth +3.4/5.0
- Condition / age +2.5/5.0
- Appreciation +0.0/10.0
$250,000
🖨 Deal sheet 📄 Offer letter ✓ Due diligence
Listing remarks
Tucked away at the end of a quiet cul-de-sac, offering a wonderful opportunity to own in a highly desirable coastal setting. Featuring a classic design and a functional layout, the home provides 1,367 square feet of comfortable living space, ideal for both everyday living and entertaining. The second floor hosts three well-sized bedrooms and a full bathroom, offering a practical and private retreat for a variety of lifestyles. Set on a generous and level 0.29-acre lot, the property provides ample outdoor space for recreation, gardening, or future enhancements to suit your vision. Additional highlights include a full basement and a walk-up attic, delivering abundant storage and potential for
Key facts
- 0.29-acre lot
- Coastal setting
- Full basement
Tags
Property features AI
Exterior
- Utilities: Public water connected; Public sewer connected
- Home design: Single-family home
- Construction: Frame construction; Stone foundation
- Exterior features: Level lot; Asphalt shingle roof; Asbestos exterior siding
Interior
- Bedrooms: 3 bedrooms
- Bathrooms: 1 full bathroom
- Heating & cooling: Hot water heating; Oil-fired heat with above-ground fuel tank; Domestic hot water system
- Interior features: Full unfinished basement with interior access and full hatchway; Has a walk-up attic; Total of 6 rooms
- Laundry & utility: Laundry located on the lower level
Neighborhood map
What this means for you Summary
Snapshot
- This is a 3-bed/1.0-bath single-family listed at $250k.
Deal economics
- At list price, monthly cash flow is $110 ($1k/yr) — positive.
- The deal already cash-flows at list — no discount required.
- To meet the 1% rule (rent ≥ 1% of price), the offer needs to be $229k (8.3% below list).
- Recommended offer: $229k (8.3% below list) — sets the bar for 1% rule.
- Cap rate 6.8% vs local median 3.8% in Groton — top-decile yield for the area; either an underpriced asset or a hidden risk that comps aren't pricing in. Stress-test before assuming the spread holds.
Location & tenants
- Location reads 71/100 on livability (#90 in CT) — a middle-class / working-renter tenant base. Strengths: crime A, housing A, health & safety A; Watch: employment C-, amenities F, commute F.
- Groton School District (suburban): math 32% / reading 50% proficiency, ranked #96 of 153 in CT (top 63%) — families likely to look elsewhere, expect single-tenant / working-renter base with shorter leases.
- Market conditions: Rents rising (+3.8%/yr); 92 active listings in the ZIP; 16 comparable units currently listed for rent nearby; rentals at typical pace (median 21d on market — plan ~3-4 weeks tenant-placement turnaround); 44% of comp listings sitting > 30 days — soft ceiling on asking rent; solid renter incomes; 487 units permitted in Southeastern Connecticut Planning Region in 2024 (244 in 5+ unit buildings).
- This rent runs 34% of the median local income ($82k/yr) — at the standard rent-burdened threshold; future hikes will face affordability resistance.
Forward outlook
- Local home prices are declining (-3.0%/yr); year-one equity from $2k of loan paydown is wiped out by about $8k of value loss. Plan a longer hold.
Negotiation context
- It's been on market 21 days — a 2% lower offer ($246k) is reasonable based on typical stale-listing flexibility.
- 4 sale attempts since 19y ago with the ask held roughly flat each time — persistent listings suggest the price (not the market) is what's stuck; bring a comps-based counter.
- Current owner paid $155k; list at $250k implies a 61% gain — meaningful room to come down on a strong offer.
Risks & watch-outs
- Watch-outs: built in 1948 — expect roof / HVAC / electrical / plumbing capex.
Questions for the listing agent
- Built in 1948 — when were the roof, HVAC, electrical panel, plumbing, and water heater last replaced?
- Is there a deadline driving the sale (1031 exchange, divorce, estate, relocation)? That informs how much negotiation room exists.
- What's the average days-on-market for RENTAL listings here right now (not sales)? A rising rental-DOM trend means longer vacancies and softer asking-rent achievability than the comps imply.
- What's the recent tenant-quality profile in this submarket — average credit score on applications, eviction rate, late-payment / NSF rate, and stable-employment percentage? A property-management company in the area should have these aggregated.
- How much new for-sale + rental construction is in the pipeline within 1–3 miles? Heavy new supply typically softens prices + rents 12–24 months out; constrained supply supports both.
Investment metrics
- 1% rule
- 0.92% ✗
- Cap rate
- 6.82%
- Cash-on-cash
- 1.89%
- DSCR
- 1.08
- GRM
- 9.1
CMA / ARV
- ARV (median comp)
- $369,805
- List price
- $250,000
- Delta
- -32.40%
- Verdict
- UNDERPRICED
- Comps
- 20 within 1.0 mi
Show comp detail 12 sales within ~0.75 mi
| Address | Dist | Beds/Ba | Sqft | Sold | Price | $/sf | Match |
|---|---|---|---|---|---|---|---|
| 170 Meridian St | 0.25mi | 2/1.0 (-1) | 1,372 (+0%) | 7mo | $175,000 | $128 | 77 |
| 78 Spicer Ave | 0.20mi | 3/1.0 | 1,488 (+9%) | 7mo | $365,000 | $245 | 71 |
| 25 School St | 0.28mi | 2/1.0 (-1) | 1,350 (-1%) | 15mo | $347,500 | $257 | 68 |
| 80 Mitchell St | 0.25mi | 4/1.5 (+1) | 1,406 (+3%) | 20mo | $330,000 | $235 | 60 |
| 112 Riverview Ave | 0.49mi | 3/1.5 | 1,456 (+6%) | 8mo | $385,000 | $264 | 58 |
| 243 Bridge St | 0.16mi | 3/2.0 | 1,184 (-13%) | 12mo | $265,000 | $224 | 56 |
| 62 Slocomb Ter | 0.29mi | 3/3.0 | 1,534 (+12%) | 5mo | $470,000 | $306 | 54 |
| 34 Fleming Ct | 0.50mi | 4/2.0 (+1) | 1,416 (+4%) | 10mo | $376,875 | $266 | 54 |
| 72 Baker Ave | 0.43mi | 3/1.5 | 1,464 (+7%) | 20mo | $360,000 | $246 | 49 |
| 202 Mitchell St | 0.48mi | 3/2.0 | 1,509 (+10%) | 14mo | $415,000 | $275 | 45 |
| 210 Baker Avenue Ext | 0.45mi | 3/2.5 | 1,542 (+13%) | 13mo | $440,000 | $285 | 41 |
| 157 Grove Ave | 0.57mi | 4/2.5 (+1) | 1,567 (+15%) | 15mo | $454,000 | $290 | 26 |
Match score weights: distance 35% · size 25% · config 20% · recency 20%. Top-matched comps best support the ARV.
Projected returns pro-forma
-3.0% appreciation · 3.75% rent growth · sell at horizon
- IRR
- -12.5%
- Equity multiple
- 0.55×
- Total profit
- $-31,739
- Equity at exit
- $37,276
- IRR
- -2.3%
- Equity multiple
- 0.84×
- Total profit
- $-11,275
- Equity at exit
- $21,615
Cash invested: $70,000 (down + closing). Projections, not guarantees.
Landlord ↔ Tenant lean methodology
- Overall (STATE)
- 27 Tenant-Leaning
- State Connecticut
- 27 Tenant-Leaning · D+7
- County
- — inherits STATE
- City
- — inherits STATE
ZIP-level market 06340
- Home prices YoY
- -27.9%
- Rents YoY
- 3.8%
- Active inventory
- 92
- Price-to-rent
- 9.1×
Monthly cashflow live
- Estimated rent
- $2,293 high interval (Pro) →
- Mortgage (P&I)
- −$1,311
- Tax from tax record
- −$286 /mo · $3,432/yr
- Insurance
- −$104
- HOA
- −$0
- Vacancy / Maint / Mgmt
- −$481
- Net cashflow
- $110
Break-even live
UW: 25.0% down · 7.5% · 30yr · 1.5% tax · 5.0% vac · 8.0% maint · 8.0% mgmt
Financing live
Cash to close
- Down payment
- $62,500
- Closing costs
- $7,500
- Reserves months
- —
- Total cash needed
- —
Loan-product check · same deal, 3 products live
Conventional
25% down · 7.5% · 30yr
- Down + closing
- —
- Monthly P&I
- —
- Monthly cashflow
- —
- DSCR
- —
- Eligible?
- —
Personal DTI + credit; lowest rate.
DSCR
20% down · 8.5% · 30yr
- Down + closing
- —
- Monthly P&I
- —
- Monthly cashflow
- —
- DSCR
- —
- Eligible?
- —
No personal income docs; deal must DSCR.
Hard money
10% down · 12.0% · 12mo
- Down + closing
- —
- Monthly P&I
- —
- Monthly cashflow
- —
- DSCR
- —
- Eligible?
- —
Short-term bridge; refi at stabilization.
Rent comps 16 comps
| Address | Beds | Baths | Sqft | Rent | $/sqft | DOM | Units | Dist |
|---|---|---|---|---|---|---|---|---|
| 278 Meridian St Groton, CT | 2.0 | 1.0 | 715 | $1,959 | $2.74 | 13d | 12 | 0.38mi |
| 15 Fieldside Dr Groton, CT | 2.0 | 1.0 | 875 | $1,900 | $2.17 | 44d | 1 | 0.51mi |
| 23 Fieldside Dr Groton, CT | 2.0 | 1.0 | 950 | $1,775 | $1.87 | 13d | 1 | 0.52mi |
| 1 Triton Sq Groton, CT | 2.0 | 1.0–2.0 | 911 | $3,460 | $3.80 | 13d | 40 | 0.59mi |
| 37 Hamilton Ave Groton, CT | 2.0 | 1.0 | 1300 | $2,200 | $1.69 | 21d | 1 | 0.73mi |
| 99 Gold Star Hwy Apt 106 Groton, CT | 2.0 | 1.0 | 882 | $2,212 | $2.51 | 44d | 1 | 0.80mi |
| 99 Gold Star Hwy Apt 82 Groton, CT | 2.0 | 1.0 | 882 | $2,217 | $2.51 | 44d | 1 | 0.80mi |
| 16 Benham Rd Unit C Groton, CT | 2.0 | 1.0 | 1600 | $2,500 | $1.56 | 13d | 1 | 0.84mi |
| 16 Benham Rd Unit D Groton, CT | 2.0 | 1.0 | 1350 | $2,400 | $1.78 | 21d | 1 | 0.84mi |
| 157 Green St Unit 2B New London, CT | 2.0 | 1.0 | 1134 | $2,650 | $2.34 | 44d | 1 | 1.09mi |
| 67 Wayne Rd Groton, CT | 2.0 | 1.5 | 1405 | $2,250 | $1.60 | 44d | 1 | 1.13mi |
| 28 Reed St #1 New London, CT | 2.0 | 1.5 | 1131 | $1,820 | $1.61 | 21d | 1 | 1.31mi |
| 16 Grove St New London, CT | 2.0 | 1.0 | 960 | $1,500 | $1.56 | 44d | 1 | 1.35mi |
| 11 Ledgewood Rd Groton, CT | 1.0–3.0 | 1.0–3.0 | 1247 | $7,351 | $5.89 | 1d | 1 | 1.36mi |
| 120 Broad St New London, CT | 2.0 | 1.0–3.0 | 977 | $2,500 | $2.56 | 21d | 7 | 1.36mi |
| 13 Thompson Ct New London, CT | 3.0 | 1.0 | 1000 | $1,900 | $1.90 | 44d | 1 | 1.41mi |
Listing history 9 events
-
2026-05-15status Under Contract 1056-char remark
-
2026-04-23$250,000 Active 1056-char remark
-
2026-03-25historical
-
2026-02-27$240,000 Active
-
2025-03-18historical
-
2025-02-19$175,000 Active
-
2007-10-11soldstatus $155,000
-
2007-10-05soldstatus $160,000
-
2007-07-10$175,000
ⓘ Source: listings_history table (triggers on properties + properties_extension) + one-shot
backfill from property_details.listing_events for pre-trigger history.
Tax reassessment forecast CT · Partial reset (capped growth)
- Current annual tax
- $3,432 · $286/mo
- Projected year-2 tax
- $4,391 · $366/mo
- Expected delta
- +$959/yr (+$80/mo · 27.9%)
ⓘ Screening estimate from a state-policy table — verify with the county assessor before closing.
Nearby sold comps map
Loading sold comps map…
Walkable amenities ~0.75 mi
Loading nearby amenities…
Taxation est. · year 1
- Rental income
- $27,513
- − Mortgage interest
- −$14,004
- − Property taxes
- −$3,432
- − Insurance
- −$1,250
- − Repairs & maintenance
- −$2,201
- − Management
- −$2,201
- − Depreciation
- −$7,273
- Taxable loss
- −$2,848
- Est. tax savings @ 24.0%
- +$683
- After-tax cash flow
- $2,004/yr
For passive investors: Depreciation is non-cash, so a rental often shows a tax loss while cash-flowing — sheltering income. Rental losses are passive: they offset passive income freely, and up to $25,000/yr can offset ordinary (W-2) income if you actively participate and your MAGI is under $100k (phasing out to $0 by $150k); unused losses carry forward. On sale, claimed depreciation is recaptured at up to 25%, and gains may owe capital-gains tax (a 1031 exchange can defer both). Figures are a year-1 estimate at your 24.0% rate — not tax advice; consult a CPA.
Schools (NCES district)
- District
- Groton School District
- NCES district ID
- 0901770
- Math proficiency
- 32% ▼ -16.00%
- Reading proficiency
- 50% ▼ -10.00%
- Median HH income
- $60,709
- Composite
- 36.28/100
- National rank
- #4702
- State rank
- #96 of 153 in CT
Livability — Groton
- Score
- 71/100
- State rank
- #90
- US rank
- #7096
Category grades
Schools grade is shown separately in the Schools card above.
Census & demographics
- Census place
- Groton, CT
- County
- New London County · 147,197 people
- City population
- 42,036
- Metro
- Norwich-New London, CT
- Population (ZIP)
- 29,863
- Household income
- $81,792
- Rent vs Own
- Severe rent burden
- 1710.0
Population outlook (Southeastern Connecticut County) Hauer SSP2
- By 2040
- 293,442
Race, ethnicity, and origin ACS 2023
- Neighborhood character
- Predominantly White (66%)
- Race & ethnicity
- White 66% Hispanic / Latino 15% Two or more races 11% Asian 7% Black 6%
- Hispanic origin (detail)
- Mexican 3% Puerto Rican 7% Dominican 1%
- Common ancestry
- Romanian 5% Lithuanian 4% Slovak 3%
- Foreign-born
- 9% · Canada, Vietnam, China
- Languages at home
- 87% English-only · Spanish 6% Tagalog/Filipino 2% Other Indo-European 2%
Political lean MEDSL · Southeastern Connecticut
- 2024 margin
- D (+13.0) · D 55.6% · R 42.6% · Other 1.8%
- All cycles
- 2024: D+13.0
Not yet ingested
- Civics
- —
Market trends
- HPI YoY
- ▼ -97.61%
- Current HPI
- 252.846
- Rent YoY
- ▲ 3.75%
- Metro
- Norwich-New London, CT
- State GDP YoY
- ▲ 1.06%
- F500 in state
- 38
Industry mix (Fortune 500 HQ in CT)
| Industry | F500 HQs | Revenue |
|---|---|---|
| Industrial Machinery | 4 | $38B |
|
||
| Insurance | 3 | $71B |
|
||
| Financial Services | 2 | $25B |
|
||
| Transportation / Logistics | 2 | $18B |
|
||
| Healthcare | 1 | $247B |
|
||
| Telecommunications | 1 | $55B |
|
||
Price history
+42.9% since first listed9 events — show timeline
- 2026-05-15 Pending — Smart MLS
- 2026-04-23 Listed $250,000 Smart MLS
- 2026-03-25 Listing Removed — Smart MLS
- 2026-02-27 Listed $240,000 Smart MLS
- 2025-03-18 Listing Removed — Smart MLS
- 2025-02-19 Listed $175,000 Smart MLS
- 2007-10-11 Sold (MLS) $155,000 Smart MLS
- 2007-10-05 Sold (Public Records) $160,000 Public Records
- 2007-07-10 Listed $175,000 Smart MLS
Property tax history
+2.0%/yrLatest (2022): $3,432 · +6.8% YoY. Source: county tax records.
Cash-flow waterfall
monthlySold comps — $/sqft
last 12 mo · ≤1 miLoading sold comps…