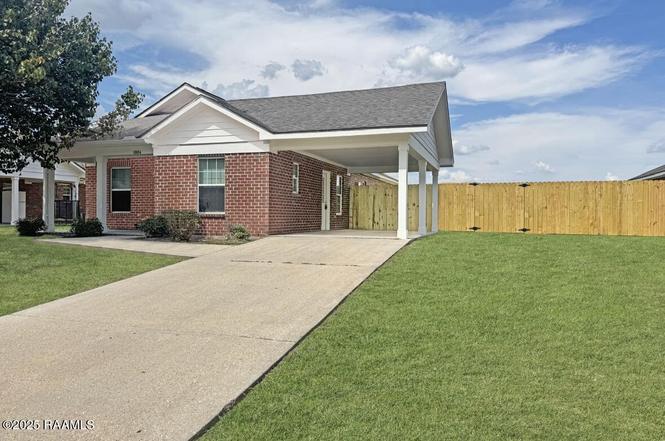
907 West End Dr · New Iberia, LA
Flood risk 1/10 · Minimal
- FEMA flood zone
- X (unshaded)
- Chance of flooding over 30 yrs
- 0.0%
- Est. flood insurance / yr
- $507 – $1,088
Fire risk 1/10 · Minimal
- Est. fire insurance / yr
- $1,269 – $2,357
Heat risk 9/10 · Severe
- Hot days now (above 109°F)
- 7 days/yr
- Hot days in 30 yrs
- 22 days/yr
Wind risk 9/10 · Severe
- Chance of severe wind over 30 yrs
- 99.0%
Air-quality risk 2/10 · Minimal
- Unhealthy air days now
- 1 days/yr
- Unhealthy air days in 30 yrs
- 1 days/yr
Risk factors via First Street. Map © Google.
Why this score? — see what drove the C+ grade
The composite is a weighted blend of 9 inputs, each scored 0–100. Each bar is that input's sub-score; the figure is the points it added to the 100-point composite (weight × sub-score).
- Cash flow +22.5/30.0
- ARV discount +12.8/15.0
- DSCR +7.2/10.0
- 1% rule +6.6/10.0
- Livability +3.7/5.0
- Schools +3.2/10.0
- Rent growth +2.5/5.0
- Condition / age +2.5/5.0
- Appreciation +0.0/10.0
$90,000
🖨 Deal sheet 📄 Offer letter ✓ Due diligence
Listing remarks
Fence and ALL appliances included!! Welcome Home! This affordable 3-bedroom, 2-bathroom brick home is located in a peaceful subdivision, offering the perfect blend of comfort and convenience. Enjoy the covered carport for 1 car, and a slab foundation ensuring a stable and solid living space. Step inside to find a galley style kitchen featuring all appliances, ample counterspace perfect for meal preparation and an abundance of cabinets for extra storage. The dining is located off the kitchen and seamlessly flows into the spacious living room. Down the hall, you'll find two guest bedrooms and a guest bathroom, a separate laundry closet (washer and dryer included!) and the primary bedroom. The
Key facts
- Slab foundation
- Covered carport
- Ample counterspace
Tags
Property features AI
Finance
- HOA & community: Association with management; Association fee $55 monthly
Exterior
- Parking: Carport (1 covered space, total 1 parking space)
- Utilities: Community sewer; Electric service by CLECO
- Home design: Single family residence; City street frontage; Paved road frontage
- Construction: Brick veneer/brick construction; Composition roof
- Exterior features: Exterior lighting; Covered patio/porch
Interior
- Kitchen: Dishwasher; Refrigerator
- Flooring: Vinyl plank flooring
- Bathrooms: 2 full bathrooms
- Heating & cooling: Central heating (electric); Central air conditioning
- Interior features: Walk-in closets; Cultured marble counters; Formica counters; Window treatments
- Laundry & utility: Washer hookup; Electric dryer hookup; Washer; Dryer
Neighborhood map
What this means for you Summary
Snapshot
- This is a 3-bed/2.0-bath single-family listed at $90k.
Deal economics
- At list price, monthly cash flow is $151 ($2k/yr) — positive.
- The deal already cash-flows at list — no discount required.
- Meets the 1% rule at list price ($1k rent vs $90k).
- Recommended offer: $85k (6.0% below list) — sets the bar for market timing.
- Cap rate 8.3% vs local median 5.8% in New Iberia — top-decile yield for the area; either an underpriced asset or a hidden risk that comps aren't pricing in. Stress-test before assuming the spread holds.
Location & tenants
- Location reads 73/100 on livability (#33 in LA) — a middle-class / working-renter tenant base. Strengths: cost of living A+, housing A+, health & safety A+; Watch: commute D+, crime F, employment F.
- Iberia Parish (other): math 32% / reading 43% proficiency, ranked #27 of 98 in LA (top 28%) — families likely to look elsewhere, expect single-tenant / working-renter base with shorter leases; 66% free/reduced lunch — lower-income household profile, screen leases tightly.
- Zoned schools: Park Elementary School (math 22% / reading 32%, grade F, #359 of 646 statewide, top 57%, 275 students, 88% FRL); Anderson Middle School (math 19% / reading 38%, grade F, #119 of 218 statewide, top 57%, 399 students, 86% FRL); Westgate High School (math 17% / reading 37%, grade F, #136 of 265 statewide, top 55%, 993 students, 77% FRL) — zoned schools average 84% FRL vs 66% district-wide (18 pts higher); higher-poverty schools than district average — tighter screening recommended.
- Market conditions: 237 active listings in the ZIP; 3 comparable units currently listed for rent nearby; rentals lingering (median 44d on market — plan ~5-8 weeks vacancy on turnover, expect pricing pressure); 67% of comp listings sitting > 30 days — soft ceiling on asking rent; 94 units permitted in Iberia Parish in 2024 (0 in 5+ unit buildings).
Forward outlook
- Local home prices are declining (-3.0%/yr); year-one equity from $622 of loan paydown is wiped out by about $3k of value loss. Plan a longer hold.
- Iberia County population projected to shrink 4% by 2050 — rents likely to lag national; underwrite the cash flow, not the appreciation.
Negotiation context
- It's been on market 75 days — a 6% lower offer ($85k) is reasonable based on typical stale-listing flexibility.
- 2 sale attempts with the ask held roughly flat each time — persistent listings suggest the price (not the market) is what's stuck; bring a comps-based counter.
Risks & watch-outs
- Climate carrying-cost: severe wind risk, 99% chance of damaging wind over 30y; extreme-heat days projected 7→22/yr by 2055 (HVAC capex compounding) — expect insurance premiums to compound above CPI over the hold.
Questions for the listing agent
- It's been on market 75 days. Have you received any prior offers? Is the seller open to a 6% concession, seller financing, or rate buy-down credit?
- What does the HOA fee cover, when was the last increase, and are there any pending special assessments or reserve-fund shortfalls?
- Why hasn't it sold? Are there any deal-killer items the seller is aware of (foundation, flood, title, zoning, code violations)?
- Is there a deadline driving the sale (1031 exchange, divorce, estate, relocation)? That informs how much negotiation room exists.
- Schools are B-rated — typically a magnet for longer-tenancy family renters. What's the average tenant stay here, and is there a school-zone premium baked into asking?
- Crime grade is F in this area — have there been break-ins, vandalism, or insurance claims at this property in the last 3 years? What carrier currently insures it and at what premium?
- What's the average days-on-market for RENTAL listings here right now (not sales)? A rising rental-DOM trend means longer vacancies and softer asking-rent achievability than the comps imply.
- What's the recent tenant-quality profile in this submarket — average credit score on applications, eviction rate, late-payment / NSF rate, and stable-employment percentage? A property-management company in the area should have these aggregated.
- How much new for-sale + rental construction is in the pipeline within 1–3 miles? Heavy new supply typically softens prices + rents 12–24 months out; constrained supply supports both.
Investment metrics
- 1% rule
- 1.16% ✓
- Cap rate
- 8.30%
- Cash-on-cash
- 7.19%
- DSCR
- 1.32
- GRM
- 7.2
CMA / ARV
- ARV (on-the-fly)
- $102,000
- Comps found
- 7
Show comp detail 7 sales within ~0.75 mi
| Address | Dist | Beds/Ba | Sqft | Sold | Price | $/sf | Match |
|---|---|---|---|---|---|---|---|
| 1005 West End Dr | 0.02mi | 3/2.0 | 1,384 (+2%) | 9mo | $104,000 | $75 | 89 |
| 903 West End Dr | 0.18mi | 3/2.0 | 1,360 (0%) | 7mo | $95,600 | $70 | 86 |
| 1211 Lombard St | 0.34mi | 3/2.0 | 1,384 (+2%) | 11mo | $104,000 | $75 | 72 |
| 911 West End Dr | 0.00mi | 4/2.0 (+1) | 1,500 (+10%) | 7mo | $105,000 | $70 | 72 |
| 905 West End Dr | 0.18mi | 4/2.0 (+1) | 1,500 (+10%) | 0mo | $110,000 | $73 | 69 |
| 1000 Verna St | 0.46mi | 3/2.0 | 1,305 (-4%) | 15mo | $176,000 | $135 | 59 |
| 1519 Anderson St | 0.44mi | 3/2.0 | 1,515 (+11%) | 12mo | $187,990 | $124 | 50 |
Match score weights: distance 35% · size 25% · config 20% · recency 20%. Top-matched comps best support the ARV.
Projected returns pro-forma
-3.0% appreciation · 3.0% rent growth · sell at horizon
- IRR
- -5.2%
- Equity multiple
- 0.80×
- Total profit
- $-4,923
- Equity at exit
- $13,419
- IRR
- 4.5%
- Equity multiple
- 1.33×
- Total profit
- $8,290
- Equity at exit
- $7,782
Cash invested: $25,200 (down + closing). Projections, not guarantees.
Landlord ↔ Tenant lean methodology
- Overall (STATE)
- 90 Strongly Landlord-Friendly
- State Louisiana
- 90 Strongly Landlord-Friendly · R+12
- County
- — inherits STATE
- City
- — inherits STATE
ZIP-level market 70560
- Home prices YoY
- -29.8%
- Active inventory
- 237
- Price-to-rent
- 7.2×
Monthly cashflow live
- Estimated rent
- $1,048 medium interval (Pro) →
- Mortgage (P&I)
- −$472
- Tax est. 1.5%
- −$112 /mo · $1,350/yr
- Insurance
- −$38
- HOA
- −$55
- Vacancy / Maint / Mgmt
- −$220
- Net cashflow
- $151
Break-even live
UW: 25.0% down · 7.5% · 30yr · 1.5% tax · 5.0% vac · 8.0% maint · 8.0% mgmt
Financing live
Cash to close
- Down payment
- $22,500
- Closing costs
- $2,700
- Reserves months
- —
- Total cash needed
- —
Loan-product check · same deal, 3 products live
Conventional
25% down · 7.5% · 30yr
- Down + closing
- —
- Monthly P&I
- —
- Monthly cashflow
- —
- DSCR
- —
- Eligible?
- —
Personal DTI + credit; lowest rate.
DSCR
20% down · 8.5% · 30yr
- Down + closing
- —
- Monthly P&I
- —
- Monthly cashflow
- —
- DSCR
- —
- Eligible?
- —
No personal income docs; deal must DSCR.
Hard money
10% down · 12.0% · 12mo
- Down + closing
- —
- Monthly P&I
- —
- Monthly cashflow
- —
- DSCR
- —
- Eligible?
- —
Short-term bridge; refi at stabilization.
Rent comps 3 comps
| Address | Beds | Baths | Sqft | Rent | $/sqft | DOM | Units | Dist |
|---|---|---|---|---|---|---|---|---|
| 405 Anderson St New Iberia, LA | 2.0 | 1.0 | 950 | $650 | $0.68 | 43d | 1 | 0.62mi |
| 2118 W Old Spanish Trl New Iberia, LA | 1.0–3.0 | 1.0–2.0 | 1013 | $1,708 | $1.69 | 13d | 23 | 1.00mi |
| 212 Hacker St New Iberia, LA | 2.0 | 1.0 | 1000 | $950 | $0.95 | 43d | 1 | 1.49mi |
HOA detail
- Monthly dues
- $55 · $660/yr
Listing history 19 events
-
2026-06-18days on market $90,000 Active 75 DOM
-
2026-06-17days on market $90,000 Active 74 DOM
-
2026-06-16days on market $90,000 Active 73 DOM
-
2026-06-15days on market $90,000 Active 72 DOM
-
2026-06-14days on market $90,000 Active 70 DOM
-
2026-06-13days on market $90,000 Active 69 DOM
-
2026-06-10days on market $90,000 Active 67 DOM
-
2026-06-09days on market $90,000 Active 66 DOM
-
2026-06-08days on market $90,000 Active 65 DOM
-
2026-06-07days on market $90,000 Active 64 DOM
-
2026-06-05days on market $90,000 Active 61 DOM
-
2026-06-03days on market $90,000 Active 60 DOM
-
2026-06-02days on market $90,000 Active 59 DOM
-
2026-06-01days on market $90,000 Active 58 DOM
-
2026-05-31days on market $90,000 Active 57 DOM
-
2026-05-30days on market $90,000 Active 56 DOM
-
2026-05-24status Active
-
2026-03-03status Pending
-
2026-01-12$90,000 Active
ⓘ Source: listings_history table (triggers on properties + properties_extension) + one-shot
backfill from property_details.listing_events for pre-trigger history.
Climate risk First Street
- Flood 1/10 Low FEMA zone X (unshaded) · 0% chance over 30 yrs
- Wildfire 1/10 Low
- Heat 9/10 Extreme 7 d/yr ≥109°F today · 22 d/yr by 30 yrs out
- Wind 9/10 Extreme 99% chance of damaging wind over 30 yrs
- Air quality 2/10 Low 1 unhealthy d/yr today · 1 by 30 yrs out
Nearby sold comps map
Loading sold comps map…
Walkable amenities ~0.75 mi
Loading nearby amenities…
Taxation est. · year 1
- Rental income
- $12,575
- − Mortgage interest
- −$5,041
- − Property taxes
- −$1,350
- − Insurance
- −$450
- − Repairs & maintenance
- −$1,006
- − Management
- −$1,006
- − HOA
- −$660
- − Depreciation
- −$2,618
- Taxable income
- $444
- Est. tax owed @ 24.0%
- −$106
- After-tax cash flow
- $1,704/yr
For passive investors: Depreciation is non-cash, so a rental often shows a tax loss while cash-flowing — sheltering income. Rental losses are passive: they offset passive income freely, and up to $25,000/yr can offset ordinary (W-2) income if you actively participate and your MAGI is under $100k (phasing out to $0 by $150k); unused losses carry forward. On sale, claimed depreciation is recaptured at up to 25%, and gains may owe capital-gains tax (a 1031 exchange can defer both). Figures are a year-1 estimate at your 24.0% rate — not tax advice; consult a CPA.
Schools (NCES district)
- District
- Iberia Parish
- NCES district ID
- 2200720
- Math proficiency
- 32% ▼ -43.00%
- Reading proficiency
- 43% ▼ -35.00%
- Median HH income
- $43,289
- Composite
- 31.74/100
- National rank
- #5904
- State rank
- #27 of 98 in LA
Livability — New Iberia
- Score
- 73/100
- State rank
- #33
- US rank
- #5376
Category grades
Schools grade is shown separately in the Schools card above.
Census & demographics
- Population (ZIP)
- 37,589
Population outlook (Iberia County) Hauer SSP2
- Today (2025)
- 74,632 people
- By 2030
- 74,368 · -0.4%
- By 2040
- 73,223 · -1.9%
- By 2050
- 71,728 · -3.9%
- By 2075
- 69,028 · -7.5%
- By 2100
- 65,018 · -12.9%
Race, ethnicity, and origin ACS 2023
- Neighborhood character
- Diverse neighborhood (Simpson 0.61)
- Race & ethnicity
- White 52% Black 35% Two or more races 8% Hispanic / Latino 6% Asian 2%
- Hispanic origin (detail)
- Mexican 2%
- Common ancestry
- Lithuanian 11% Italian 1% Serbian 1%
- Foreign-born
- 3% · Canada
- Languages at home
- 93% English-only · French/Haitian/Cajun 3% Spanish 2% Other Asian/Pacific 1%
Political lean MEDSL · Iberia
- 2024 margin
- Solid R (+34.1) · D 32.4% · R 66.5% · Other 1.1%
- 2008→2024 swing
- -11.1pp toward R · 2008: -23.0pp · 2024: -34.1pp
- All cycles
- 2024: R+34.1 2020: R+31.2 2016: R+31.4 2012: R+26.2 2008: R+23.0
Not yet ingested
- Civics
- —
Market trends
- HPI YoY
- ▼ -65.82%
- Current HPI
- 154.9018
- Rent YoY
- —
- Metro
- —
- State GDP YoY
- ▲ 3.29%
- F500 in state
- 10
Industry mix (Fortune 500 HQ in LA)
| Industry | F500 HQs | Revenue |
|---|---|---|
| Telecommunications | 2 | $23B |
|
||
| Utilities | 1 | $12B |
|
||
| Wholesale / Distribution | 1 | $5B |
|
||
| Advertising | 1 | $2B |
|
||
Price history
3 events — show timeline
- 2026-05-24 Relisted — AcadianaMLS
- 2026-03-03 Pending — AcadianaMLS
- 2026-01-12 Listed $90,000 AcadianaMLS
Cash-flow waterfall
monthlySold comps — $/sqft
last 12 mo · ≤1 miLoading sold comps…