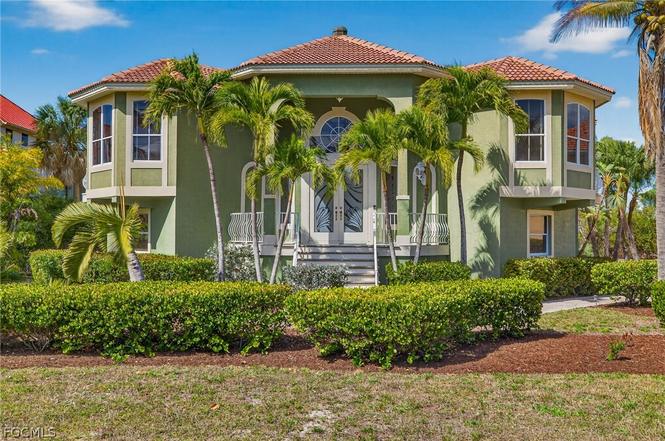
779 Pyrula Ave · Sanibel, FL
Flood risk 9/10 · Severe
- FEMA flood zone
- AE
- Chance of flooding over 30 yrs
- 0.99%
- Est. flood insurance / yr
- $1,737 – $8,500
Fire risk 1/10 · Minimal
- Est. fire insurance / yr
- $947 – $1,759
Heat risk 10/10 · Severe
- Hot days now (above 112°F)
- 7 days/yr
- Hot days in 30 yrs
- 26 days/yr
Wind risk 10/10 · Severe
- Chance of severe wind over 30 yrs
- 99.0%
Air-quality risk 2/10 · Minimal
- Unhealthy air days now
- 1 days/yr
- Unhealthy air days in 30 yrs
- 1 days/yr
Risk factors via First Street. Map © Google.
Why this score? — see what drove the D+ grade
The composite is a weighted blend of 9 inputs, each scored 0–100. Each bar is that input's sub-score; the figure is the points it added to the 100-point composite (weight × sub-score).
- Cash flow +14.6/30.0
- ARV discount +13.7/15.0
- DSCR +4.5/10.0
- 1% rule +4.1/10.0
- Schools +4.1/10.0
- Livability +3.4/5.0
- Rent growth +2.5/5.0
- Condition / age +2.5/5.0
- Appreciation +0.0/10.0
$1,300,000
🖨 Deal sheet (PDF) 📄 Offer letter ✓ Due diligence
Listing remarks MLS
Great opportunity to live on Sanibel Island. So many great features: High ceilings, crown molding, tile and wood flooring, cherry cabinetry with granite countertops, large tub in master bath and large lanai overlooking pool. Bank owned foreclosure being sold as-is and priced to sell.
Key facts
- Deeded beach access
- Large private pool
- Golf course views
Tags
Property features AI
Finance
- Financial info: Pets allowed
- HOA & community: Association offers beach rights and beach access; Annual association fee of $50; Community of 224 units; Non-gated community
Exterior
- Parking: Attached garage; 2 covered garage spaces; Driveway; Paved parking; Garage door opener
- Security: Smoke detectors
- Utilities: Public water; Public sewer; Cable available; High-speed internet available; Municipal irrigation
- Home design: Single-story; Resale property; Faces south; Has view
- Construction: Tile roof; Block, concrete and stucco construction
- Exterior features: Patio; Balcony; Lanai; Porch; Screened porch; No additional exterior features listed; On golf course; Oversized lot; North exposure; Paved road
Interior
- Kitchen: Built-in oven; Double oven; Electric cooktop; Dishwasher; Disposal; Icemaker; Microwave; Refrigerator (with ice maker)
- Bedrooms: Includes guest quarters; Den (additional room type)
- Flooring: Carpet; Tile; Vinyl
- Bathrooms: 2 full bathrooms; 1 half bathroom
- Heating & cooling: Central heating (electric); Central air conditioning (electric); Ceiling fans
- Interior features: Wet bar; Breakfast bar; Bathtub; Tray ceilings; Dual sinks; Entrance foyer; French doors/atrium doors; High ceilings; Kitchen island; Living/dining room; Separate shower; Cable TV; Walk-in closets; Split bedrooms; Single-hung windows; Furnished
- Laundry & utility: Washer; Dryer; Laundry inside
Neighborhood map
What this means for you Summary
Snapshot
- This is a 4-bed/3.0-bath single-family listed at $1.30M.
Deal economics
- At list price, monthly cash flow is $-110 ($-1k/yr) — negative.
- To cash-flow at today's rent, offer at most $1.28M (1.5% below list).
- To meet the 1% rule (rent ≥ 1% of price), the offer needs to be $1.19M (8.8% below list).
- Recommended offer: $1.19M (8.8% below list) — sets the bar for 1% rule.
- Cap rate 6.6% vs local median 3.8% in Sanibel — top-decile yield for the area; either an underpriced asset or a hidden risk that comps aren't pricing in. Stress-test before assuming the spread holds.
Location & tenants
- Location reads 67/100 on livability (#541 in FL) — a middle-class / working-renter tenant base. Strengths: crime A+, employment A+; Watch: housing D+, amenities F, commute F.
- Lee (suburban): math 47% / reading 50% proficiency, ranked #42 of 73 in FL (top 58%) — families likely to look elsewhere, expect single-tenant / working-renter base with shorter leases.
- Zoned schools: The Sanibel School (math 92% / reading 92%, grade A+, #5 of 2,144 statewide, top 0%, 289 students, 12% FRL); South Fort Myers High School (math 23% / reading 30%, grade F, #489 of 667 statewide, top 74%, 1,917 students, 50% FRL) — zoned schools average 31% FRL vs 57% district-wide (26 pts lower); this property's tenant base skews higher-income than the district average.
- Market conditions: 526 active listings in the ZIP; 2 comparable units currently listed for rent nearby; 15,411 units permitted in Lee County in 2024 (4,686 in 5+ unit buildings).
Forward outlook
- Local home prices are declining (-3.0%/yr); year-one equity from $9k of loan paydown is wiped out by about $39k of value loss. Plan a longer hold.
- Lee County population projected at +44% by 2050 — long-run rental-demand tailwind backs the buy-and-hold thesis.
Negotiation context
- It's been on market 50 days — a 3% lower offer ($1.26M) is reasonable based on typical stale-listing flexibility.
- 2 sale attempts since 27y ago with the ask held roughly flat each time — persistent listings suggest the price (not the market) is what's stuck; bring a comps-based counter.
- Current owner paid $850k; list at $1.30M implies a 53% gain — meaningful room to come down on a strong offer.
Risks & watch-outs
- Watch-outs: flood insurance adds $427/mo.
- Climate carrying-cost: in FEMA flood zone AE (mandatory federal flood insurance); severe wind risk, 99% chance of damaging wind over 30y; extreme-heat days projected 7→26/yr by 2055 (HVAC capex compounding) — expect insurance premiums to compound above CPI over the hold.
Questions for the listing agent
- What do current leases actually rent for vs. the listed asking? Can we see a recent rent roll and the last 12 months of T-12 income?
- It's been on market 50 days. Have you received any prior offers? Is the seller open to a 9% concession, seller financing, or rate buy-down credit?
- What's the actual annual flood-insurance premium (NFIP or private), and is the property in a SFHA with mandatory coverage?
- What does the HOA fee cover, when was the last increase, and are there any pending special assessments or reserve-fund shortfalls?
- Is there a deadline driving the sale (1031 exchange, divorce, estate, relocation)? That informs how much negotiation room exists.
- Schools are A-rated — typically a magnet for longer-tenancy family renters. What's the average tenant stay here, and is there a school-zone premium baked into asking?
- The area grade is low — what's the realistic commute time and amenity access for the typical tenant pool here? Any planned neighborhood developments (good or bad) we should know about?
- What's the average days-on-market for RENTAL listings here right now (not sales)? A rising rental-DOM trend means longer vacancies and softer asking-rent achievability than the comps imply.
- What's the recent tenant-quality profile in this submarket — average credit score on applications, eviction rate, late-payment / NSF rate, and stable-employment percentage? A property-management company in the area should have these aggregated.
- How much new for-sale + rental construction is in the pipeline within 1–3 miles? Heavy new supply typically softens prices + rents 12–24 months out; constrained supply supports both.
Investment metrics
- 1% rule
- 0.91% ✗
- Cap rate
- 6.59%
- Cash-on-cash
- 1.04%
- DSCR
- 1.05
- GRM
- 9.1
CMA / ARV
- ARV (on-the-fly)
- $1,507,550
- Comps found
- 1
Show comp detail 1 sale within ~0.75 mi
| Address | Dist | Beds/Ba | Sqft | Sold | Price | $/sf | Match |
|---|---|---|---|---|---|---|---|
| 788 Birdie View Pt | 0.17mi | 3/3.0 (-1) | 2,909 (+6%) | 4mo | $1,600,000 | $550 | 74 |
Match score weights: distance 35% · size 25% · config 20% · recency 20%. Top-matched comps best support the ARV.
Projected returns pro-forma
-3.0% appreciation · 3.0% rent growth · sell at horizon
- IRR
- -16.9%
- Equity multiple
- 0.40×
- Total profit
- $-217,166
- Equity at exit
- $193,834
- IRR
- -8.6%
- Equity multiple
- 0.46×
- Total profit
- $-196,155
- Equity at exit
- $112,400
Cash invested: $364,000 (down + closing). Projections, not guarantees.
Landlord ↔ Tenant lean methodology
- Overall (STATE)
- 87 Strongly Landlord-Friendly
- State Florida
- 87 Strongly Landlord-Friendly · R+3
- County
- — inherits STATE
- City
- — inherits STATE
ZIP-level market 33957
- Home prices YoY
- -15.7%
- Active inventory
- 526
- Price-to-rent
- 9.1×
Monthly cashflow live
- Estimated rent
- $11,854 medium interval (Pro) →
- Mortgage (P&I)
- −$6,817
- Tax from tax record
- −$1,685 /mo · $20,217/yr
- Insurance
- −$542
- Flood insurance flood zone
- −$427 /mo · $5,118/yr
- HOA
- −$4
- Vacancy / Maint / Mgmt
- −$2,489
- Net cashflow
- $-110
Break-even live
Sensitivity live
| Price | -10% $626 | -5% $258 | +0% $-110 | +5% $-478 | +10% $-846 |
|---|---|---|---|---|---|
| Rent | -10% $-1,046 | -5% $-578 | +0% $-110 | +5% $358 | +10% $827 |
| Rate | -1.0pp $545 | -0.5pp $221 | base $-110 | +0.5pp $-447 | +1.0pp $-789 |
UW: 25.0% down · 7.5% · 30yr · 1.5% tax · 5.0% vac · 8.0% maint · 8.0% mgmt
Financing live
Cash to close
- Down payment
- $325,000
- Closing costs
- $39,000
- Reserves months
- —
- Total cash needed
- —
Loan-product check · same deal, 3 products live
Conventional
25% down · 7.5% · 30yr
- Down + closing
- —
- Monthly P&I
- —
- Monthly cashflow
- —
- DSCR
- —
- Eligible?
- —
Personal DTI + credit; lowest rate.
DSCR
20% down · 8.5% · 30yr
- Down + closing
- —
- Monthly P&I
- —
- Monthly cashflow
- —
- DSCR
- —
- Eligible?
- —
No personal income docs; deal must DSCR.
Hard money
10% down · 12.0% · 12mo
- Down + closing
- —
- Monthly P&I
- —
- Monthly cashflow
- —
- DSCR
- —
- Eligible?
- —
Short-term bridge; refi at stabilization.
Rent comps 2 comps
| Address | Beds | Baths | Sqft | Rent | $/sqft | DOM | Units | Dist |
|---|---|---|---|---|---|---|---|---|
| 702 Anchor Dr Sanibel, FL | 4.0 | 3.0 | 3100 | $6,000 | $1.94 | 25d | 1 | 1.16mi |
| 1111 Schooner Pl Sanibel, FL | 4.0 | 3.0 | 3073 | $19,000 | $6.18 | 25d | 1 | 1.43mi |
HOA detail
- Monthly dues
- $4 · $48/yr
- Likely covers
- pool
Listing history 11 events
-
2026-04-29status Pending
-
2026-03-10$1,300,000 Active
-
2008-03-06price $892,500 285-char remark
Show marketing remark (285 chars)
Great opportunity to live on Sanibel Island. So many great features: High ceilings, crown molding, tile and wood flooring, cherry cabinetry with granite countertops, large tub in master bath and large lanai overlooking pool. Bank owned foreclosure being sold as-is and priced to sell.
-
2008-03-06soldstatus $850,000 285-char remark
Show marketing remark (285 chars)
Great opportunity to live on Sanibel Island. So many great features: High ceilings, crown molding, tile and wood flooring, cherry cabinetry with granite countertops, large tub in master bath and large lanai overlooking pool. Bank owned foreclosure being sold as-is and priced to sell.
-
2006-04-24soldstatus $150,000
-
2005-01-28soldstatus $1,383,000
-
2005-01-28soldstatus $1,700,000
-
2000-11-09historical
-
1999-11-09$230,000
-
1999-11-09soldstatus $19,850,000
-
1974-04-01soldstatus $13,800
ⓘ Source: listings_history table (triggers on properties + properties_extension) + one-shot
backfill from property_details.listing_events for pre-trigger history.
Tax reassessment forecast FL · Resets to sale price
- Current annual tax
- $20,217 · $1,685/mo
- Projected year-2 tax
- $20,217 · $1,685/mo
- Expected delta
- $0/yr ($0/mo · 0.0%)
ⓘ Screening estimate from a state-policy table — verify with the county assessor before closing.
Climate risk First Street
- Flood 9/10 Extreme FEMA zone AE · 99% chance over 30 yrs
- Wildfire 1/10 Low
- Heat 10/10 Extreme 7 d/yr ≥112°F today · 26 d/yr by 30 yrs out
- Wind 10/10 Extreme 99% chance of damaging wind over 30 yrs
- Air quality 2/10 Low 1 unhealthy d/yr today · 1 by 30 yrs out
Nearby sold comps map
Loading sold comps map…
Walkable amenities ~0.75 mi
Loading nearby amenities…
Taxation est. · year 1
- Rental income
- $142,246
- − Mortgage interest
- −$72,820
- − Property taxes
- −$20,217
- − Insurance
- −$11,618
- − Repairs & maintenance
- −$11,380
- − Management
- −$11,380
- − HOA
- −$48
- − Depreciation
- −$37,818
- Taxable loss
- −$23,035
- Est. tax savings @ 24.0%
- +$5,528
- After-tax cash flow
- $4,211/yr
For passive investors: Depreciation is non-cash, so a rental often shows a tax loss while cash-flowing — sheltering income. Rental losses are passive: they offset passive income freely, and up to $25,000/yr can offset ordinary (W-2) income if you actively participate and your MAGI is under $100k (phasing out to $0 by $150k); unused losses carry forward. On sale, claimed depreciation is recaptured at up to 25%, and gains may owe capital-gains tax (a 1031 exchange can defer both). Figures are a year-1 estimate at your 24.0% rate — not tax advice; consult a CPA.
Schools (NCES district)
- District
- Lee
- NCES district ID
- 1201080
- Math proficiency
- 47% ▼ -11.00%
- Reading proficiency
- 50% ▼ -4.00%
- Median HH income
- $49,518
- Composite
- 41.49/100
- National rank
- #3458
- State rank
- #42 of 73 in FL
Livability — Sanibel
- Score
- 67/100
- State rank
- #541
- US rank
- #10166
Category grades
Schools grade is shown separately in the Schools card above.
Census & demographics
- Census place
- Sanibel, FL
- City population
- 6,402
- Population (ZIP)
- 6,402
Population outlook (Lee County) Hauer SSP2
- Today (2025)
- 871,946 people
- By 2030
- 955,468 · +9.6%
- By 2040
- 1,113,587 · +27.7%
- By 2050
- 1,256,891 · +44.1%
- By 2075
- 1,560,270 · +78.9%
- By 2100
- 1,726,848 · +98.0%
Race, ethnicity, and origin ACS 2023
- Neighborhood character
- Predominantly White (95%)
- Race & ethnicity
- White 95% Two or more races 2% Asian 1%
- Common ancestry
- Italian 4% Romanian 4% Slovak 2%
- Foreign-born
- 5% · Canada, China
- Languages at home
- 96% English-only · German/W. Germanic 1% Spanish 1% French/Haitian/Cajun 1%
Political lean MEDSL · Lee
- 2024 margin
- Strong R (+28.4) · D 35.5% · R 63.9%
- 2008→2024 swing
- -18.0pp toward R · 2008: -10.4pp · 2024: -28.4pp
- All cycles
- 2024: R+28.4 2020: R+19.2 2016: R+20.4 2012: R+16.6 2008: R+10.4
Not yet ingested
- Civics
- —
Market trends
- HPI YoY
- ▼ -93.08%
- Current HPI
- 501.0
- Rent YoY
- —
- Metro
- —
- State GDP YoY
- ▲ 3.28%
- F500 in state
- 36
Industry mix (Fortune 500 HQ in FL)
| Industry | F500 HQs | Revenue |
|---|---|---|
| Industrial Technology | 2 | $29B |
|
||
| Insurance | 2 | $17B |
|
||
| Retail | 1 | $60B |
|
||
| Technology Distribution | 1 | $58B |
|
||
| Homebuilding | 1 | $35B |
|
||
| Technology Manufacturing | 1 | $35B |
|
||
Price history
+9320.3% since first listed11 events — show timeline
- 2026-04-29 Pending — FORTMLS
- 2026-03-10 Listed $1,300,000 FORTMLS
- 2008-03-06 Sold (MLS) $850,000 FORTMLS
- 2008-03-06 Price Changed $892,500 FORTMLS
- 2006-04-24 Sold (Public Records) $150,000 Public Records
- 2005-01-28 Sold (Public Records) $1,700,000 Public Records
- 2005-01-28 Sold (Public Records) $1,383,000 Public Records
- 2000-11-09 Listing Removed — FORTMLS
- 1999-11-09 Sold (Public Records) $19,850,000 Public Records
- 1999-11-09 Listed $230,000 FORTMLS
- 1974-04-01 Sold (Public Records) $13,800 Public Records
Property tax history
+3.9%/yrLatest (2025): $20,217 · -3.6% YoY. Source: county tax records.
Cash-flow waterfall
monthlySold comps — $/sqft
last 12 mo · ≤1 miLoading sold comps…