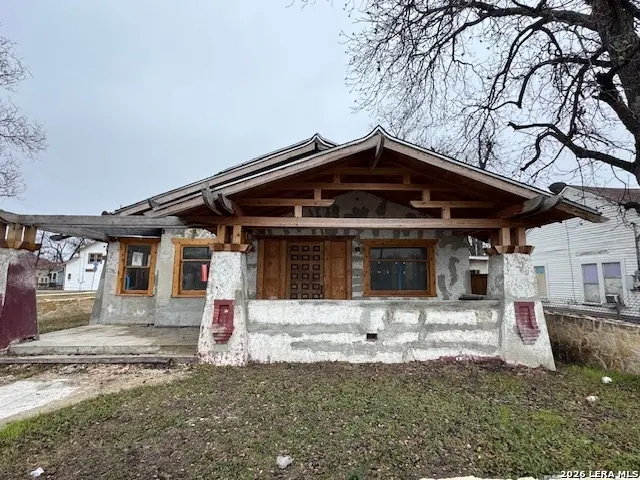
834 Iowa · San Antonio, TX
Flood risk 1/10 · Minimal
- FEMA flood zone
- X (unshaded)
- Chance of flooding over 30 yrs
- 0.0%
- Est. flood insurance / yr
- $507 – $1,088
Fire risk 1/10 · Minimal
- Est. fire insurance / yr
- $1,222 – $2,270
Heat risk 8/10 · Major
- Hot days now (above 108°F)
- 7 days/yr
- Hot days in 30 yrs
- 22 days/yr
Wind risk 8/10 · Major
- Chance of severe wind over 30 yrs
- 80.0%
Air-quality risk 2/10 · Minimal
- Unhealthy air days now
- 1 days/yr
- Unhealthy air days in 30 yrs
- 2 days/yr
Risk factors via First Street. Map © Google.
Why this score? — see what drove the B- grade
The composite is a weighted blend of 9 inputs, each scored 0–100. Each bar is that input's sub-score; the figure is the points it added to the 100-point composite (weight × sub-score).
- Cash flow +25.0/30.0
- DSCR +8.2/10.0
- 1% rule +7.9/10.0
- ARV discount +7.5/15.0
- Appreciation +5.7/10.0
- Rent growth +5.0/5.0
- Livability +4.0/5.0
- Condition / age +2.5/5.0
- Schools +1.4/10.0
$160,000
🖨 Deal sheet 📄 Offer letter ✓ Due diligence
Listing remarks MLS
Two story properties in Downtown San Antonio. Corner lot with 4 sides stucco exterior masonry. Investment property in need of complete renovation. Detached garage in need of repair. Covered front porch.
Key facts
- 5,967 sq ft lot
- Garage
- Built 1925
Neighborhood map
What this means for you Summary
Snapshot
- This is a 3-bed/2.0-bath single-family listed at $160k.
Deal economics
- At list price, monthly cash flow is $349 ($4k/yr) — positive.
- The deal already cash-flows at list — no discount required.
- Meets the 1% rule at list price ($2k rent vs $160k).
- Recommended offer: $141k (12.0% below list) — sets the bar for market timing.
- Cap rate 8.9% vs local median 3.8% in San Antonio — top-decile yield for the area; either an underpriced asset or a hidden risk that comps aren't pricing in. Stress-test before assuming the spread holds.
Location & tenants
- Location reads 80/100 on livability (#31 in TX, #1,616 nationally) — a professional / high-income tenant draw. Strengths: amenities A+, commute A+, cost of living A+; Watch: schools C-, crime F.
- San Antonio ISD (urban): math 12% / reading 22% proficiency, ranked #805 of 826 in TX (top 98%) — low school quality limits family demand, transient renter base, plan for 1-2y turnover; 80% free/reduced lunch — lower-income household profile, screen leases tightly.
- Market conditions: Rents rising fast (+10.9%/yr); 99 active listings in the ZIP; 40 comparable units currently listed for rent nearby; rentals at typical pace (median 24d on market — plan ~3-4 weeks tenant-placement turnaround); lower-income renter base — watch delinquency; 8,308 units permitted in Bexar County in 2024 (2,506 in 5+ unit buildings).
- At $2,067/mo this rent would consume 70% of the median local household income ($36k/yr) (locally 470% of renters already pay >50% of income on rent) — very limited rent-growth headroom before tenants either downsize or default.
Forward outlook
- In year one you build about $3k of equity ($1k loan paydown + $2k appreciation (1.3% local appreciation)).
- Bexar County population projected at +50% by 2050 — long-run rental-demand tailwind backs the buy-and-hold thesis.
- At projected returns (1.3% appreciation + 8.0% rent growth), your $45k cash investment doubles in ~5 years — after that, you're playing with house money.
- By year 10, paydown + projected appreciation supports a ~$33k cash-out refi (75% LTV) — recoverable capital for the next deal without selling this one.
Negotiation context
- It's been on market 143 days — a 12% lower offer ($141k) is reasonable based on typical stale-listing flexibility.
- 2 sale attempts with the ask held roughly flat each time — persistent listings suggest the price (not the market) is what's stuck; bring a comps-based counter.
Risks & watch-outs
- Watch-outs: property tax is 2.8% of price; built in 1925 — expect roof / HVAC / electrical / plumbing capex.
- Climate carrying-cost: severe wind risk, 80% chance of damaging wind over 30y; extreme-heat days projected 7→22/yr by 2055 (HVAC capex compounding) — expect insurance premiums to compound above CPI over the hold.
Questions for the listing agent
- It's been on market 143 days. Have you received any prior offers? Is the seller open to a 12% concession, seller financing, or rate buy-down credit?
- Built in 1925 — when were the roof, HVAC, electrical panel, plumbing, and water heater last replaced?
- Property tax is high relative to price — has the assessment been appealed recently, and will the sale trigger a re-assessment?
- Why hasn't it sold? Are there any deal-killer items the seller is aware of (foundation, flood, title, zoning, code violations)?
- Is there a deadline driving the sale (1031 exchange, divorce, estate, relocation)? That informs how much negotiation room exists.
- Crime grade is F in this area — have there been break-ins, vandalism, or insurance claims at this property in the last 3 years? What carrier currently insures it and at what premium?
- What's the average days-on-market for RENTAL listings here right now (not sales)? A rising rental-DOM trend means longer vacancies and softer asking-rent achievability than the comps imply.
- What's the recent tenant-quality profile in this submarket — average credit score on applications, eviction rate, late-payment / NSF rate, and stable-employment percentage? A property-management company in the area should have these aggregated.
- How much new for-sale + rental construction is in the pipeline within 1–3 miles? Heavy new supply typically softens prices + rents 12–24 months out; constrained supply supports both.
Investment metrics
- 1% rule
- 1.29% ✓
- Cap rate
- 8.91%
- Cash-on-cash
- 9.36%
- DSCR
- 1.42
- GRM
- 6.5
CMA / ARV
- ARV (median comp)
- $335,710
- List price
- $160,000
- Delta
- -52.34%
- Verdict
- UNDERPRICED
- Comps
- 20 within 1.0 mi
Show comp detail 12 sales within ~0.75 mi
| Address | Dist | Beds/Ba | Sqft | Sold | Price | $/sf | Match |
|---|---|---|---|---|---|---|---|
| 1018 Wyoming | 0.42mi | 3/2.5 | 2,112 (-5%) | 1mo | $420,000 | $199 | 70 |
| 926 Martin Luther King Dr | 0.20mi | 3/2.5 | 1,982 (-11%) | 10mo | $290,000 | $146 | 63 |
| 156 Porter St | 0.43mi | 4/2.0 (+1) | 2,194 (-1%) | 16mo | $150,000 | $68 | 60 |
| 1118 Wyoming St | 0.38mi | 3/3.0 | 2,040 (-8%) | 12mo | $269,900 | $132 | 55 |
| 1520 Virginia Blvd | 0.66mi | 4/3.0 (+1) | 2,280 (+3%) | 3mo | $400,000 | $175 | 53 |
| 222 S Olive St #2102 | 0.44mi | 3/3.5 | 2,073 (-6%) | 12mo | $740,000 | $357 | 52 |
| 222 S Olive St #2101 | 0.44mi | 3/3.5 | 2,073 (-6%) | 16mo | $735,000 | $355 | 50 |
| 222 S Olive St #1102 | 0.44mi | 3/3.5 | 2,073 (-6%) | 17mo | $725,000 | $350 | 48 |
| 211 Piedmont Ave | 0.44mi | 3/2.0 | 1,976 (-11%) | 16mo | $325,000 | $164 | 48 |
| 203 Denver | 0.58mi | 3/2.5 | 1,929 (-13%) | 3mo | $419,000 | $217 | 47 |
| 416 Denver Blvd | 0.51mi | 3/3.0 | 2,358 (+6%) | 19mo | $165,000 | $70 | 46 |
| 1521 S Mesquite St | 0.70mi | 3/2.5 | 1,943 (-12%) | 14mo | $109,900 | $57 | 33 |
Match score weights: distance 35% · size 25% · config 20% · recency 20%. Top-matched comps best support the ARV.
Projected returns pro-forma
1.34% appreciation · 8.0% rent growth · sell at horizon
- IRR
- 16.0%
- Equity multiple
- 1.87×
- Total profit
- $38,947
- Equity at exit
- $57,433
- IRR
- 22.4%
- Equity multiple
- 4.26×
- Total profit
- $146,187
- Equity at exit
- $78,547
Cash invested: $44,800 (down + closing). Projections, not guarantees.
Landlord ↔ Tenant lean methodology
- Overall (STATE)
- 87 Strongly Landlord-Friendly
- State Texas
- 87 Strongly Landlord-Friendly · R+5
- County
- — inherits STATE
- City
- — inherits STATE
ZIP-level market 78203
- Home prices YoY
- 0.5%
- Rents YoY
- 10.9%
- Active inventory
- 99
- Price-to-rent
- 6.5×
Monthly cashflow live
- Estimated rent
- $2,067 high interval (Pro) →
- Mortgage (P&I)
- −$839
- Tax from tax record
- −$377 /mo · $4,530/yr
- Insurance
- −$67
- HOA
- −$0
- Vacancy / Maint / Mgmt
- −$434
- Net cashflow
- $349
Break-even live
UW: 25.0% down · 7.5% · 30yr · 1.5% tax · 5.0% vac · 8.0% maint · 8.0% mgmt
Financing live
Cash to close
- Down payment
- $40,000
- Closing costs
- $4,800
- Reserves months
- —
- Total cash needed
- —
Loan-product check · same deal, 3 products live
Conventional
25% down · 7.5% · 30yr
- Down + closing
- —
- Monthly P&I
- —
- Monthly cashflow
- —
- DSCR
- —
- Eligible?
- —
Personal DTI + credit; lowest rate.
DSCR
20% down · 8.5% · 30yr
- Down + closing
- —
- Monthly P&I
- —
- Monthly cashflow
- —
- DSCR
- —
- Eligible?
- —
No personal income docs; deal must DSCR.
Hard money
10% down · 12.0% · 12mo
- Down + closing
- —
- Monthly P&I
- —
- Monthly cashflow
- —
- DSCR
- —
- Eligible?
- —
Short-term bridge; refi at stabilization.
Rent comps 40 comps
| Address | Beds | Baths | Sqft | Rent | $/sqft | DOM | Units | Dist |
|---|---|---|---|---|---|---|---|---|
| 114 Gravel St San Antonio, TX | 4.0 | 3.5 | 1936 | $2,095 | $1.08 | 4d | 1 | 0.07mi |
| 707 S Olive St Unit B San Antonio, TX | 3.0 | 2.0 | 2054 | $1,500 | $0.73 | 44d | 1 | 0.18mi |
| 326 Cactus St San Antonio, TX | 3.0 | 2.5 | 2059 | $2,500 | $1.21 | 24d | 1 | 0.20mi |
| 104 Shenandoah San Antonio, TX | 3.0 | 2.5 | 1580 | $1,925 | $1.22 | 17d | 1 | 0.21mi |
| 507 S Palmetto San Antonio, TX | 3.0 | 2.5 | 2720 | $1,230 | $0.45 | 3d | 1 | 0.25mi |
| 610 Virginia Blvd Unit 2 San Antonio, TX | 3.0 | 1.0 | 1722 | $1,150 | $0.67 | 4d | 1 | 0.25mi |
| 704 Cuney Way San Antonio, TX | 4.0 | 2.0 | 1528 | $2,600 | $1.70 | 24d | 1 | 0.28mi |
| 1138 Iowa St San Antonio, TX | 3.0 | 2.0 | 1505 | $1,650 | $1.10 | 24d | 1 | 0.31mi |
| 1021 S Hackberry St Unit 201 San Antonio, TX | 3.0 | 3.5 | 1747 | $2,950 | $1.69 | 43d | 1 | 0.37mi |
| 218 S Olive St #2101 San Antonio, TX | 3.0 | 3.5 | 1800 | $3,199 | $1.78 | 43d | 1 | 0.42mi |
| 222 S Olive St San Antonio, TX | 3.0 | 3.5 | 2073 | $2,500 | $1.21 | 43d | 1 | 0.43mi |
| 222 S Olive St #1102 San Antonio, TX | 3.0 | 3.5 | 2073 | $2,500 | $1.21 | 43d | 1 | 0.43mi |
| 802 Montana St Unit 2 San Antonio, TX | 3.0 | 1.0 | 1440 | $1,500 | $1.04 | 11d | 1 | 0.44mi |
| 827 Florida St Unit 101 San Antonio, TX | 3.0 | 2.5 | 1426 | $1,950 | $1.37 | 43d | 1 | 0.51mi |
| 343 Porter St #101 San Antonio, TX | 3.0 | 2.5 | 1600 | $2,100 | $1.31 | 4d | 1 | 0.52mi |
| 204 S Hackberry St Unit 204-A S Hackberry San Antonio, TX | 4.0 | 2.0 | 2658 | $1,550 | $0.58 | 44d | 1 | 0.54mi |
| 531 Essex St Unit 202 San Antonio, TX | 3.0 | 2.5 | 1514 | $2,000 | $1.32 | 24d | 1 | 0.55mi |
| 627 Essex St San Antonio, TX | 3.0 | 2.5 | 1402 | $1,850 | $1.32 | 24d | 1 | 0.56mi |
| 1210 S New Braunfels Ave San Antonio, TX | 3.0 | 2.5 | 2790 | $1,500 | $0.54 | 43d | 1 | 0.57mi |
| 212 Cooper St Unit A San Antonio, TX | 3.0 | 3.0 | 1750 | $1,550 | $0.89 | 24d | 1 | 0.59mi |
| 212 Cooper St Unit A San Antonio, TX | 3.0 | 3.0 | 1750 | $1,625 | $0.93 | 43d | 1 | 0.59mi |
| 1618 Dakota St Unit 102 San Antonio, TX | 3.0 | 2.5 | 1768 | $1,925 | $1.09 | 16d | 1 | 0.63mi |
| 147 Vine St San Antonio, TX | 3.0 | 3.0 | 1438 | $1,700 | $1.18 | 24d | 1 | 0.73mi |
| 612 Leigh St San Antonio, TX | 4.0 | 3.0 | 2357 | $4,000 | $1.70 | 43d | 1 | 0.77mi |
| 119 W Drexel Ave San Antonio, TX | 4.0 | 2.0 | 1592 | $1,400 | $0.88 | 43d | 1 | 0.82mi |
| 1726 S Olive St San Antonio, TX | 3.0 | 3.5 | 2015 | $2,800 | $1.39 | 24d | 1 | 0.84mi |
| 631 Potomac San Antonio, TX | 3.0 | 2.5 | 1844 | $1,797 | $0.97 | 24d | 1 | 0.86mi |
| 1111 Gibbs San Antonio, TX | 3.0 | 2.0 | 1476 | $1,595 | $1.08 | 24d | 1 | 0.93mi |
| 318 Ferguson Ave Unit 1 San Antonio, TX | 3.0 | 2.0 | 1450 | $1,550 | $1.07 | 4d | 1 | 0.96mi |
| 322 Vine St #102 San Antonio, TX | 3.0 | 2.5 | 1401 | $1,400 | $1.00 | 24d | 1 | 0.96mi |
| 228 Lotus St Unit 201 San Antonio, TX | 3.0 | 3.5 | 1500 | $1,850 | $1.23 | 2d | 1 | 0.96mi |
| 228 Lotus St Unit 201 San Antonio, TX | 3.0 | 2.0 | 1700 | $1,900 | $1.12 | 12d | 1 | 0.96mi |
| 228 Lotus Ave Unit 101 San Antonio, TX | 3.0 | 2.0 | 1500 | $1,850 | $1.23 | 12d | 1 | 0.96mi |
| 228 Lotus Ave Unit 101 San Antonio, TX | 3.0 | 3.5 | 1500 | $1,800 | $1.20 | 4d | 1 | 0.96mi |
| 215 Center St #307 San Antonio, TX | 2.0 | 2.0 | 1424 | $2,350 | $1.65 | 24d | 1 | 0.97mi |
| 215 Center St #307 San Antonio, TX | 2.0 | 2.0 | 1424 | $2,350 | $1.65 | 20d | 1 | 0.97mi |
| 534 Rigsby Ave San Antonio, TX | 3.0 | 2.0 | 1438 | $1,950 | $1.36 | 24d | 1 | 0.99mi |
| 311 Refugio St #101 San Antonio, TX | 3.0 | 2.5 | 1556 | $3,200 | $2.06 | 17d | 1 | 1.02mi |
| 423 N Mesquite St San Antonio, TX | 3.0 | 2.5 | 1925 | $1,750 | $0.91 | 12d | 1 | 1.03mi |
| 1723 E Crockett St San Antonio, TX | 3.0 | 3.0 | 1819 | $1,800 | $0.99 | 24d | 1 | 1.04mi |
Listing history 22 events
-
2026-06-18days on market $160,000 Active 143 DOM
-
2026-06-17days on market $160,000 Active 142 DOM
-
2026-06-16days on market $160,000 Active 141 DOM
-
2026-06-15days on market $160,000 Active 140 DOM
-
2026-06-13days on market $160,000 Active 138 DOM
-
2026-06-09days on market $160,000 Active 134 DOM
-
2026-06-08days on market $160,000 Active 133 DOM
-
2026-06-07days on market $160,000 Active 132 DOM
-
2026-06-04days on market $160,000 Active 129 DOM
-
2026-06-03days on market $160,000 Active 128 DOM
-
2026-06-02days on market $160,000 Active 127 DOM
-
2026-06-01days on market $160,000 Active 126 DOM
-
2026-05-31days on market $160,000 Active 125 DOM
-
2026-05-10price $160,000 202-char remark
Show marketing remark (202 chars)
Two story properties in Downtown San Antonio. Corner lot with 4 sides stucco exterior masonry. Investment property in need of complete renovation. Detached garage in need of repair. Covered front porch.
-
2026-04-30status Back on Market 202-char remark
Show marketing remark (202 chars)
Two story properties in Downtown San Antonio. Corner lot with 4 sides stucco exterior masonry. Investment property in need of complete renovation. Detached garage in need of repair. Covered front porch.
-
2026-04-18historical Active Option 202-char remark
Show marketing remark (202 chars)
Two story properties in Downtown San Antonio. Corner lot with 4 sides stucco exterior masonry. Investment property in need of complete renovation. Detached garage in need of repair. Covered front porch.
-
2026-01-26$165,000 New 202-char remark
Show marketing remark (202 chars)
Two story properties in Downtown San Antonio. Corner lot with 4 sides stucco exterior masonry. Investment property in need of complete renovation. Detached garage in need of repair. Covered front porch.
-
2023-11-02soldstatus
-
2022-08-04soldstatus
-
2022-08-04soldstatus
-
2005-05-10soldstatus
-
2004-10-12soldstatus
ⓘ Source: listings_history table (triggers on properties + properties_extension) + one-shot
backfill from property_details.listing_events for pre-trigger history.
Tax reassessment forecast TX · Resets to sale price
- Current annual tax
- $4,530 · $377/mo
- Projected year-2 tax
- $4,530 · $377/mo
- Expected delta
- $0/yr ($0/mo · 0.0%)
ⓘ Screening estimate from a state-policy table — verify with the county assessor before closing.
Climate risk First Street
- Flood 1/10 Low FEMA zone X (unshaded) · 0% chance over 30 yrs
- Wildfire 1/10 Low
- Heat 8/10 Severe 7 d/yr ≥108°F today · 22 d/yr by 30 yrs out
- Wind 8/10 Severe 80% chance of damaging wind over 30 yrs
- Air quality 2/10 Low 1 unhealthy d/yr today · 2 by 30 yrs out
Nearby sold comps map
Loading sold comps map…
Walkable amenities ~0.75 mi
Loading nearby amenities…
Taxation est. · year 1
- Rental income
- $24,798
- − Mortgage interest
- −$8,962
- − Property taxes
- −$4,530
- − Insurance
- −$800
- − Repairs & maintenance
- −$1,984
- − Management
- −$1,984
- − Depreciation
- −$4,655
- Taxable income
- $1,884
- Est. tax owed @ 24.0%
- −$452
- After-tax cash flow
- $3,740/yr
For passive investors: Depreciation is non-cash, so a rental often shows a tax loss while cash-flowing — sheltering income. Rental losses are passive: they offset passive income freely, and up to $25,000/yr can offset ordinary (W-2) income if you actively participate and your MAGI is under $100k (phasing out to $0 by $150k); unused losses carry forward. On sale, claimed depreciation is recaptured at up to 25%, and gains may owe capital-gains tax (a 1031 exchange can defer both). Figures are a year-1 estimate at your 24.0% rate — not tax advice; consult a CPA.
Schools (NCES district)
- District
- San Antonio ISD
- NCES district ID
- 4838730
- Math proficiency
- 12% ▼ -21.00%
- Reading proficiency
- 22% ▼ -7.00%
- Median HH income
- $30,952
- Composite
- 13.57/100
- National rank
- #9512
- State rank
- #805 of 826 in TX
Livability — San Antonio
- Score
- 80/100
- State rank
- #31
- US rank
- #1616
Category grades
Schools grade is shown separately in the Schools card above.
Census & demographics
- Census place
- San Antonio, TX
- County
- Bexar County · 1,990,555 people
- City population
- 1,806,925
- Metro
- San Antonio-New Braunfels, TX
- Population (ZIP)
- 5,200
- Household income
- $35,536
- Rent vs Own
- Severe rent burden
- 470.0
Population outlook (Bexar County) Hauer SSP2
- Today (2025)
- 2,336,851 people
- By 2030
- 2,560,728 · +9.6%
- By 2040
- 3,020,569 · +29.3%
- By 2050
- 3,493,522 · +49.5%
- By 2075
- 4,668,459 · +99.8%
- By 2100
- 5,533,242 · +136.8%
Race, ethnicity, and origin ACS 2023
- Neighborhood character
- Predominantly Hispanic (84%)
- Race & ethnicity
- Hispanic / Latino 84% Two or more races 37% Black 8% White 7% Native American 1%
- Hispanic origin (detail)
- Mexican 67% Puerto Rican 3%
- Common ancestry
- Portuguese 2% Lithuanian 2%
- Foreign-born
- 18% · Canada
- Languages at home
- 53% English-only · Spanish 46%
Political lean MEDSL · Bexar
- 2024 margin
- Lean D (+9.8) · D 54.3% · R 44.6% · Other 1.1%
- 2008→2024 swing
- +4.2pp toward D · 2008: 5.6pp · 2024: 9.8pp
- All cycles
- 2024: D+9.8 2020: D+18.2 2016: D+13.5 2012: D+4.6 2008: D+5.6
Not yet ingested
- Civics
- —
Market trends
- HPI YoY
- ▲ 1.34%
- Current HPI
- 257.4183
- Rent YoY
- ▲ 10.86%
- Metro
- San Antonio-New Braunfels, TX
- State GDP YoY
- ▲ 3.95%
- F500 in state
- 110
Industry mix (Fortune 500 HQ in TX)
| Industry | F500 HQs | Revenue |
|---|---|---|
| Energy | 16 | $1,198B |
|
||
| Technology | 5 | $198B |
|
||
| Engineering / Construction | 4 | $72B |
|
||
| Energy Services | 3 | $60B |
|
||
| Utilities | 3 | $41B |
|
||
| Healthcare | 2 | $330B |
|
||
Price history
-3.0% since first listed9 events — show timeline
- 2026-05-10 Price Changed $160,000 LERA
- 2026-04-30 Relisted — LERA
- 2026-04-18 Contingent — LERA
- 2026-01-26 Listed $165,000 LERA
- 2023-11-02 Sold (Public Records) — Public Records
- 2022-08-04 Sold (Public Records) — Public Records
- 2022-08-04 Sold (Public Records) — Public Records
- 2005-05-10 Sold (Public Records) — Public Records
- 2004-10-12 Sold (Public Records) — Public Records
Property tax history
+7.3%/yrLatest (2025): $4,530 · +0.0% YoY. Source: county tax records.
Cash-flow waterfall
monthlySold comps — $/sqft
last 12 mo · ≤1 miLoading sold comps…