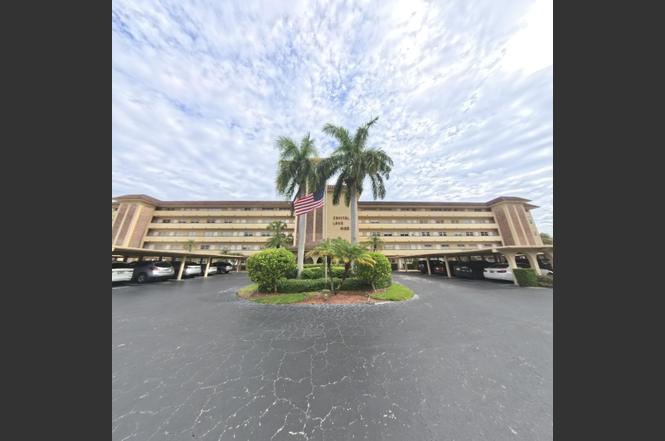
4100 Crystal Lake Dr #209 · Deerfield Beach, FL
Flood risk No data
- FEMA flood zone
- —
- Chance of flooding over 30 yrs
- —
- Est. flood insurance / yr
- —
Fire risk No data
- Est. fire insurance / yr
- —
Heat risk No data
- Hot days now (above threshold)
- —
- Hot days in 30 yrs
- —
Wind risk No data
- Chance of severe wind over 30 yrs
- —
Air-quality risk No data
- Unhealthy air days now
- —
- Unhealthy air days in 30 yrs
- —
Risk factors via First Street. Map © Google.
Why this score? — see what drove the B- grade
The composite is a weighted blend of 9 inputs, each scored 0–100. Each bar is that input's sub-score; the figure is the points it added to the 100-point composite (weight × sub-score).
- Cash flow +28.2/30.0
- 1% rule +10.0/10.0
- DSCR +10.0/10.0
- ARV discount +7.5/15.0
- Schools +4.1/10.0
- Livability +3.8/5.0
- Rent growth +2.9/5.0
- Condition / age +2.5/5.0
- Appreciation +0.0/10.0
$129,000
🖨 Deal sheet 📄 Offer letter ✓ Due diligence
Listing remarks
Step inside to find a spacious 2 bedroom condo featuring beautiful vinyl flooring that adds warmth and style. The living area flows seamlessly into the dining space, large windows bathe the rooms in natural light, enhancing the tranquil atmosphere. This inviting second-floor apartment has a great view of the garden and pool, perfect for those who appreciate serene outdoor living. Enjoy your mornings sipping coffee on the balcony, overlooking the gardens and pool area. With easy access to amenities and a vibrant community, this apartment is a perfect blend of comfort and convenience close to major highways, supermarkets and convenience stores.
Key facts
- Garden
- Vinyl flooring
- Balcony
Tags
Property features AI
Finance
- Other: Pets allowed (restrictions possible); Is a senior community
- HOA & community: Community pool; Elevator(s); On-site laundry; Parking; Hobby room; Maintenance services; Monthly HOA fee (includes insurance, structure maintenance, sewer, trash, water, common areas, elevator, reserve funds, roof repairs, pool service)
Exterior
- Parking: Assigned parking; Covered parking; Guest parking; Under-building parking; 1 parking space
- Utilities: Public water; Public sewer; Sewer available; Water available
- Home design: Condominium; One level; South-facing; Updated/remodeled; 5-story building
- Construction: Concrete block with stucco construction; Concrete roof
- Exterior features: Covered patio; Patio
Interior
- Kitchen: Dishwasher; Electric range; Microwave; Refrigerator; Electric water heater
- Bedrooms: 1 bedroom on the main level
- Flooring: Ceramic tile; Tile; Wood; Engineered wood
- Bathrooms: 1 full bathroom; 1 half bathroom
- Heating & cooling: Radiant heating; Central individual heating; Central air conditioning; Ceiling fans
- Interior features: Walk-in closets; Closet cabinetry; Unfurnished
- Laundry & utility: Laundry in common area
Neighborhood map
What this means for you Summary
Snapshot
- This is a 2-bed/2.0-bath condo listed at $129k.
Deal economics
- At list price, monthly cash flow is $408 ($5k/yr) — positive.
- The deal already cash-flows at list — no discount required.
- Meets the 1% rule at list price ($2k rent vs $129k).
- Recommended offer: $117k (9.0% below list) — sets the bar for market timing.
- Cap rate 10.1% vs local median 4.2% in Deerfield Beach — top-decile yield for the area; either an underpriced asset or a hidden risk that comps aren't pricing in. Stress-test before assuming the spread holds.
Location & tenants
- Location reads 75/100 on livability (#250 in FL, #3,970 nationally) — a middle-class / working-renter tenant base. Strengths: housing A+, health & safety A+, cost of living A; Watch: schools D-, amenities D-, employment D-.
- Broward (suburban): math 42% / reading 53% proficiency, ranked #46 of 73 in FL (top 63%) — families likely to look elsewhere, expect single-tenant / working-renter base with shorter leases.
- Market conditions: Rents rising (+1.8%/yr); 591 active listings in the ZIP; 40 comparable units currently listed for rent nearby; rentals at typical pace (median 24d on market — plan ~3-4 weeks tenant-placement turnaround); 2,111 units permitted in Broward County in 2024 (1,265 in 5+ unit buildings).
- This rent runs 35% of the median local income ($71k/yr) — at the standard rent-burdened threshold; future hikes will face affordability resistance.
Forward outlook
- Local home prices are declining (-3.0%/yr); year-one equity from $892 of loan paydown is wiped out by about $4k of value loss. Plan a longer hold.
- Broward County population projected at +34% by 2050 — long-run rental-demand tailwind backs the buy-and-hold thesis.
- At projected returns (-3.0% appreciation + 1.8% rent growth), your $36k cash investment doubles in ~10 years — after that, you're playing with house money.
Negotiation context
- It's been on market 94 days — a 9% lower offer ($117k) is reasonable based on typical stale-listing flexibility.
- 4 sale attempts since 6y ago with the ask held roughly flat each time — persistent listings suggest the price (not the market) is what's stuck; bring a comps-based counter.
- Current owner paid $105k; 23% above their basis — modest negotiation headroom, anchor on the comps not their cost.
Questions for the listing agent
- It's been on market 94 days. Have you received any prior offers? Is the seller open to a 9% concession, seller financing, or rate buy-down credit?
- Built in 1970 — when were the roof, HVAC, electrical panel, plumbing, and water heater last replaced?
- What does the HOA fee cover, when was the last increase, and are there any pending special assessments or reserve-fund shortfalls?
- Any open or pending special assessments — roof, HVAC, plumbing, elevator, façade? What's the per-unit balance and payoff schedule, and is the seller paying it off at close or rolling it to the buyer?
- Why hasn't it sold? Are there any deal-killer items the seller is aware of (foundation, flood, title, zoning, code violations)?
- Is there a deadline driving the sale (1031 exchange, divorce, estate, relocation)? That informs how much negotiation room exists.
- Schools are D-rated, which usually means shorter tenancies and higher turnover. Who's the typical renter profile here, and what's been the actual vacancy rate?
- What's the average days-on-market for RENTAL listings here right now (not sales)? A rising rental-DOM trend means longer vacancies and softer asking-rent achievability than the comps imply.
- What's the recent tenant-quality profile in this submarket — average credit score on applications, eviction rate, late-payment / NSF rate, and stable-employment percentage? A property-management company in the area should have these aggregated.
- How much new apartment / multifamily construction is in the pipeline within 1–3 miles? Heavy new supply (>2% of stock underway) typically softens rents 12–24 months out; light construction supports rent growth.
Investment metrics
- 1% rule
- 1.59% ✓
- Cap rate
- 10.09%
- Cash-on-cash
- 13.57%
- DSCR
- 1.60
- GRM
- 5.2
CMA / ARV
No comps found within radius.
Projected returns pro-forma
-3.0% appreciation · 1.75% rent growth · sell at horizon
- IRR
- 2.0%
- Equity multiple
- 1.08×
- Total profit
- $2,789
- Equity at exit
- $19,234
- IRR
- 10.2%
- Equity multiple
- 1.74×
- Total profit
- $26,652
- Equity at exit
- $11,154
Cash invested: $36,120 (down + closing). Projections, not guarantees.
Landlord ↔ Tenant lean methodology
- Overall (STATE)
- 87 Strongly Landlord-Friendly
- State Florida
- 87 Strongly Landlord-Friendly · R+3
- County
- — inherits STATE
- City
- — inherits STATE
ZIP-level market 33064
- Home prices YoY
- -18.7%
- Rents YoY
- 1.8%
- Active inventory
- 591
- Price-to-rent
- 5.2×
Monthly cashflow live
- Estimated rent
- $2,051 high interval (Pro) →
- Mortgage (P&I)
- −$676
- Tax from tax record
- −$133 /mo · $1,595/yr
- Insurance
- −$54
- HOA
- −$349
- Vacancy / Maint / Mgmt
- −$431
- Net cashflow
- $408
Break-even live
UW: 25.0% down · 7.5% · 30yr · 1.5% tax · 5.0% vac · 8.0% maint · 8.0% mgmt
Financing live
Cash to close
- Down payment
- $32,250
- Closing costs
- $3,870
- Reserves months
- —
- Total cash needed
- —
Loan-product check · same deal, 3 products live
Conventional
25% down · 7.5% · 30yr
- Down + closing
- —
- Monthly P&I
- —
- Monthly cashflow
- —
- DSCR
- —
- Eligible?
- —
Personal DTI + credit; lowest rate.
DSCR
20% down · 8.5% · 30yr
- Down + closing
- —
- Monthly P&I
- —
- Monthly cashflow
- —
- DSCR
- —
- Eligible?
- —
No personal income docs; deal must DSCR.
Hard money
10% down · 12.0% · 12mo
- Down + closing
- —
- Monthly P&I
- —
- Monthly cashflow
- —
- DSCR
- —
- Eligible?
- —
Short-term bridge; refi at stabilization.
Rent comps 40 comps
| Address | Beds | Baths | Sqft | Rent | $/sqft | DOM | Units | Dist |
|---|---|---|---|---|---|---|---|---|
| 3910 Crystal Lake Dr #201 Deerfield Beach, FL | 2.0 | 2.0 | 884 | $2,000 | $2.26 | 24d | 1 | 0.16mi |
| 1421 NW 45th St #5 Deerfield Beach, FL | 2.0 | 2.0 | 760 | $2,000 | $2.63 | 24d | 1 | 0.31mi |
| 3801 Crystal Lake Dr Deerfield Beach, FL | 1.0–2.0 | 1.0–2.0 | 968 | $2,325 | $2.40 | 1d | 8 | 0.32mi |
| 1101 Crystal Lake Dr #203 Deerfield Beach, FL | 2.0 | 2.0 | 930 | $2,200 | $2.37 | 24d | 1 | 0.35mi |
| 1100 Crystal Lake Dr #207 Deerfield Beach, FL | 1.0 | 1.0 | 660 | $1,900 | $2.88 | 24d | 1 | 0.37mi |
| 1021 Crystal Lake Dr #203 Deerfield Beach, FL | 2.0 | 2.0 | 890 | $1,800 | $2.02 | 14d | 1 | 0.39mi |
| 4550 NW 18th Ave #506 Deerfield Beach, FL | 2.0 | 2.0 | 1070 | $2,100 | $1.96 | 11d | 1 | 0.41mi |
| 4061 NW 9th Ave #206 Deerfield Beach, FL | 2.0 | 2.0 | 800 | $1,900 | $2.38 | 24d | 1 | 0.43mi |
| 941 Crystal Lake Dr #302 Deerfield Beach, FL | 2.0 | 2.0 | 882 | $1,890 | $2.14 | 14d | 1 | 0.45mi |
| 3901 NW 9th Ave Deerfield Beach, FL | 2.0 | 2.0 | 800 | $1,995 | $2.49 | 24d | 1 | 0.45mi |
| 1001 NW 45th St #6 Deerfield Beach, FL | 2.0 | 2.0 | 850 | $2,200 | $2.59 | 15d | 1 | 0.46mi |
| 4570 NW 18th Ave #605 Deerfield Beach, FL | 1.0 | 2.0 | 930 | $1,750 | $1.88 | 14d | 1 | 0.49mi |
| 3550 Blue Lake Dr Pompano Beach, FL | 1.0 | 1.5 | 850 | $1,850 | $2.18 | 24d | 1 | 0.49mi |
| 3500 Blue Lake Dr #101 Pompano Beach, FL | 1.0 | 1.5 | 850 | $1,900 | $2.24 | 24d | 1 | 0.51mi |
| 3400 Blue Lake Dr Pompano Beach, FL | 2.0 | 2.0 | 1039 | $2,288 | $2.20 | 24d | 2 | 0.51mi |
| 4304 NW 9th Ave Unit 2-2D Pompano Beach, FL | 2.0 | 2.0 | 1040 | $1,750 | $1.68 | 14d | 1 | 0.58mi |
| 858 Crystal Lake Dr #858 Pompano Beach, FL | 2.0 | 2.0 | 987 | $2,200 | $2.23 | 24d | 1 | 0.58mi |
| 4314 NW 9th Ave Deerfield Beach, FL | 1.0–2.0 | 1.5–2.0 | 992 | $1,940 | $1.95 | 14d | 2 | 0.58mi |
| 4394 NW 9th Ave Unit 20-1A Deerfield Beach, FL | 2.0 | 2.0 | 950 | $1,700 | $1.79 | 24d | 1 | 0.59mi |
| 4354 NW 9th Ave Unit 12-3D Pompano Beach, FL | 2.0 | 2.0 | 1040 | $2,000 | $1.92 | 24d | 1 | 0.59mi |
| 4450 Military Trl Unit 22 Pompano Beach, FL | 2.0 | 1.0 | 940 | $1,950 | $2.07 | 24d | 1 | 0.62mi |
| 651 NW 42nd Ct #214 Deerfield Beach, FL | 2.0 | 1.0 | 721 | $1,695 | $2.35 | 24d | 1 | 0.74mi |
| 661 Cypress Lake Blvd Unit I20 Deerfield Beach, FL | 3.0 | 2.0 | 974 | $2,250 | $2.31 | 1d | 1 | 0.81mi |
| 661 Cypress Lake Blvd Unit I20 Deerfield Beach, FL | 3.0 | 2.0 | 974 | $2,300 | $2.36 | 24d | 1 | 0.81mi |
| 624 NW 47th St Deerfield Beach, FL | 2.0 | 2.0 | 793 | $2,100 | $2.65 | 14d | 1 | 0.82mi |
| 731 Cypress Ln Unit D Pompano Beach, FL | 1.0 | 1.0 | 605 | $1,650 | $2.73 | 18d | 1 | 0.82mi |
| 4325 NW 5th Ave Deerfield Beach, FL | 2.0 | 2.0 | 953 | $2,249 | $2.36 | 10d | 1 | 0.82mi |
| 616 NW 47th St Deerfield Beach, FL | 2.0 | 2.0 | 793 | $2,495 | $3.15 | 4d | 1 | 0.82mi |
| 671 Cypress Lake Blvd Unit D21 Deerfield Beach, FL | 3.0 | 2.0 | 974 | $2,250 | $2.31 | 11d | 1 | 0.84mi |
| 800 Cypress Park Way Unit M Pompano Beach, FL | 2.0 | 2.0 | 807 | $2,000 | $2.48 | 1d | 1 | 0.84mi |
| 800 Cypress Park Way Unit F1 Deerfield Beach, FL | 2.0 | 2.0 | 807 | $2,000 | $2.48 | 24d | 1 | 0.84mi |
| 3550 NW 8th Ave Pompano Beach, FL | 2.0 | 1.5 | 765 | $1,775 | $2.32 | 14d | 4 | 0.85mi |
| 631 Cypress Lake Blvd Unit O17 Deerfield Beach, FL | 2.0 | 2.0 | 807 | $2,100 | $2.60 | 24d | 1 | 0.86mi |
| 631 Cypress Lake Blvd Unit P17 Deerfield Beach, FL | 2.0 | 2.0 | 807 | $1,950 | $2.42 | 11d | 1 | 0.86mi |
| 521 NW 35th Ct Unit D Pompano Beach, FL | 1.0 | 1.0 | 600 | $1,525 | $2.54 | 24d | 1 | 0.88mi |
| 351 NW 42nd Ct Apt 205 Pompano Beach, FL | 2.0 | 1.0 | 800 | $1,899 | $2.37 | 14d | 1 | 0.88mi |
| 311 NW 42nd Ct #101 Deerfield Beach, FL | 2.0 | 1.0 | 800 | $1,799 | $2.25 | 24d | 1 | 0.90mi |
| 551 NW 46th St Deerfield Beach, FL | 2.0 | 2.0 | 952 | $2,485 | $2.61 | 24d | 1 | 0.92mi |
| 660 Cypress Club Way Unit L11 Deerfield Beach, FL | 1.0 | 1.0 | 605 | $1,625 | $2.69 | 11d | 1 | 0.92mi |
| 331 NW 42nd Ct Unit 101 Pompano Beach, FL | 2.0 | 1.0 | 800 | $1,799 | $2.25 | 14d | 1 | 0.93mi |
HOA detail condo
- Monthly dues
- $349 · $4,188/yr
- Likely covers
- pool
- Assessments
- None detected in remarks — confirm with the listing agent.
Listing history 28 events
-
2026-06-15statusdays on market $129,000 Pending 94 DOM
-
2026-06-13days on market $129,000 Active 93 DOM
-
2026-06-09days on market $129,000 Active 89 DOM
-
2026-06-08days on market $129,000 Active 88 DOM
-
2026-06-07days on market $129,000 Active 87 DOM
-
2026-06-04days on market $129,000 Active 84 DOM
-
2026-06-03days on market $129,000 Active 83 DOM
-
2026-06-02days on market $129,000 Active 82 DOM
-
2026-06-01days on market $129,000 Active 81 DOM
-
2026-05-31days on market $129,000 Active 80 DOM
-
2026-03-12$129,000 Active
-
2024-08-18historical
-
2024-07-06price $167,500
-
2024-06-25price $171,500
-
2024-06-09price $173,500
-
2024-05-18$179,000 Active
-
2024-05-17historical
-
2024-05-14price $179,000
-
2024-03-22price $183,000
-
2023-12-03price $185,000
-
2023-11-17$192,000 Active
-
2021-03-25soldstatus $105,000
-
2021-03-16soldstatus $105,000 Closed
-
2021-02-15status Pending
-
2020-11-23price $110,000
-
2020-10-22$115,000 Active
-
2014-04-10soldstatus $75,000
-
1988-11-15soldstatus $45,000
ⓘ Source: listings_history table (triggers on properties + properties_extension) + one-shot
backfill from property_details.listing_events for pre-trigger history.
Tax reassessment forecast FL · Resets to sale price
- Current annual tax
- $1,595 · $133/mo
- Projected year-2 tax
- $1,595 · $133/mo
- Expected delta
- $0/yr ($0/mo · 0.0%)
ⓘ Screening estimate from a state-policy table — verify with the county assessor before closing.
Nearby sold comps map
Loading sold comps map…
Walkable amenities ~0.75 mi
Loading nearby amenities…
Taxation est. · year 1
- Rental income
- $24,616
- − Mortgage interest
- −$7,226
- − Property taxes
- −$1,595
- − Insurance
- −$645
- − Repairs & maintenance
- −$1,969
- − Management
- −$1,969
- − HOA
- −$4,188
- − Depreciation
- −$3,753
- Taxable income
- $3,271
- Est. tax owed @ 24.0%
- −$785
- After-tax cash flow
- $4,116/yr
For passive investors: Depreciation is non-cash, so a rental often shows a tax loss while cash-flowing — sheltering income. Rental losses are passive: they offset passive income freely, and up to $25,000/yr can offset ordinary (W-2) income if you actively participate and your MAGI is under $100k (phasing out to $0 by $150k); unused losses carry forward. On sale, claimed depreciation is recaptured at up to 25%, and gains may owe capital-gains tax (a 1031 exchange can defer both). Figures are a year-1 estimate at your 24.0% rate — not tax advice; consult a CPA.
Schools (NCES district)
- District
- Broward
- NCES district ID
- 1200180
- Math proficiency
- 42% ▼ -18.00%
- Reading proficiency
- 53% ▼ -5.00%
- Median HH income
- $52,139
- Composite
- 40.88/100
- National rank
- #3621
- State rank
- #46 of 73 in FL
Livability — Deerfield Beach
- Score
- 75/100
- State rank
- #250
- US rank
- #3970
Category grades
Schools grade is shown separately in the Schools card above.
Census & demographics
- Census place
- Deerfield Beach, FL
- County
- Broward County · 1,963,430 people
- Metro
- Miami-Fort Lauderdale-Pompano Beach, FL
- Population (ZIP)
- 64,563
- Household income
- $71,301
- Rent vs Own
- Severe rent burden
- 2907.0
Population outlook (Broward County) Hauer SSP2
- Today (2025)
- 2,207,033 people
- By 2030
- 2,360,704 · +7.0%
- By 2040
- 2,661,208 · +20.6%
- By 2050
- 2,946,698 · +33.5%
- By 2075
- 3,602,273 · +63.2%
- By 2100
- 3,970,984 · +79.9%
Race, ethnicity, and origin ACS 2023
- Neighborhood character
- Highly diverse neighborhood (Simpson 0.75)
- Race & ethnicity
- White 34% Hispanic / Latino 27% Black 25% Two or more races 24% Asian 2%
- Hispanic origin (detail)
- Mexican 4% Puerto Rican 4% Cuban 4% Dominican 2%
- Common ancestry
- Hispanic 13% Estonian 10% Romanian 1%
- Foreign-born
- 43% · Canada, Jamaica, Dominican Republic
- Languages at home
- 45% English-only · Spanish 23% French/Haitian/Cajun 16% Other Indo-European 13%
Political lean MEDSL · Broward
- 2024 margin
- D (+17.0) · D 58.0% · R 41.0%
- 2008→2024 swing
- -17.8pp toward R · 2008: 34.7pp · 2024: 17.0pp
- All cycles
- 2024: D+17.0 2020: D+29.8 2016: D+35.0 2012: D+34.9 2008: D+34.7
Not yet ingested
- Civics
- —
Market trends
- HPI YoY
- ▼ -109.09%
- Current HPI
- 474.7007
- Rent YoY
- ▲ 1.75%
- Metro
- Miami-Fort Lauderdale-Pompano Beach, FL
- State GDP YoY
- ▲ 3.28%
- F500 in state
- 36
Industry mix (Fortune 500 HQ in FL)
| Industry | F500 HQs | Revenue |
|---|---|---|
| Industrial Technology | 2 | $29B |
|
||
| Insurance | 2 | $17B |
|
||
| Retail | 1 | $60B |
|
||
| Technology Distribution | 1 | $58B |
|
||
| Homebuilding | 1 | $35B |
|
||
| Technology Manufacturing | 1 | $35B |
|
||
Price history
+186.7% since first listed18 events — show timeline
- 2026-03-12 Listed $129,000 Beaches MLS
- 2024-08-18 Listing Removed — MARMLS
- 2024-07-06 Price Changed $167,500 MARMLS
- 2024-06-25 Price Changed $171,500 MARMLS
- 2024-06-09 Price Changed $173,500 MARMLS
- 2024-05-18 Listed $179,000 MARMLS
- 2024-05-17 Listing Removed — MARMLS
- 2024-05-14 Price Changed $179,000 MARMLS
- 2024-03-22 Price Changed $183,000 MARMLS
- 2023-12-03 Price Changed $185,000 MARMLS
- 2023-11-17 Listed $192,000 MARMLS
- 2021-03-25 Sold (Public Records) $105,000 Public Records
- 2021-03-16 Sold (MLS) $105,000 Beaches MLS
- 2021-02-15 Pending — Beaches MLS
- 2020-11-23 Price Changed $110,000 Beaches MLS
- 2020-10-22 Listed $115,000 Beaches MLS
- 2014-04-10 Sold (Public Records) $75,000 Public Records
- 1988-11-15 Sold (Public Records) $45,000 Public Records
Property tax history
+16.9%/yrLatest (2025): $1,595 · +5.6% YoY. Source: county tax records.
Cash-flow waterfall
monthlySold comps — $/sqft
last 12 mo · ≤1 miLoading sold comps…