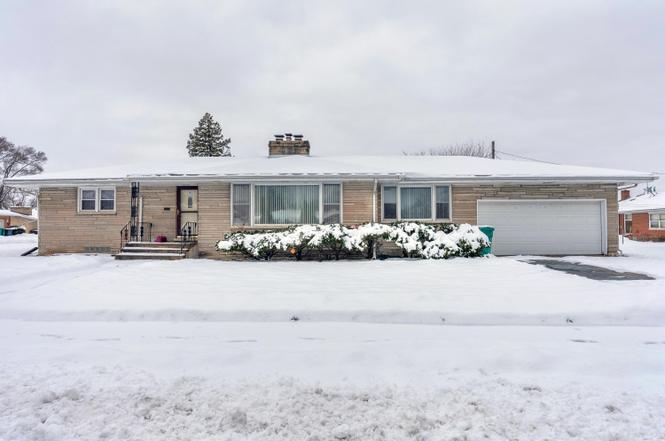
5550 Jefferson Pl · Merrillville, IN
Flood risk 1/10 · Minimal
- FEMA flood zone
- X (unshaded)
- Chance of flooding over 30 yrs
- 0.0%
- Est. flood insurance / yr
- $473 – $860
Fire risk 2/10 · Minimal
- Est. fire insurance / yr
- $717 – $1,331
Heat risk 3/10 · Minor
- Hot days now (above 101°F)
- 7 days/yr
- Hot days in 30 yrs
- 15 days/yr
Wind risk 2/10 · Minimal
- Chance of severe wind over 30 yrs
- 0.0%
Air-quality risk 3/10 · Minor
- Unhealthy air days now
- 2 days/yr
- Unhealthy air days in 30 yrs
- 3 days/yr
Risk factors via First Street. Map © Google.
Why this score? — see what drove the D+ grade
The composite is a weighted blend of 9 inputs, each scored 0–100. Each bar is that input's sub-score; the figure is the points it added to the 100-point composite (weight × sub-score).
- Cash flow +14.1/30.0
- ARV discount +11.6/15.0
- DSCR +4.3/10.0
- Livability +3.8/5.0
- Rent growth +3.5/5.0
- 1% rule +3.2/10.0
- Schools +2.6/10.0
- Condition / age +2.5/5.0
- Appreciation +0.0/10.0
$285,000
🖨 Deal sheet 📄 Offer letter ✓ Due diligence
Listing remarks MLS
Priced has been reduced by $10,000.00. If you so desire this HOME CAN BE YOURS. .. . This all Brick five bedroom, three bath and newly refinished basement home has all the amenities for a large family. This All Brick Home also has two Fire Places one upstairs and one down, along with several large Cedar Closets and a two car attached garage. Seller will contribute $1000.00 towards buyers closing cost and or pre-paids with an accepted offer. This Home is Priced to sell!!!
Key facts
- Finished basement
- Two fireplaces
- 0.24 acre lot
Tags
Neighborhood map
What this means for you Summary
Snapshot
- This is a 5-bed/2.5-bath single-family listed at $285k.
Deal economics
- At list price, monthly cash flow is $42 ($504/yr) — positive.
- The deal already cash-flows at list — no discount required.
- To meet the 1% rule (rent ≥ 1% of price), the offer needs to be $235k (17.5% below list).
- Recommended offer: $235k (17.5% below list) — sets the bar for 1% rule.
- Cap rate 6.5% vs local median 4.7% in Merrillville — top-decile yield for the area; either an underpriced asset or a hidden risk that comps aren't pricing in. Stress-test before assuming the spread holds.
Location & tenants
- Location reads 76/100 on livability (#50 in IN, #3,393 nationally) — a middle-class / working-renter tenant base. Strengths: commute A+, cost of living A+, housing A+; Watch: schools D+, amenities F, health & safety D-.
- Merrillville Community School Corporation (suburban): math 22% / reading 36% proficiency, ranked #240 of 301 in IN (top 80%) — low school quality limits family demand, transient renter base, plan for 1-2y turnover.
- Market conditions: Rents rising fast (+4.1%/yr); 264 active listings in the ZIP; 2 comparable units currently listed for rent nearby; 1,642 units permitted in Lake County in 2024 (14 in 5+ unit buildings).
- This rent runs 44% of the median local income ($64k/yr) — at the standard rent-burdened threshold; future hikes will face affordability resistance.
Forward outlook
- Local home prices are declining (-3.0%/yr); year-one equity from $2k of loan paydown is wiped out by about $9k of value loss. Plan a longer hold.
- Lake County population projected to shrink 7% by 2050 — rents likely to lag national; underwrite the cash flow, not the appreciation.
Negotiation context
- It's been on market 127 days — a 12% lower offer ($251k) is reasonable based on typical stale-listing flexibility.
- 3 sale attempts since 10y ago with the ask held roughly flat each time — persistent listings suggest the price (not the market) is what's stuck; bring a comps-based counter.
- Current owner paid $140k; list at $285k implies a 104% gain — meaningful room to come down on a strong offer.
Risks & watch-outs
- Watch-outs: built in 1956 — expect roof / HVAC / electrical / plumbing capex.
Questions for the listing agent
- It's been on market 127 days. Have you received any prior offers? Is the seller open to a 18% concession, seller financing, or rate buy-down credit?
- Built in 1956 — when were the roof, HVAC, electrical panel, plumbing, and water heater last replaced?
- Why hasn't it sold? Are there any deal-killer items the seller is aware of (foundation, flood, title, zoning, code violations)?
- Is there a deadline driving the sale (1031 exchange, divorce, estate, relocation)? That informs how much negotiation room exists.
- Schools are D-rated, which usually means shorter tenancies and higher turnover. Who's the typical renter profile here, and what's been the actual vacancy rate?
- The area grade is low — what's the realistic commute time and amenity access for the typical tenant pool here? Any planned neighborhood developments (good or bad) we should know about?
- What's the average days-on-market for RENTAL listings here right now (not sales)? A rising rental-DOM trend means longer vacancies and softer asking-rent achievability than the comps imply.
- What's the recent tenant-quality profile in this submarket — average credit score on applications, eviction rate, late-payment / NSF rate, and stable-employment percentage? A property-management company in the area should have these aggregated.
- How much new for-sale + rental construction is in the pipeline within 1–3 miles? Heavy new supply typically softens prices + rents 12–24 months out; constrained supply supports both.
Investment metrics
- 1% rule
- 0.82% ✗
- Cap rate
- 6.47%
- Cash-on-cash
- 0.63%
- DSCR
- 1.03
- GRM
- 10.1
CMA / ARV
- ARV (on-the-fly)
- $313,208
- Comps found
- 9
Show comp detail 9 sales within ~0.75 mi
| Address | Dist | Beds/Ba | Sqft | Sold | Price | $/sf | Match |
|---|---|---|---|---|---|---|---|
| 5555 Adams St | 0.08mi | 4/3.0 (-1) | 3,037 (-5%) | 12mo | $299,999 | $99 | 71 |
| 1241 W 56th Ave | 0.57mi | 4/3.0 (-1) | 3,162 (-1%) | 3mo | $292,000 | $92 | 62 |
| 315 W 56th Pl | 0.14mi | 4/3.0 (-1) | 2,800 (-12%) | 17mo | $274,900 | $98 | 52 |
| 5375 Delaware St | 0.51mi | 5/2.5 | 2,864 (-10%) | 10mo | $264,000 | $92 | 51 |
| 521 E 53rd Ave | 0.60mi | 4/2.0 (-1) | 3,468 (+8%) | 6mo | $240,000 | $69 | 46 |
| 5521 Pierce St | 0.50mi | 4/3.0 (-1) | 2,906 (-9%) | 10mo | $294,900 | $101 | 46 |
| 921 W 56th Pl | 0.43mi | 4/2.0 (-1) | 2,722 (-15%) | 7mo | $301,500 | $111 | 43 |
| 5330 Georgia St | 0.73mi | 4/3.5 (-1) | 3,071 (-4%) | 13mo | $359,000 | $117 | 39 |
| 1421 W 56th Ave | 0.66mi | 4/2.5 (-1) | 3,627 (+14%) | 18mo | $322,875 | $89 | 27 |
Match score weights: distance 35% · size 25% · config 20% · recency 20%. Top-matched comps best support the ARV.
Projected returns pro-forma
-3.0% appreciation · 4.1% rent growth · sell at horizon
- IRR
- -14.2%
- Equity multiple
- 0.49×
- Total profit
- $-40,936
- Equity at exit
- $42,494
- IRR
- -3.9%
- Equity multiple
- 0.73×
- Total profit
- $-21,408
- Equity at exit
- $24,642
Cash invested: $79,800 (down + closing). Projections, not guarantees.
Landlord ↔ Tenant lean methodology
- Overall (STATE)
- 90 Strongly Landlord-Friendly
- State Indiana
- 90 Strongly Landlord-Friendly · R+11
- County
- — inherits STATE
- City
- — inherits STATE
ZIP-level market 46410
- Rents YoY
- 4.1%
- Active inventory
- 264
- Price-to-rent
- 10.1×
Monthly cashflow live
- Estimated rent
- $2,350 medium interval (Pro) →
- Mortgage (P&I)
- −$1,495
- Tax from tax record
- −$201 /mo · $2,416/yr
- Insurance
- −$119
- HOA
- −$0
- Vacancy / Maint / Mgmt
- −$494
- Net cashflow
- $42
Break-even live
UW: 25.0% down · 7.5% · 30yr · 1.5% tax · 5.0% vac · 8.0% maint · 8.0% mgmt
Financing live
Cash to close
- Down payment
- $71,250
- Closing costs
- $8,550
- Reserves months
- —
- Total cash needed
- —
Loan-product check · same deal, 3 products live
Conventional
25% down · 7.5% · 30yr
- Down + closing
- —
- Monthly P&I
- —
- Monthly cashflow
- —
- DSCR
- —
- Eligible?
- —
Personal DTI + credit; lowest rate.
DSCR
20% down · 8.5% · 30yr
- Down + closing
- —
- Monthly P&I
- —
- Monthly cashflow
- —
- DSCR
- —
- Eligible?
- —
No personal income docs; deal must DSCR.
Hard money
10% down · 12.0% · 12mo
- Down + closing
- —
- Monthly P&I
- —
- Monthly cashflow
- —
- DSCR
- —
- Eligible?
- —
Short-term bridge; refi at stabilization.
Rent comps 2 comps
| Address | Beds | Baths | Sqft | Rent | $/sqft | DOM | Units | Dist |
|---|---|---|---|---|---|---|---|---|
| 4800 Monroe St Gary, IN | 4.0 | 2.0 | 2640 | $2,000 | $0.76 | 1d | 1 | 0.99mi |
| 621 W 44th Pl Gary, IN | 5.0 | 3.0 | 2940 | $2,200 | $0.75 | 10d | 1 | 1.43mi |
Listing history 19 events
-
2026-06-18days on market $285,000 Active 127 DOM
-
2026-06-17days on market $285,000 Active 126 DOM
-
2026-06-16days on market $285,000 Active 125 DOM
-
2026-06-15days on market $285,000 Active 124 DOM
-
2026-06-13days on market $285,000 Active 122 DOM
-
2026-06-13days on market $285,000 Active 121 DOM
-
2026-06-09days on market $285,000 Active 118 DOM
-
2026-06-08days on market $285,000 Active 117 DOM
-
2026-06-07days on market $285,000 Active 116 DOM
-
2026-06-04days on market $285,000 Active 113 DOM
-
2026-06-03days on market $285,000 Active 112 DOM
-
2026-06-02days on market $285,000 Active 111 DOM
-
2026-06-02status $285,000 Active 110 DOM
-
2026-04-08status Pending
-
2025-12-19$285,000 Active
-
2016-12-29soldstatus $139,600 475-char remark
Show marketing remark (475 chars)
Priced has been reduced by $10,000.00. If you so desire this HOME CAN BE YOURS. .. . This all Brick five bedroom, three bath and newly refinished basement home has all the amenities for a large family. This All Brick Home also has two Fire Places one upstairs and one down, along with several large Cedar Closets and a two car attached garage. Seller will contribute $1000.00 towards buyers closing cost and or pre-paids with an accepted offer. This Home is Priced to sell!!!
-
2016-10-01$142,000 475-char remark
Show marketing remark (475 chars)
Priced has been reduced by $10,000.00. If you so desire this HOME CAN BE YOURS. .. . This all Brick five bedroom, three bath and newly refinished basement home has all the amenities for a large family. This All Brick Home also has two Fire Places one upstairs and one down, along with several large Cedar Closets and a two car attached garage. Seller will contribute $1000.00 towards buyers closing cost and or pre-paids with an accepted offer. This Home is Priced to sell!!!
-
2016-09-30historical
-
2016-04-01$142,000
ⓘ Source: listings_history table (triggers on properties + properties_extension) + one-shot
backfill from property_details.listing_events for pre-trigger history.
Tax reassessment forecast IN · Partial reset (capped growth)
- Current annual tax
- $2,416 · $201/mo
- Projected year-2 tax
- $2,419 · $202/mo
- Expected delta
- +$3/yr ($0/mo · 0.1%)
ⓘ Screening estimate from a state-policy table — verify with the county assessor before closing.
Climate risk First Street
- Flood 1/10 Low FEMA zone X (unshaded) · 0% chance over 30 yrs
- Wildfire 2/10 Low
- Heat 3/10 Moderate 7 d/yr ≥101°F today · 15 d/yr by 30 yrs out
- Wind 2/10 Low 0% chance of damaging wind over 30 yrs
- Air quality 3/10 Moderate 2 unhealthy d/yr today · 3 by 30 yrs out
Nearby sold comps map
Loading sold comps map…
Walkable amenities ~0.75 mi
Loading nearby amenities…
Taxation est. · year 1
- Rental income
- $28,203
- − Mortgage interest
- −$15,964
- − Property taxes
- −$2,416
- − Insurance
- −$1,425
- − Repairs & maintenance
- −$2,256
- − Management
- −$2,256
- − Depreciation
- −$8,291
- Taxable loss
- −$4,406
- Est. tax savings @ 24.0%
- +$1,057
- After-tax cash flow
- $1,562/yr
For passive investors: Depreciation is non-cash, so a rental often shows a tax loss while cash-flowing — sheltering income. Rental losses are passive: they offset passive income freely, and up to $25,000/yr can offset ordinary (W-2) income if you actively participate and your MAGI is under $100k (phasing out to $0 by $150k); unused losses carry forward. On sale, claimed depreciation is recaptured at up to 25%, and gains may owe capital-gains tax (a 1031 exchange can defer both). Figures are a year-1 estimate at your 24.0% rate — not tax advice; consult a CPA.
Schools (NCES district)
- District
- Merrillville Community School Corporation
- NCES district ID
- 1809690
- Math proficiency
- 22% ▼ -17.00%
- Reading proficiency
- 36% ▼ -8.00%
- Median HH income
- $54,401
- Composite
- 25.74/100
- National rank
- #7375
- State rank
- #240 of 301 in IN
Livability — Merrillville
- Score
- 76/100
- State rank
- #50
- US rank
- #3393
Category grades
Schools grade is shown separately in the Schools card above.
Census & demographics
- Census place
- Merrillville, IN
- County
- Lake County · 422,878 people
- City population
- 39,243
- Metro
- Chicago-Naperville-Elgin, IL-IN-WI
- Population (ZIP)
- 39,243
- Household income
- $64,127
- Rent vs Own
- Severe rent burden
- 1644.0
Population outlook (Lake County) Hauer SSP2
- Today (2025)
- 484,026 people
- By 2030
- 478,091 · -1.2%
- By 2040
- 462,974 · -4.3%
- By 2050
- 449,894 · -7.1%
- By 2075
- 436,169 · -9.9%
- By 2100
- 426,607 · -11.9%
Race, ethnicity, and origin ACS 2023
- Neighborhood character
- Diverse neighborhood (Simpson 0.66)
- Race & ethnicity
- Black 46% White 32% Hispanic / Latino 16% Two or more races 9% Asian 2%
- Hispanic origin (detail)
- Mexican 11% Puerto Rican 3%
- Common ancestry
- Romanian 4% Iranian 2% Italian 1%
- Foreign-born
- 7% · Canada
- Languages at home
- 88% English-only · Spanish 7% Other Indo-European 2%
Political lean MEDSL · Lake
- 2024 margin
- Lean D (+5.6) · D 52.1% · R 46.5% · Other 1.5%
- 2008→2024 swing
- -28.6pp toward R · 2008: 34.3pp · 2024: 5.6pp
- All cycles
- 2024: D+5.6 2020: D+15.1 2016: D+20.6 2012: D+31.0 2008: D+34.3
Not yet ingested
- Civics
- —
Market trends
- HPI YoY
- ▼ -180.11%
- Current HPI
- 240.8833
- Rent YoY
- ▲ 4.10%
- Metro
- Chicago-Naperville-Elgin, IL-IN-WI
- State GDP YoY
- ▲ 2.90%
- F500 in state
- 18
Industry mix (Fortune 500 HQ in IN)
| Industry | F500 HQs | Revenue |
|---|---|---|
| Industrial Machinery | 2 | $37B |
|
||
| Healthcare | 1 | $177B |
|
||
| Pharmaceuticals | 1 | $45B |
|
||
| Metals / Steel | 1 | $18B |
|
||
| Agriculture | 1 | $17B |
|
||
| Packaging | 1 | $12B |
|
||
Price history
+100.7% since first listed6 events — show timeline
- 2026-04-08 Pending — NIRA MLS as Distributed by MLS Grid
- 2025-12-19 Listed $285,000 NIRA MLS as Distributed by MLS Grid
- 2016-12-29 Sold (MLS) $139,600 NIRA MLS as Distributed by MLS Grid
- 2016-10-01 Listed $142,000 NIRA MLS as Distributed by MLS Grid
- 2016-09-30 Listing Removed — NIRA MLS as Distributed by MLS Grid
- 2016-04-01 Listed $142,000 NIRA MLS as Distributed by MLS Grid
Property tax history
+3.0%/yrLatest (2024): $2,416 · +8.0% YoY. Source: county tax records.
Cash-flow waterfall
monthlySold comps — $/sqft
last 12 mo · ≤1 miLoading sold comps…