 🏷️ Likely Rental
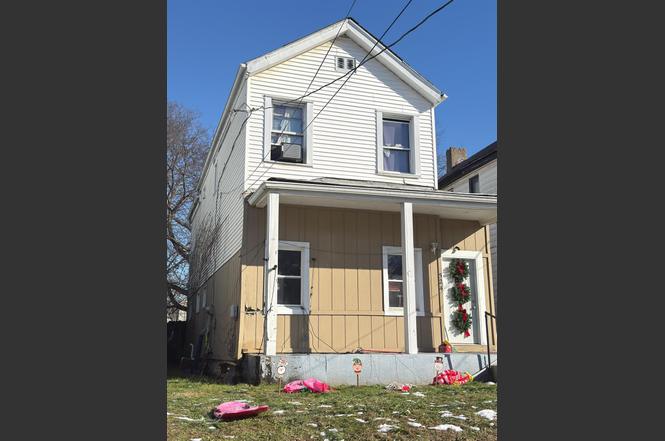
524 Maple St · Elmwood Place, OH
Flood risk 9/10 · Severe
- FEMA flood zone
- X (unshaded)
- Chance of flooding over 30 yrs
- 0.79%
- Est. flood insurance / yr
- $473 – $860
Fire risk 1/10 · Minimal
- Est. fire insurance / yr
- $713 – $1,323
Heat risk 5/10 · Moderate
- Hot days now (above 103°F)
- 7 days/yr
- Hot days in 30 yrs
- 20 days/yr
Wind risk 2/10 · Minimal
- Chance of severe wind over 30 yrs
- 1.0%
Air-quality risk 3/10 · Minor
- Unhealthy air days now
- 2 days/yr
- Unhealthy air days in 30 yrs
- 3 days/yr
Risk factors via First Street. Map © Google.
Why this score? — see what drove the B grade
The composite is a weighted blend of 9 inputs, each scored 0–100. Each bar is that input's sub-score; the figure is the points it added to the 100-point composite (weight × sub-score).
- Cash flow +27.3/30.0
- ARV discount +15.0/15.0
- DSCR +9.5/10.0
- 1% rule +7.3/10.0
- Schools +3.5/10.0
- Livability +3.4/5.0
- Rent growth +2.5/5.0
- Condition / age +2.5/5.0
- Appreciation +0.0/10.0
$119,900
🖨 Deal sheet 📄 Offer letter ✓ Due diligence
Listing remarks
The property is tenant occupied. Current tenant is month to month and pays $1120 plus all utilities. The home is part of a portfolio that can be sold separate or together. Hvac and plumbing have been updated in last 2 years. Electric has been updated in last 5 years.
Key facts
- Plumbing updated
- Hvac updated
- Electric updated
Tags
Property features AI
Finance
- Other: Lease not considered; Property in Elmwood Place
- HOA & community: No HOA
Exterior
- Utilities: Public water; Public sewer; Natural gas; Gas water heating
- Home design: Traditional single-family home; Two levels; Second floor area approximately 660
- Construction: Built with vinyl siding; Foundation: Other
- Exterior features: Vinyl and wood windows; Shingle roof; Vinyl siding; Residential zoning
Interior
- Bedrooms: Two bedrooms (both on second floor)
- Bathrooms: One full bathroom; One half bathroom
- Heating & cooling: Gas heating; Cooling: Other
- Interior features: Six total rooms; Partial basement
Neighborhood map
What this means for you Summary
Snapshot
- This is a 2-bed/2.0-bath single-family listed at $120k.
Deal economics
- At list price, monthly cash flow is $290 ($3k/yr) — positive.
- The deal already cash-flows at list — no discount required.
- Meets the 1% rule at list price ($1k rent vs $120k).
- Recommended offer: $106k (12.0% below list) — sets the bar for market timing.
Location & tenants
- Location reads 68/100 on livability (#553 in OH) — a middle-class / working-renter tenant base. Strengths: commute A+, cost of living A+, housing B; Watch: employment D+, schools F, crime F.
- St Bernard-Elmwood Place City (suburban): math 36% / reading 48% proficiency, ranked #529 of 656 in OH (top 81%) — families likely to look elsewhere, expect single-tenant / working-renter base with shorter leases; 69% free/reduced lunch — lower-income household profile, screen leases tightly.
- Market conditions: 19 active listings in the ZIP; 6 comparable units currently listed for rent nearby; rentals at typical pace (median 24d on market — plan ~3-4 weeks tenant-placement turnaround); lower-income renter base — watch delinquency; 801 units permitted in Hamilton County in 2024 (190 in 5+ unit buildings).
- This rent runs 40% of the median local income ($44k/yr) — at the standard rent-burdened threshold; future hikes will face affordability resistance.
Forward outlook
- Local home prices are declining (-3.0%/yr); year-one equity from $829 of loan paydown is wiped out by about $4k of value loss. Plan a longer hold.
Negotiation context
- It's been on market 126 days — a 12% lower offer ($106k) is reasonable based on typical stale-listing flexibility.
- 8 sale attempts since 24y ago; this cycle's ask has dropped $20k (14%) from the opening price — seller is motivated, your offer sets the floor, not the list.
- Current owner paid $72k; list at $120k implies a 68% gain — meaningful room to come down on a strong offer.
Risks & watch-outs
- Watch-outs: flood insurance adds $56/mo; built in 1900 — expect roof / HVAC / electrical / plumbing capex.
- Climate carrying-cost: severe flood risk; extreme-heat days projected 7→20/yr by 2055 (HVAC capex compounding) — expect insurance premiums to compound above CPI over the hold.
Questions for the listing agent
- It's been on market 126 days. Have you received any prior offers? Is the seller open to a 12% concession, seller financing, or rate buy-down credit?
- Built in 1900 — when were the roof, HVAC, electrical panel, plumbing, and water heater last replaced?
- What's the actual annual flood-insurance premium (NFIP or private), and is the property in a SFHA with mandatory coverage?
- Why hasn't it sold? Are there any deal-killer items the seller is aware of (foundation, flood, title, zoning, code violations)?
- Is there a deadline driving the sale (1031 exchange, divorce, estate, relocation)? That informs how much negotiation room exists.
- Schools are F-rated, which usually means shorter tenancies and higher turnover. Who's the typical renter profile here, and what's been the actual vacancy rate?
- Crime grade is F in this area — have there been break-ins, vandalism, or insurance claims at this property in the last 3 years? What carrier currently insures it and at what premium?
- What's the average days-on-market for RENTAL listings here right now (not sales)? A rising rental-DOM trend means longer vacancies and softer asking-rent achievability than the comps imply.
- What's the recent tenant-quality profile in this submarket — average credit score on applications, eviction rate, late-payment / NSF rate, and stable-employment percentage? A property-management company in the area should have these aggregated.
- How much new for-sale + rental construction is in the pipeline within 1–3 miles? Heavy new supply typically softens prices + rents 12–24 months out; constrained supply supports both.
Investment metrics
- 1% rule
- 1.23% ✓
- Cap rate
- 9.75%
- Cash-on-cash
- 12.35%
- DSCR
- 1.55
- GRM
- 6.8
CMA / ARV
- ARV (on-the-fly)
- $165,312
- Comps found
- 12
Show comp detail 12 sales within ~0.75 mi
| Address | Dist | Beds/Ba | Sqft | Sold | Price | $/sf | Match |
|---|---|---|---|---|---|---|---|
| 6310 Vine St | 0.20mi | 2/2.0 | 1,509 (+2%) | 1mo | $105,000 | $70 | 86 |
| 412 Walnut St | 0.12mi | 3/2.0 (+1) | 1,422 (-4%) | 2mo | $159,900 | $112 | 81 |
| 3 Linden St | 0.45mi | 2/1.0 | 1,469 (-0%) | 6mo | $152,500 | $104 | 70 |
| 404 Oak St | 0.14mi | 3/1.0 (+1) | 1,360 (-8%) | 9mo | $171,000 | $126 | 64 |
| 203 W Sixty Ninth St | 0.43mi | 3/2.0 (+1) | 1,451 (-2%) | 10mo | $115,000 | $79 | 64 |
| 6106 Sycamore St | 0.35mi | 3/1.5 (+1) | 1,560 (+6%) | 4mo | $176,000 | $113 | 64 |
| 223 Linden St | 0.32mi | 3/1.0 (+1) | 1,382 (-6%) | 6mo | $89,000 | $64 | 60 |
| 120 W Seventy Second St | 0.53mi | 3/1.5 (+1) | 1,541 (+4%) | 2mo | $200,000 | $130 | 60 |
| 5653 Prosser Ave | 0.50mi | 3/2.0 (+1) | 1,555 (+5%) | 8mo | $125,000 | $80 | 56 |
| 6617 Fairpark Ave | 0.27mi | 3/2.0 (+1) | 1,680 (+14%) | 4mo | $235,000 | $140 | 56 |
| 310 Beech St | 0.24mi | 3/1.0 (+1) | 1,274 (-14%) | 8mo | $175,000 | $137 | 50 |
| 133 W Seventy Third St | 0.74mi | 3/2.0 (+1) | 1,536 (+4%) | 9mo | $160,000 | $104 | 46 |
Match score weights: distance 35% · size 25% · config 20% · recency 20%. Top-matched comps best support the ARV.
Projected returns pro-forma
-3.0% appreciation · 3.0% rent growth · sell at horizon
- IRR
- -0.7%
- Equity multiple
- 0.97×
- Total profit
- $-906
- Equity at exit
- $17,877
- IRR
- 9.0%
- Equity multiple
- 1.69×
- Total profit
- $23,207
- Equity at exit
- $10,367
Cash invested: $33,572 (down + closing). Projections, not guarantees.
Landlord ↔ Tenant lean methodology
- Overall (STATE)
- 73 Landlord-Friendly
- State Ohio
- 73 Landlord-Friendly · R+6
- County
- — inherits STATE
- City
- — inherits STATE
ZIP-level market 45216
- Home prices YoY
- -19.1%
- Active inventory
- 19
- Price-to-rent
- 6.8×
Monthly cashflow live
- Estimated rent
- $1,477 high interval (Pro) →
- Mortgage (P&I)
- −$629
- Tax from tax record
- −$143 /mo · $1,714/yr
- Insurance
- −$50
- Flood insurance flood zone
- −$56 /mo · $666/yr
- HOA
- −$0
- Vacancy / Maint / Mgmt
- −$310
- Net cashflow
- $290
Break-even live
UW: 25.0% down · 7.5% · 30yr · 1.5% tax · 5.0% vac · 8.0% maint · 8.0% mgmt
Financing live
Cash to close
- Down payment
- $29,975
- Closing costs
- $3,597
- Reserves months
- —
- Total cash needed
- —
Loan-product check · same deal, 3 products live
Conventional
25% down · 7.5% · 30yr
- Down + closing
- —
- Monthly P&I
- —
- Monthly cashflow
- —
- DSCR
- —
- Eligible?
- —
Personal DTI + credit; lowest rate.
DSCR
20% down · 8.5% · 30yr
- Down + closing
- —
- Monthly P&I
- —
- Monthly cashflow
- —
- DSCR
- —
- Eligible?
- —
No personal income docs; deal must DSCR.
Hard money
10% down · 12.0% · 12mo
- Down + closing
- —
- Monthly P&I
- —
- Monthly cashflow
- —
- DSCR
- —
- Eligible?
- —
Short-term bridge; refi at stabilization.
Rent comps 6 comps
| Address | Beds | Baths | Sqft | Rent | $/sqft | DOM | Units | Dist |
|---|---|---|---|---|---|---|---|---|
| 6305 Vine St Unit 2 Cincinnati, OH | 2.0 | 1.0 | 900 | $1,100 | $1.22 | 23d | 1 | 0.17mi |
| 113 W 66th St Cincinnati, OH | 3.0 | 2.0 | 1166 | $1,800 | $1.54 | 4d | 1 | 0.21mi |
| 409 Locust St Cincinnati, OH | 1.0 | 1.0 | 1728 | $1,600 | $0.93 | 23d | 1 | 0.23mi |
| 5912 Elmwood Ave Cincinnati, OH | 3.0 | 1.0 | 1323 | $1,450 | $1.10 | 4d | 1 | 0.32mi |
| 1231 Laidlaw Ave Unit 3 Cincinnati, OH | 2.0 | 1.0 | 900 | $1,550 | $1.72 | 23d | 1 | 1.09mi |
| 1500 Yarmouth Ave Unit 2 Cincinnati, OH | 1.0 | 1.0 | 899 | $800 | $0.89 | 17d | 1 | 1.41mi |
Listing history 31 events
-
2026-06-18days on market $119,900 Active 126 DOM
-
2026-06-17days on market $119,900 Active 125 DOM
-
2026-06-16days on market $119,900 Active 124 DOM
-
2026-06-15days on market $119,900 Active 123 DOM
-
2026-06-13days on market $119,900 Active 121 DOM
-
2026-06-09days on market $119,900 Active 117 DOM
-
2026-06-08days on market $119,900 Active 116 DOM
-
2026-06-07days on market $119,900 Active 115 DOM
-
2026-06-05days on market $119,900 Active 112 DOM
-
2026-06-03days on market $119,900 Active 111 DOM
-
2026-06-02days on market $119,900 Active 110 DOM
-
2026-06-01days on market $119,900 Active 109 DOM
-
2026-05-31days on market $119,900 Active 108 DOM
-
2026-04-20price $119,900
-
2026-02-12$139,900 Active
-
2020-11-14historical
-
2020-05-15$90,000 Active
-
2009-09-30historical
-
2009-03-29$69,900
-
2008-10-05historical
-
2008-04-04$78,900
-
2006-01-31soldstatus $71,500
-
2006-01-25soldstatus $71,500
-
2005-07-14$69,900
-
2005-01-28soldstatus $24,900
-
2004-12-27$24,900
-
2004-12-02historical
-
2004-05-03$27,900
-
2003-01-02historical
-
2002-12-17$44,100
-
1998-10-01soldstatus $47,000
ⓘ Source: listings_history table (triggers on properties + properties_extension) + one-shot
backfill from property_details.listing_events for pre-trigger history.
Tax reassessment forecast OH · Partial reset (capped growth)
- Current annual tax
- $1,714 · $143/mo
- Projected year-2 tax
- $1,792 · $149/mo
- Expected delta
- +$78/yr (+$7/mo · 4.6%)
ⓘ Screening estimate from a state-policy table — verify with the county assessor before closing.
Climate risk First Street
- Flood 9/10 Extreme FEMA zone X (unshaded) · 79% chance over 30 yrs
- Wildfire 1/10 Low
- Heat 5/10 Major 7 d/yr ≥103°F today · 20 d/yr by 30 yrs out
- Wind 2/10 Low 100% chance of damaging wind over 30 yrs
- Air quality 3/10 Moderate 2 unhealthy d/yr today · 3 by 30 yrs out
Nearby sold comps map
Loading sold comps map…
Walkable amenities ~0.75 mi
Loading nearby amenities…
Taxation est. · year 1
- Rental income
- $17,728
- − Mortgage interest
- −$6,716
- − Property taxes
- −$1,714
- − Insurance
- −$1,266
- − Repairs & maintenance
- −$1,418
- − Management
- −$1,418
- − Depreciation
- −$3,488
- Taxable income
- $1,708
- Est. tax owed @ 24.0%
- −$410
- After-tax cash flow
- $3,070/yr
For passive investors: Depreciation is non-cash, so a rental often shows a tax loss while cash-flowing — sheltering income. Rental losses are passive: they offset passive income freely, and up to $25,000/yr can offset ordinary (W-2) income if you actively participate and your MAGI is under $100k (phasing out to $0 by $150k); unused losses carry forward. On sale, claimed depreciation is recaptured at up to 25%, and gains may owe capital-gains tax (a 1031 exchange can defer both). Figures are a year-1 estimate at your 24.0% rate — not tax advice; consult a CPA.
Schools (NCES district)
- District
- St Bernard-Elmwood Place City
- NCES district ID
- 3904471
- Math proficiency
- 36% ▼ -11.00%
- Reading proficiency
- 48% ▼ -9.00%
- Median HH income
- $41,587
- Composite
- 35.3/100
- National rank
- #4966
- State rank
- #529 of 656 in OH
Livability — Elmwood Place
- Score
- 68/100
- State rank
- #553
- US rank
- #9449
Category grades
Schools grade is shown separately in the Schools card above.
Census & demographics
- Census place
- Elmwood Place, OH
- County
- Hamilton County · 701,295 people
- Metro
- Cincinnati, OH-KY-IN
- Population (ZIP)
- 9,569
- Household income
- $44,099
- Rent vs Own
- Severe rent burden
- 407.0
Population outlook (Hamilton County) Hauer SSP2
- Today (2025)
- 826,054 people
- By 2030
- 830,947 · +0.6%
- By 2040
- 832,319 · +0.8%
- By 2050
- 822,428 · -0.4%
- By 2075
- 788,688 · -4.5%
- By 2100
- 710,674 · -14.0%
Race, ethnicity, and origin ACS 2023
- Neighborhood character
- Diverse neighborhood (Simpson 0.63)
- Race & ethnicity
- White 56% Black 20% Hispanic / Latino 15% Two or more races 10%
- Hispanic origin (detail)
- Mexican 5%
- Common ancestry
- Romanian 2% Serbian 2% Iranian 1%
- Foreign-born
- 12% · Canada, Guatemala
- Languages at home
- 88% English-only · Spanish 11%
Political lean MEDSL · Hamilton
- 2024 margin
- D (+14.9) · D 57.0% · R 42.1%
- 2008→2024 swing
- +7.9pp toward D · 2008: 7.0pp · 2024: 14.9pp
- All cycles
- 2024: D+14.9 2020: D+15.9 2016: D+9.5 2012: D+4.9 2008: D+7.0
Not yet ingested
- Civics
- —
Market trends
- HPI YoY
- ▼ -58.73%
- Current HPI
- 248.8995
- Rent YoY
- —
- Metro
- Cincinnati, OH-KY-IN
- State GDP YoY
- ▲ 1.98%
- F500 in state
- 48
Industry mix (Fortune 500 HQ in OH)
| Industry | F500 HQs | Revenue |
|---|---|---|
| Insurance | 3 | $145B |
|
||
| Industrial Machinery | 3 | $49B |
|
||
| Financial Services | 3 | $24B |
|
||
| Consumer Goods | 2 | $93B |
|
||
| Aerospace / Defense | 2 | $47B |
|
||
| Utilities | 2 | $33B |
|
||
Price history
+155.1% since first listed18 events — show timeline
- 2026-04-20 Price Changed $119,900 Cincy MLS
- 2026-02-12 Listed $139,900 Cincy MLS
- 2020-11-14 Listing Removed — Cincy MLS
- 2020-05-15 Listed $90,000 Cincy MLS
- 2009-09-30 Listing Removed — Cincy MLS
- 2009-03-29 Listed $69,900 Cincy MLS
- 2008-10-05 Listing Removed — Cincy MLS
- 2008-04-04 Listed $78,900 Cincy MLS
- 2006-01-31 Sold (Public Records) $71,500 Public Records
- 2006-01-25 Sold (MLS) $71,500 Cincy MLS
- 2005-07-14 Listed $69,900 Cincy MLS
- 2005-01-28 Sold (MLS) $24,900 Cincy MLS
- 2004-12-27 Listed $24,900 Cincy MLS
- 2004-12-02 Listing Removed — Cincy MLS
- 2004-05-03 Listed $27,900 Cincy MLS
- 2003-01-02 Listing Removed — Cincy MLS
- 2002-12-17 Listed $44,100 Cincy MLS
- 1998-10-01 Sold (Public Records) $47,000 Public Records
Property tax history
+4.8%/yrLatest (2025): $1,714 · +1.1% YoY. Source: county tax records.
Cash-flow waterfall
monthlySold comps — $/sqft
last 12 mo · ≤1 miLoading sold comps…