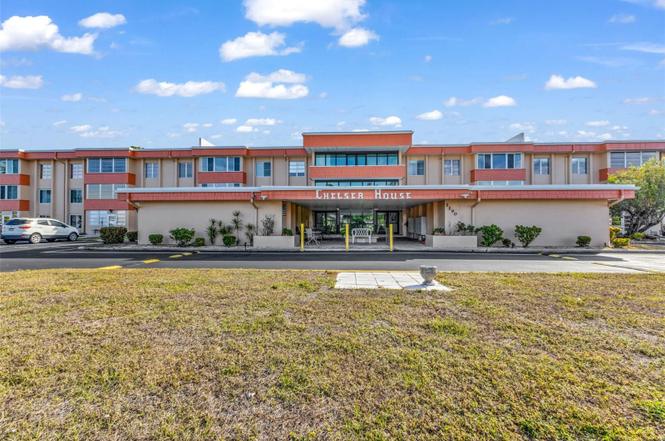
2290 Aaron St #109 · Port Charlotte, FL
Flood risk No data
- FEMA flood zone
- —
- Chance of flooding over 30 yrs
- —
- Est. flood insurance / yr
- —
Fire risk No data
- Est. fire insurance / yr
- —
Heat risk No data
- Hot days now (above threshold)
- —
- Hot days in 30 yrs
- —
Wind risk No data
- Chance of severe wind over 30 yrs
- —
Air-quality risk No data
- Unhealthy air days now
- —
- Unhealthy air days in 30 yrs
- —
Risk factors via First Street. Map © Google.
Why this score? — see what drove the D grade
The composite is a weighted blend of 9 inputs, each scored 0–100. Each bar is that input's sub-score; the figure is the points it added to the 100-point composite (weight × sub-score).
- Cash flow +10.3/30.0
- 1% rule +9.0/10.0
- ARV discount +7.5/15.0
- Schools +4.6/10.0
- Livability +3.2/5.0
- DSCR +2.9/10.0
- Condition / age +2.5/5.0
- Rent growth +2.2/5.0
- Appreciation +0.0/10.0
$103,000
🖨 Deal sheet (PDF) 📄 Offer letter ✓ Due diligence
Listing remarks
Welcome to Chelsea House, a beautifully and professionally remodeled, custom-upgraded first-floor condominium featuring a private side entrance, ideal for creating a secluded outdoor patio space with added privacy. This 2-bedroom, 2-bath residence offers a desirable single-level layout with 919 square feet of thoughtfully designed living space—perfect for full-time living or a seasonal retreat. The bright, open-concept floor plan seamlessly connects the kitchen, dining, and living areas, creating a welcoming space ideal for entertaining. The completely updated kitchen features new cabinetry, new countertops, a stylish backsplash, and GE stainless steel appliances, including a range, v
Key facts
- New ac unit
- New water heater
- New appliances
Tags
Property features AI
Finance
- Other: Unfurnished
- Financial info: Total monthly fees: $460; Total annual fees: $5,520; Lease restrictions apply
- HOA & community: HOA: CHELSEA HOUSE (monthly fee $460); HOA fee includes: Pool, escrow reserves, grounds maintenance, management, sewer, trash and other items; Association amenities: Elevator(s), fitness center, maintenance, pickleball court(s), pool, recreation facilities, shuffleboard court, storage; Association approval required; Buyer approval required for community; Clubhouse, community mailbox, sidewalks, wheelchair access; Senior community; No pets allowed
Exterior
- Parking: Carport (1 space)
- Utilities: Private water; Public sewer; Electricity connected; Water connected; Sewer connected; High-speed internet available
- Home design: Residential condominium; Completed condition; One level; Faces west; Located in CHELSEA HOUSE
- Construction: Stucco exterior; Membrane roof; Slab foundation
- Exterior features: Other exterior features; Membrane roof; Stucco construction; Asphalt road access
Interior
- Kitchen: Other appliances
- Bedrooms: 2 bedrooms
- Flooring: Other flooring
- Bathrooms: 2 full bathrooms
- Heating & cooling: Other heating; Other cooling
- Interior features: Elevator in building; Other interior features
- Laundry & utility: Laundry: Other
Neighborhood map
What this means for you Summary
Snapshot
- This is a 2-bed/2.0-bath condo listed at $103k.
Deal economics
- At list price, monthly cash flow is $-57 ($-685/yr) — negative.
- To cash-flow at today's rent, offer at most $93k (9.8% below list).
- Meets the 1% rule at list price ($1k rent vs $103k).
- Recommended offer: $91k (12.0% below list) — sets the bar for market timing.
- Cap rate 5.6% vs local median 4.2% in Port Charlotte — top-decile yield for the area; either an underpriced asset or a hidden risk that comps aren't pricing in. Stress-test before assuming the spread holds.
Location & tenants
- Location reads 65/100 on livability (#655 in FL) — a middle-class / working-renter tenant base. Strengths: cost of living A+, housing A+; Watch: employment D, amenities F, commute F.
- Charlotte (suburban): math 54% / reading 54% proficiency, ranked #22 of 73 in FL (top 30%) — acceptable for families but not a draw, mixed tenant base, ~2y average lease.
- Zoned schools: Peace River Elementary School (math 56% / reading 54%, grade C, #872 of 2,144 statewide, top 42%, 581 students, 64% FRL); Port Charlotte Middle School (math 59% / reading 50%, grade B-, #183 of 571 statewide, top 34%, 877 students, 55% FRL); Port Charlotte High School (math 23% / reading 38%, grade F, #434 of 667 statewide, top 66%, 1,649 students, 43% FRL) — zoned schools at 54% FRL track the district average.
- Market conditions: Rents soft (-1.4%/yr); 712 active listings in the ZIP; 26 comparable units currently listed for rent nearby; rentals at typical pace (median 23d on market — plan ~3-4 weeks tenant-placement turnaround); 4,585 units permitted in Charlotte County in 2024 (703 in 5+ unit buildings).
Forward outlook
- Local home prices are declining (-3.0%/yr); year-one equity from $712 of loan paydown is wiped out by about $3k of value loss. Plan a longer hold.
- Charlotte County population projected at +24% by 2050 — long-run rental-demand tailwind backs the buy-and-hold thesis.
Negotiation context
- It's been on market 149 days — a 12% lower offer ($91k) is reasonable based on typical stale-listing flexibility.
- Current owner paid $50k; list at $103k implies a 106% gain — meaningful room to come down on a strong offer.
Risks & watch-outs
- Watch-outs: HOA is 32% of rent.
Questions for the listing agent
- What do current leases actually rent for vs. the listed asking? Can we see a recent rent roll and the last 12 months of T-12 income?
- It's been on market 149 days. Have you received any prior offers? Is the seller open to a 12% concession, seller financing, or rate buy-down credit?
- Built in 1975 — when were the roof, HVAC, electrical panel, plumbing, and water heater last replaced?
- What does the HOA fee cover, when was the last increase, and are there any pending special assessments or reserve-fund shortfalls?
- Any open or pending special assessments — roof, HVAC, plumbing, elevator, façade? What's the per-unit balance and payoff schedule, and is the seller paying it off at close or rolling it to the buyer?
- Why hasn't it sold? Are there any deal-killer items the seller is aware of (foundation, flood, title, zoning, code violations)?
- Is there a deadline driving the sale (1031 exchange, divorce, estate, relocation)? That informs how much negotiation room exists.
- Schools are D-rated, which usually means shorter tenancies and higher turnover. Who's the typical renter profile here, and what's been the actual vacancy rate?
- The area grade is low — what's the realistic commute time and amenity access for the typical tenant pool here? Any planned neighborhood developments (good or bad) we should know about?
- What's the average days-on-market for RENTAL listings here right now (not sales)? A rising rental-DOM trend means longer vacancies and softer asking-rent achievability than the comps imply.
- What's the recent tenant-quality profile in this submarket — average credit score on applications, eviction rate, late-payment / NSF rate, and stable-employment percentage? A property-management company in the area should have these aggregated.
- How much new apartment / multifamily construction is in the pipeline within 1–3 miles? Heavy new supply (>2% of stock underway) typically softens rents 12–24 months out; light construction supports rent growth.
Investment metrics
- 1% rule
- 1.40% ✓
- Cap rate
- 5.63%
- Cash-on-cash
- -2.37%
- DSCR
- 0.89
- GRM
- 5.9
CMA / ARV
No comps found within radius.
Projected returns pro-forma
-3.0% appreciation · 0.0% rent growth · sell at horizon
- IRR
- -25.9%
- Equity multiple
- 0.16×
- Total profit
- $-24,234
- Equity at exit
- $15,358
- IRR
- -56.8%
- Equity multiple
- -0.42×
- Total profit
- $-40,823
- Equity at exit
- $8,906
Cash invested: $28,840 (down + closing). Projections, not guarantees.
Landlord ↔ Tenant lean methodology
- Overall (STATE)
- 87 Strongly Landlord-Friendly
- State Florida
- 87 Strongly Landlord-Friendly · R+3
- County
- — inherits STATE
- City
- — inherits STATE
ZIP-level market 33952
- Home prices YoY
- -4.8%
- Rents YoY
- -1.4%
- Active inventory
- 712
- Price-to-rent
- 5.9×
Monthly cashflow live
- Estimated rent
- $1,443 high interval (Pro) →
- Mortgage (P&I)
- −$540
- Tax from tax record
- −$154 /mo · $1,845/yr
- Insurance
- −$43
- HOA
- −$460
- Vacancy / Maint / Mgmt
- −$303
- Net cashflow
- $-57
Break-even live
Sensitivity live
| Price | -10% $1 | -5% $-28 | +0% $-57 | +5% $-86 | +10% $-115 |
|---|---|---|---|---|---|
| Rent | -10% $-171 | -5% $-114 | +0% $-57 | +5% $0 | +10% $57 |
| Rate | -1.0pp $-5 | -0.5pp $-31 | base $-57 | +0.5pp $-84 | +1.0pp $-111 |
UW: 25.0% down · 7.5% · 30yr · 1.5% tax · 5.0% vac · 8.0% maint · 8.0% mgmt
Financing live
Cash to close
- Down payment
- $25,750
- Closing costs
- $3,090
- Reserves months
- —
- Total cash needed
- —
Loan-product check · same deal, 3 products live
Conventional
25% down · 7.5% · 30yr
- Down + closing
- —
- Monthly P&I
- —
- Monthly cashflow
- —
- DSCR
- —
- Eligible?
- —
Personal DTI + credit; lowest rate.
DSCR
20% down · 8.5% · 30yr
- Down + closing
- —
- Monthly P&I
- —
- Monthly cashflow
- —
- DSCR
- —
- Eligible?
- —
No personal income docs; deal must DSCR.
Hard money
10% down · 12.0% · 12mo
- Down + closing
- —
- Monthly P&I
- —
- Monthly cashflow
- —
- DSCR
- —
- Eligible?
- —
Short-term bridge; refi at stabilization.
Rent comps 26 comps
| Address | Beds | Baths | Sqft | Rent | $/sqft | DOM | Units | Dist |
|---|---|---|---|---|---|---|---|---|
| 2300 Aaron St #114 Port Charlotte, FL | 2.0 | 2.0 | 869 | $1,250 | $1.44 | 23d | 1 | 0.07mi |
| 21280 Brinson Ave Port Charlotte, FL | 1.0 | 1.0 | 650 | $1,000 | $1.54 | 23d | 1 | 0.08mi |
| 21150 Gertrude Ave Unit F-6 Port Charlotte, FL | 1.0 | 1.0 | 550 | $1,150 | $2.09 | 23d | 1 | 0.17mi |
| 2425 Caring Way Unit 205 Port Charlotte, FL | 2.0 | 2.0 | 900 | $1,400 | $1.56 | 23d | 1 | 0.18mi |
| 2456 Elkcam Blvd Port Charlotte, FL | 2.0 | 2.0 | 1015 | $1,700 | $1.67 | 23d | 1 | 0.22mi |
| 3006 Caring Way Port Charlotte, FL | 1.0–2.0 | 1.0–2.0 | 708 | $2,500 | $3.53 | 23d | 3 | 0.25mi |
| 3006 Caring Way Port Charlotte, FL | 2.0 | 2.0 | 783 | $2,050 | $2.62 | 15d | 2 | 0.25mi |
| 21322 Stillwater Ave Port Charlotte, FL | 2.0 | 1.0 | 1080 | $1,300 | $1.20 | 23d | 1 | 0.26mi |
| 21405 Olean Blvd Port Charlotte, FL | 1.0–2.0 | 1.0–2.0 | 708 | $1,445 | $2.04 | 23d | 2 | 0.38mi |
| 21405 Olean Blvd #511 Port Charlotte, FL | 1.0 | 1.0 | 634 | $1,445 | $2.28 | 15d | 1 | 0.38mi |
| 2472 Picnic St Port Charlotte, FL | 2.0 | 2.0 | 990 | $1,575 | $1.59 | 23d | 1 | 0.42mi |
| 3100 Harbor Blvd Port Charlotte, FL | 2.0 | 1.0–1.5 | 994 | $1,472 | $1.48 | 23d | 2 | 0.47mi |
| 21155 Meehan Ave Port Charlotte, FL | 3.0 | 1.0 | 1060 | $1,300 | $1.23 | 23d | 1 | 0.49mi |
| 21440 Mallory Ave Port Charlotte, FL | 2.0 | 1.0 | 930 | $1,550 | $1.67 | 23d | 1 | 0.51mi |
| 3126 Harbor Blvd Unit 3A Port Charlotte, FL | 2.0 | 2.0 | 1100 | $1,500 | $1.36 | 15d | 1 | 0.52mi |
| 164 Tradewinds Dr NW Port Charlotte, FL | 2.0 | 1.0 | 750 | $1,350 | $1.80 | 23d | 1 | 0.58mi |
| 21061 Midway Blvd Port Charlotte, FL | 2.0 | 1.0 | 897 | $1,600 | $1.78 | 23d | 1 | 0.64mi |
| 21026 Glendale Ave Port Charlotte, FL | 2.0 | 1.0 | 812 | $1,400 | $1.72 | 23d | 1 | 0.65mi |
| 3108 Whiting Ln Port Charlotte, FL | 2.0 | 1.0 | 828 | $1,350 | $1.63 | 23d | 1 | 0.69mi |
| 21499 Glendale Ave Port Charlotte, FL | 3.0 | 1.0 | 1077 | $1,600 | $1.49 | 23d | 1 | 0.72mi |
| 394 Ferris Dr NW Port Charlotte, FL | 3.0 | 2.0 | 842 | $1,395 | $1.66 | 23d | 1 | 0.74mi |
| 22086 Beverly Ave Port Charlotte, FL | 2.0 | 1.0 | 1031 | $1,250 | $1.21 | 23d | 1 | 0.80mi |
| 22070 Gatewood Ave Port Charlotte, FL | 2.0 | 1.0 | 812 | $1,350 | $1.66 | 15d | 1 | 0.90mi |
| 3460 Normandy Dr Port Charlotte, FL | 2.0 | 1.0 | 695 | $1,490 | $2.14 | 23d | 1 | 1.05mi |
| 22203 Lasalle Rd Port Charlotte, FL | 2.0 | 1.0 | 874 | $1,325 | $1.52 | 23d | 1 | 1.15mi |
| 1636 Hayworth Rd Port Charlotte, FL | 2.0 | 2.0 | 884 | $1,300 | $1.47 | 23d | 1 | 1.50mi |
HOA detail condo
- Monthly dues
- $460 · $5,520/yr
- Assessments
- None detected in remarks — confirm with the listing agent.
Listing history 20 events
-
2026-06-22days on market $103,000 Active 149 DOM
-
2026-06-18days on market $103,000 Active 146 DOM
-
2026-06-17days on market $103,000 Active 145 DOM
-
2026-06-16days on market $103,000 Active 144 DOM
-
2026-06-15days on market $103,000 Active 143 DOM
-
2026-06-14days on market $103,000 Active 141 DOM
-
2026-06-13days on market $103,000 Active 140 DOM
-
2026-06-10days on market $103,000 Active 138 DOM
-
2026-06-09days on market $103,000 Active 137 DOM
-
2026-06-08days on market $103,000 Active 136 DOM
-
2026-06-05days on market $103,000 Active 132 DOM
-
2026-06-03days on market $103,000 Active 131 DOM
-
2026-06-02days on market $103,000 Active 130 DOM
-
2026-06-01days on market $103,000 Active 129 DOM
-
2026-05-31days on market $103,000 Active 128 DOM
-
2026-05-30days on market $103,000 Active 127 DOM
-
2026-03-11price $108,000
-
2026-01-23$115,000 Active
-
1989-12-01soldstatus $50,000
-
1989-12-01soldstatus $50,000
ⓘ Source: listings_history table (triggers on properties + properties_extension) + one-shot
backfill from property_details.listing_events for pre-trigger history.
Tax reassessment forecast FL · Resets to sale price
- Current annual tax
- $1,845 · $154/mo
- Projected year-2 tax
- $1,845 · $154/mo
- Expected delta
- $0/yr ($0/mo · 0.0%)
ⓘ Screening estimate from a state-policy table — verify with the county assessor before closing.
Nearby sold comps map
Loading sold comps map…
Walkable amenities ~0.75 mi
Loading nearby amenities…
Taxation est. · year 1
- Rental income
- $17,312
- − Mortgage interest
- −$5,770
- − Property taxes
- −$1,845
- − Insurance
- −$515
- − Repairs & maintenance
- −$1,385
- − Management
- −$1,385
- − HOA
- −$5,520
- − Depreciation
- −$2,996
- Taxable loss
- −$2,104
- Est. tax savings @ 24.0%
- +$505
- After-tax cash flow
- $-180/yr
For passive investors: Depreciation is non-cash, so a rental often shows a tax loss while cash-flowing — sheltering income. Rental losses are passive: they offset passive income freely, and up to $25,000/yr can offset ordinary (W-2) income if you actively participate and your MAGI is under $100k (phasing out to $0 by $150k); unused losses carry forward. On sale, claimed depreciation is recaptured at up to 25%, and gains may owe capital-gains tax (a 1031 exchange can defer both). Figures are a year-1 estimate at your 24.0% rate — not tax advice; consult a CPA.
Schools (NCES district)
- District
- Charlotte
- NCES district ID
- 1200240
- Math proficiency
- 54% ▼ -6.00%
- Reading proficiency
- 54% ▼ -1.00%
- Median HH income
- $44,864
- Composite
- 45.62/100
- National rank
- #2586
- State rank
- #22 of 73 in FL
Livability — Port Charlotte
- Score
- 65/100
- State rank
- #655
- US rank
- #13081
Category grades
Schools grade is shown separately in the Schools card above.
Census & demographics
- Census place
- Port Charlotte, FL
- County
- Charlotte County · 196,994 people
- City population
- 102,180
- Metro
- Punta Gorda, FL
- Population (ZIP)
- 35,231
- Household income
- $61,382
- Rent vs Own
- Severe rent burden
- 733.0
Population outlook (Charlotte County) Hauer SSP2
- Today (2025)
- 198,646 people
- By 2030
- 210,507 · +6.0%
- By 2040
- 230,857 · +16.2%
- By 2050
- 247,148 · +24.4%
- By 2075
- 281,777 · +41.8%
- By 2100
- 293,609 · +47.8%
Race, ethnicity, and origin ACS 2023
- Neighborhood character
- Predominantly White (76%)
- Race & ethnicity
- White 76% Hispanic / Latino 14% Two or more races 8% Black 6% Asian 2%
- Hispanic origin (detail)
- Mexican 2% Puerto Rican 3% Cuban 2%
- Common ancestry
- Lithuanian 2% Romanian 2% Italian 2%
- Foreign-born
- 12% · Canada, Vietnam
- Languages at home
- 85% English-only · Spanish 10% French/Haitian/Cajun 1% Russian/Polish/Slavic 1%
Political lean MEDSL · Charlotte
- 2024 margin
- Solid R (+34.0) · D 32.7% · R 66.7%
- 2008→2024 swing
- -26.7pp toward R · 2008: -7.2pp · 2024: -34.0pp
- All cycles
- 2024: R+34.0 2020: R+26.6 2016: R+27.8 2012: R+14.3 2008: R+7.2
Not yet ingested
- Civics
- —
Market trends
- HPI YoY
- ▼ -17.18%
- Current HPI
- 339.0932
- Rent YoY
- ▼ -1.35%
- Metro
- Punta Gorda, FL
- State GDP YoY
- ▲ 3.28%
- F500 in state
- 36
Industry mix (Fortune 500 HQ in FL)
| Industry | F500 HQs | Revenue |
|---|---|---|
| Industrial Technology | 2 | $29B |
|
||
| Insurance | 2 | $17B |
|
||
| Retail | 1 | $60B |
|
||
| Technology Distribution | 1 | $58B |
|
||
| Homebuilding | 1 | $35B |
|
||
| Technology Manufacturing | 1 | $35B |
|
||
Price history
+116.0% since first listed4 events — show timeline
- 2026-03-11 Price Changed $108,000 Stellar MLS as Distributed by MLS Grid
- 2026-01-23 Listed $115,000 Stellar MLS as Distributed by MLS Grid
- 1989-12-01 Sold (Public Records) $50,000 Public Records
- 1989-12-01 Sold (Public Records) $50,000 Public Records
Property tax history
+6.3%/yrLatest (2025): $1,845 · -5.2% YoY. Source: county tax records.
Cash-flow waterfall
monthlySold comps — $/sqft
last 12 mo · ≤1 miLoading sold comps…