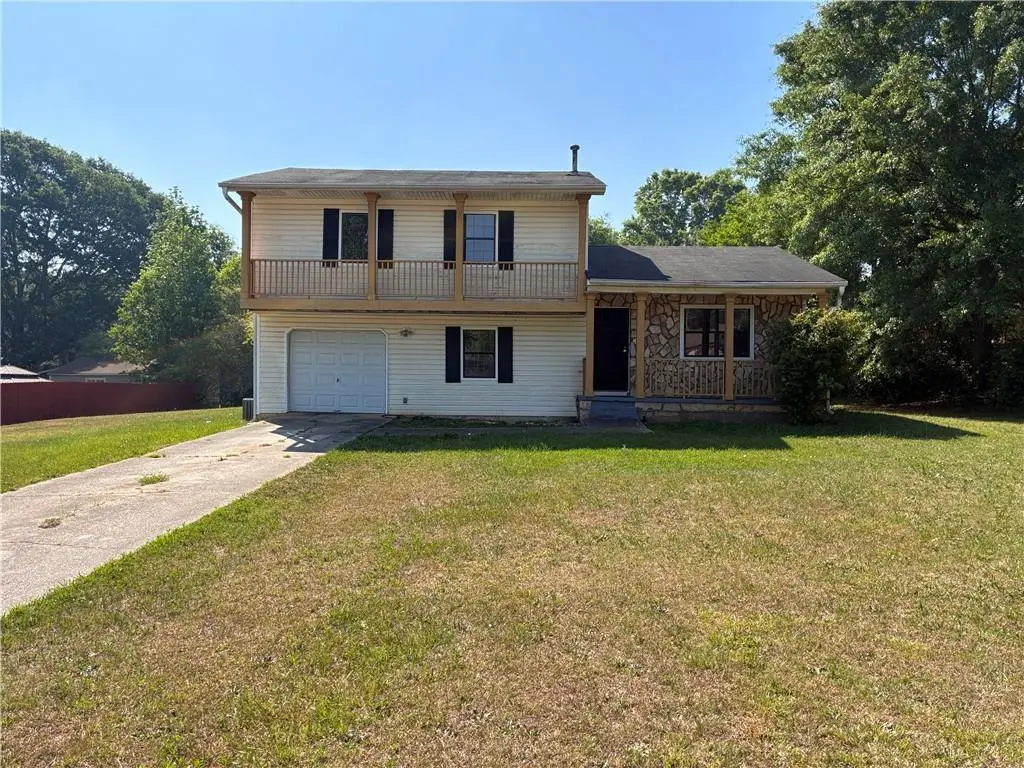
1007 Leeward Ln · Jonesboro, GA
Flood risk 1/10 · Minimal
- FEMA flood zone
- X (unshaded)
- Chance of flooding over 30 yrs
- 0.0%
- Est. flood insurance / yr
- $507 – $1,088
Fire risk 2/10 · Minimal
- Est. fire insurance / yr
- $963 – $1,789
Heat risk 6/10 · Moderate
- Hot days now (above 105°F)
- 7 days/yr
- Hot days in 30 yrs
- 18 days/yr
Wind risk 6/10 · Moderate
- Chance of severe wind over 30 yrs
- 27.0%
Air-quality risk 4/10 · Minor
- Unhealthy air days now
- 4 days/yr
- Unhealthy air days in 30 yrs
- 6 days/yr
Risk factors via First Street. Map © Google.
Why this score? — see what drove the B- grade
The composite is a weighted blend of 9 inputs, each scored 0–100. Each bar is that input's sub-score; the figure is the points it added to the 100-point composite (weight × sub-score).
- Cash flow +26.0/30.0
- ARV discount +15.0/15.0
- DSCR +8.7/10.0
- 1% rule +7.1/10.0
- Livability +3.6/5.0
- Rent growth +3.0/5.0
- Condition / age +2.5/5.0
- Schools +1.3/10.0
- Appreciation +0.0/10.0
$169,900
🖨 Deal sheet 📄 Offer letter ✓ Due diligence
Listing remarks MLS
Affordability meets potential in this charming 3-bedroom home located in the heart of Jonesboro. This two-story residence offers a comfortable layout with a main-level laundry room and a spacious kitchen ready for your personal touch. Enjoy outdoor living on the patio overlooking a large, level backyard-ideal for gardening or entertaining. The property includes a 1-car garage and is situated in an established neighborhood with no HOA. Conveniently located near North Clayton schools and major transit corridors, this is an excellent choice for anyone looking to own a piece of the metro Atlanta area at an accessible price point.
Key facts
- Spacious kitchen
- Large level backyard
- 0.5 acre lot
Tags
Neighborhood map
What this means for you Summary
Snapshot
- This is a 3-bed/2.0-bath single-family listed at $170k.
Deal economics
- At list price, monthly cash flow is $423 ($5k/yr) — positive.
- The deal already cash-flows at list — no discount required.
- Meets the 1% rule at list price ($2k rent vs $170k).
- Recommended offer: $165k (3.0% below list) — sets the bar for market timing.
- Cap rate 9.3% vs local median 5.0% in Jonesboro — top-decile yield for the area; either an underpriced asset or a hidden risk that comps aren't pricing in. Stress-test before assuming the spread holds.
Location & tenants
- Location reads 72/100 on livability (#63 in GA) — a middle-class / working-renter tenant base. Strengths: cost of living A+, housing A-; Watch: crime C-, employment D, schools F.
- Clayton County (suburban): math 11% / reading 20% proficiency, ranked #155 of 174 in GA (top 89%) — low school quality limits family demand, transient renter base, plan for 1-2y turnover; 78% free/reduced lunch — lower-income household profile, screen leases tightly.
- Market conditions: Rents rising (+2.1%/yr); 251 active listings in the ZIP; 6 comparable units currently listed for rent nearby; rentals at typical pace (median 24d on market — plan ~3-4 weeks tenant-placement turnaround); 865 units permitted in Clayton County in 2024 (448 in 5+ unit buildings).
- This rent runs 40% of the median local income ($62k/yr) — at the standard rent-burdened threshold; future hikes will face affordability resistance.
Forward outlook
- Local home prices are declining (-3.0%/yr); year-one equity from $1k of loan paydown is wiped out by about $5k of value loss. Plan a longer hold.
- Clayton County population projected at +29% by 2050 — long-run rental-demand tailwind backs the buy-and-hold thesis.
Negotiation context
- It's been on market 40 days — a 3% lower offer ($165k) is reasonable based on typical stale-listing flexibility.
- 7 sale attempts with the ask held roughly flat each time — persistent listings suggest the price (not the market) is what's stuck; bring a comps-based counter.
Risks & watch-outs
- Climate carrying-cost: major wind risk, 27% chance of damaging wind over 30y; extreme-heat days projected 7→18/yr by 2055 (HVAC capex compounding) — expect insurance premiums to compound above CPI over the hold.
Questions for the listing agent
- It's been on market 40 days. Have you received any prior offers? Is the seller open to a 3% concession, seller financing, or rate buy-down credit?
- Is there a deadline driving the sale (1031 exchange, divorce, estate, relocation)? That informs how much negotiation room exists.
- Schools are F-rated, which usually means shorter tenancies and higher turnover. Who's the typical renter profile here, and what's been the actual vacancy rate?
- What's the average days-on-market for RENTAL listings here right now (not sales)? A rising rental-DOM trend means longer vacancies and softer asking-rent achievability than the comps imply.
- What's the recent tenant-quality profile in this submarket — average credit score on applications, eviction rate, late-payment / NSF rate, and stable-employment percentage? A property-management company in the area should have these aggregated.
- How much new for-sale + rental construction is in the pipeline within 1–3 miles? Heavy new supply typically softens prices + rents 12–24 months out; constrained supply supports both.
Investment metrics
- 1% rule
- 1.21% ✓
- Cap rate
- 9.28%
- Cash-on-cash
- 10.67%
- DSCR
- 1.47
- GRM
- 6.9
CMA / ARV
- ARV (median comp)
- $280,479
- List price
- $169,900
- Delta
- -39.43%
- Verdict
- UNDERPRICED
- Comps
- 20 within 1.0 mi
Show comp detail 12 sales within ~0.75 mi
| Address | Dist | Beds/Ba | Sqft | Sold | Price | $/sf | Match |
|---|---|---|---|---|---|---|---|
| 9479 Autumn Ct | 0.38mi | 3/2.5 | 1,494 (-0%) | 1mo | $239,000 | $160 | 79 |
| 9381 Windward Ct | 0.21mi | 3/2.0 | 1,655 (+11%) | 5mo | $245,000 | $148 | 68 |
| 9347 Haley Ct | 0.38mi | 3/2.5 | 1,622 (+8%) | 12mo | $271,000 | $167 | 56 |
| 1255 Meadowbrook Dr | 0.48mi | 3/2.5 | 1,677 (+12%) | 6mo | $314,990 | $188 | 51 |
| 9464 Briarwood Ln | 0.46mi | 3/2.5 | 1,677 (+12%) | 8mo | $316,990 | $189 | 50 |
| 9469 Briarwood Ln | 0.46mi | 3/2.5 | 1,677 (+12%) | 10mo | $315,990 | $188 | 48 |
| 1247 Riverstone Rd | 0.47mi | 3/2.5 | 1,677 (+12%) | 11mo | $310,990 | $185 | 47 |
| 9461 Briairwood Ln | 0.45mi | 4/2.5 (+1) | 1,677 (+12%) | 7mo | $323,990 | $193 | 46 |
| 1255 Riverstone Rd Lot 169 | 0.49mi | 3/2.5 | 1,700 (+14%) | 9mo | $317,690 | $187 | 45 |
| 1246 Riverstone Rd | 0.50mi | 3/2.5 | 1,678 (+12%) | 12mo | $309,990 | $185 | 45 |
| 1259 Riverstone Rd | 0.50mi | 4/2.5 (+1) | 1,677 (+12%) | 9mo | $318,990 | $190 | 42 |
| 1227 Riverstone Rd | 0.44mi | 4/2.5 (+1) | 1,677 (+12%) | 12mo | $309,900 | $185 | 42 |
Match score weights: distance 35% · size 25% · config 20% · recency 20%. Top-matched comps best support the ARV.
Projected returns pro-forma
-3.0% appreciation · 2.06% rent growth · sell at horizon
- IRR
- -1.4%
- Equity multiple
- 0.95×
- Total profit
- $-2,472
- Equity at exit
- $25,333
- IRR
- 7.3%
- Equity multiple
- 1.53×
- Total profit
- $24,982
- Equity at exit
- $14,690
Cash invested: $47,572 (down + closing). Projections, not guarantees.
Landlord ↔ Tenant lean methodology
- Overall (STATE)
- 90 Strongly Landlord-Friendly
- State Georgia
- 90 Strongly Landlord-Friendly · R+3
- County
- — inherits STATE
- City
- — inherits STATE
ZIP-level market 30238
- Home prices YoY
- -33.3%
- Rents YoY
- 2.1%
- Active inventory
- 251
- Price-to-rent
- 6.9×
Monthly cashflow live
- Estimated rent
- $2,047 high interval (Pro) →
- Mortgage (P&I)
- −$891
- Tax from tax record
- −$233 /mo · $2,794/yr
- Insurance
- −$71
- HOA
- −$0
- Vacancy / Maint / Mgmt
- −$430
- Net cashflow
- $423
Break-even live
UW: 25.0% down · 7.5% · 30yr · 1.5% tax · 5.0% vac · 8.0% maint · 8.0% mgmt
Financing live
Cash to close
- Down payment
- $42,475
- Closing costs
- $5,097
- Reserves months
- —
- Total cash needed
- —
Loan-product check · same deal, 3 products live
Conventional
25% down · 7.5% · 30yr
- Down + closing
- —
- Monthly P&I
- —
- Monthly cashflow
- —
- DSCR
- —
- Eligible?
- —
Personal DTI + credit; lowest rate.
DSCR
20% down · 8.5% · 30yr
- Down + closing
- —
- Monthly P&I
- —
- Monthly cashflow
- —
- DSCR
- —
- Eligible?
- —
No personal income docs; deal must DSCR.
Hard money
10% down · 12.0% · 12mo
- Down + closing
- —
- Monthly P&I
- —
- Monthly cashflow
- —
- DSCR
- —
- Eligible?
- —
Short-term bridge; refi at stabilization.
Rent comps 6 comps
| Address | Beds | Baths | Sqft | Rent | $/sqft | DOM | Units | Dist |
|---|---|---|---|---|---|---|---|---|
| 967 Wynnbrook Ln Jonesboro, GA | 3.0 | 2.0 | 1619 | $1,985 | $1.23 | 5d | 1 | 0.42mi |
| 9570 Briar Creek Ln Jonesboro, GA | 3.0 | 2.0 | 1820 | $1,795 | $0.99 | 24d | 1 | 0.64mi |
| 782 Dunaire Way Jonesboro, GA | 3.0 | 1.5 | 1600 | $1,385 | $0.87 | 43d | 1 | 0.99mi |
| 312 Stillwood Ct Jonesboro, GA | 4.0 | 3.0 | 1598 | $2,800 | $1.75 | 43d | 1 | 1.33mi |
| 10348 Commons Xing Jonesboro, GA | 3.0 | 2.0 | 1372 | $2,500 | $1.82 | 16d | 1 | 1.42mi |
| 1139 Commons Ct Jonesboro, GA | 3.0 | 2.0 | 1421 | $1,795 | $1.26 | 20d | 1 | 1.45mi |
Listing history 19 events
-
2026-06-02status $169,900 Pending 40 DOM
-
2026-06-01days on market $169,900 Active 40 DOM
-
2026-05-31days on market $169,900 Active 39 DOM
-
2026-04-21$169,900 New 633-char remark
Show marketing remark (639 chars)
Affordability meets potential in this charming 3-bedroom home located in the heart of Jonesboro. This two-story residence offers a comfortable layout with a main-level laundry room and a spacious kitchen ready for your personal touch. Enjoy outdoor living on the patio overlooking a large, level backyard—ideal for gardening or entertaining. The property includes a 1-car garage and is situated in an established neighborhood with no HOA. Conveniently located near North Clayton schools and major transit corridors, this is an excellent choice for anyone looking to own a piece of the metro Atlanta area at an accessible price point.
-
2026-04-21$169,900 Active 639-char remark
Show marketing remark (639 chars)
Affordability meets potential in this charming 3-bedroom home located in the heart of Jonesboro. This two-story residence offers a comfortable layout with a main-level laundry room and a spacious kitchen ready for your personal touch. Enjoy outdoor living on the patio overlooking a large, level backyard—ideal for gardening or entertaining. The property includes a 1-car garage and is situated in an established neighborhood with no HOA. Conveniently located near North Clayton schools and major transit corridors, this is an excellent choice for anyone looking to own a piece of the metro Atlanta area at an accessible price point.
-
2026-04-06historical
-
2026-03-20$183,500 New
-
2026-03-17historical
-
2026-03-17historical
-
2026-03-04status Active
-
2026-03-04status Back On Market
-
2026-01-23historical Active Under Contract
-
2026-01-23historical Active Under Contract
-
2025-11-25$185,300 Active
-
2025-11-25$185,300 New
-
2022-03-18soldstatus $2,272,000
-
2003-06-16soldstatus $114,000
-
1988-03-22soldstatus $49,000
-
1982-06-11soldstatus $50,900
ⓘ Source: listings_history table (triggers on properties + properties_extension) + one-shot
backfill from property_details.listing_events for pre-trigger history.
Tax reassessment forecast GA · Resets to sale price
- Current annual tax
- $2,794 · $233/mo
- Projected year-2 tax
- $2,794 · $233/mo
- Expected delta
- $0/yr ($0/mo · 0.0%)
ⓘ Screening estimate from a state-policy table — verify with the county assessor before closing.
Climate risk First Street
- Flood 1/10 Low FEMA zone X (unshaded) · 0% chance over 30 yrs
- Wildfire 2/10 Low
- Heat 6/10 Major 7 d/yr ≥105°F today · 18 d/yr by 30 yrs out
- Wind 6/10 Major 27% chance of damaging wind over 30 yrs
- Air quality 4/10 Moderate 4 unhealthy d/yr today · 6 by 30 yrs out
Nearby sold comps map
Loading sold comps map…
Walkable amenities ~0.75 mi
Loading nearby amenities…
Taxation est. · year 1
- Rental income
- $24,570
- − Mortgage interest
- −$9,517
- − Property taxes
- −$2,794
- − Insurance
- −$850
- − Repairs & maintenance
- −$1,966
- − Management
- −$1,966
- − Depreciation
- −$4,943
- Taxable income
- $2,535
- Est. tax owed @ 24.0%
- −$608
- After-tax cash flow
- $4,466/yr
For passive investors: Depreciation is non-cash, so a rental often shows a tax loss while cash-flowing — sheltering income. Rental losses are passive: they offset passive income freely, and up to $25,000/yr can offset ordinary (W-2) income if you actively participate and your MAGI is under $100k (phasing out to $0 by $150k); unused losses carry forward. On sale, claimed depreciation is recaptured at up to 25%, and gains may owe capital-gains tax (a 1031 exchange can defer both). Figures are a year-1 estimate at your 24.0% rate — not tax advice; consult a CPA.
Schools (NCES district)
- District
- Clayton County
- NCES district ID
- 1301230
- Math proficiency
- 11% ▼ -13.00%
- Reading proficiency
- 20% ▼ -9.00%
- Median HH income
- $42,266
- Composite
- 13.41/100
- National rank
- #9527
- State rank
- #155 of 174 in GA
Livability — Jonesboro
- Score
- 72/100
- State rank
- #63
- US rank
- #6030
Category grades
Schools grade is shown separately in the Schools card above.
Census & demographics
- County
- Clayton County · 230,153 people
- City population
- 93,280
- Metro
- Atlanta-Sandy Springs-Alpharetta, GA
- Population (ZIP)
- 43,191
- Household income
- $62,185
- Rent vs Own
- Severe rent burden
- 1992.0
Population outlook (Clayton County) Hauer SSP2
- Today (2025)
- 310,777 people
- By 2030
- 329,762 · +6.1%
- By 2040
- 368,052 · +18.4%
- By 2050
- 401,196 · +29.1%
- By 2075
- 472,488 · +52.0%
- By 2100
- 500,446 · +61.0%
Race, ethnicity, and origin ACS 2023
- Neighborhood character
- Predominantly Black (71%)
- Race & ethnicity
- Black 71% Hispanic / Latino 17% White 7% Two or more races 7%
- Hispanic origin (detail)
- Mexican 13% Puerto Rican 2%
- Foreign-born
- 11% · Canada, United Kingdom
- Languages at home
- 83% English-only · Spanish 14% French/Haitian/Cajun 1%
Political lean MEDSL · Clayton
- 2024 margin
- Solid D (+69.2) · D 84.3% · R 15.1%
- 2008→2024 swing
- +2.8pp toward D · 2008: 66.4pp · 2024: 69.2pp
- All cycles
- 2024: D+69.2 2020: D+70.9 2016: D+71.9 2012: D+70.1 2008: D+66.4
Not yet ingested
- Civics
- —
Market trends
- HPI YoY
- ▼ -105.48%
- Current HPI
- 211.6309
- Rent YoY
- ▲ 2.06%
- Metro
- Atlanta-Sandy Springs-Alpharetta, GA
- State GDP YoY
- ▲ 2.66%
- F500 in state
- 28
Industry mix (Fortune 500 HQ in GA)
| Industry | F500 HQs | Revenue |
|---|---|---|
| Paper / Packaging | 2 | $29B |
|
||
| Retail | 1 | $160B |
|
||
| Transportation / Logistics | 1 | $91B |
|
||
| Airlines | 1 | $62B |
|
||
| Consumer Goods | 1 | $47B |
|
||
| Utilities | 1 | $25B |
|
||
Price history
+233.8% since first listed16 events — show timeline
- 2026-04-21 Listed $169,900 FMLS
- 2026-04-21 Listed $169,900 GAMLS
- 2026-04-06 Listing Removed — GAMLS
- 2026-03-20 Listed $183,500 GAMLS
- 2026-03-17 Listing Removed — GAMLS
- 2026-03-17 Listing Removed — FMLS
- 2026-03-04 Relisted — FMLS
- 2026-03-04 Relisted — GAMLS
- 2026-01-23 Contingent — GAMLS
- 2026-01-23 Contingent — FMLS
- 2025-11-25 Listed $185,300 GAMLS
- 2025-11-25 Listed $185,300 FMLS
- 2022-03-18 Sold (Public Records) $2,272,000 Public Records
- 2003-06-16 Sold (Public Records) $114,000 Public Records
- 1988-03-22 Sold (Public Records) $49,000 Public Records
- 1982-06-11 Sold (Public Records) $50,900 Public Records
Property tax history
+14.4%/yrLatest (2025): $2,794 · -2.0% YoY. Source: county tax records.
Cash-flow waterfall
monthlySold comps — $/sqft
last 12 mo · ≤1 miLoading sold comps…