 Triplex
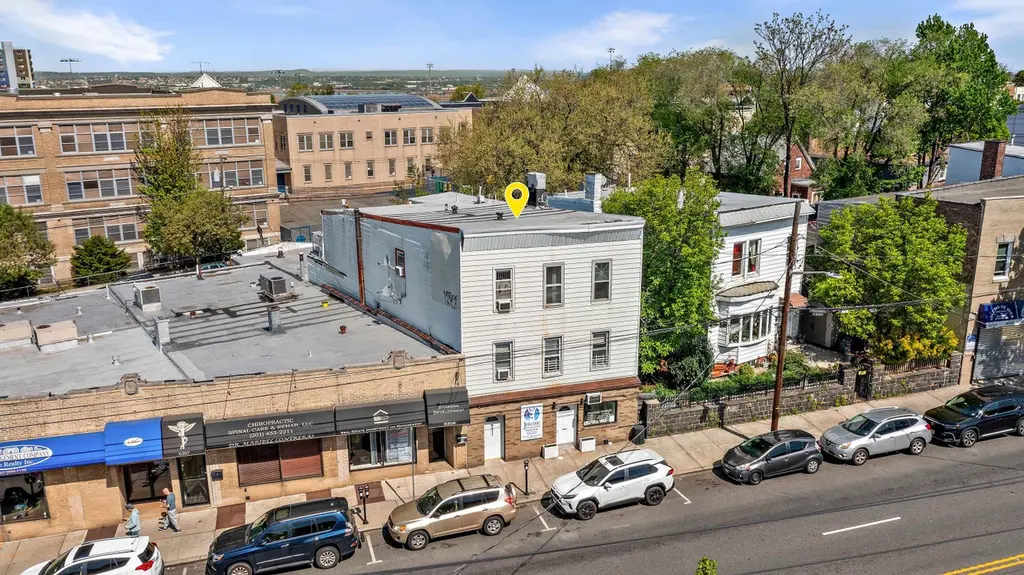
6311 KENNEDY Blvd · West New York, NJ
Flood risk No data
- FEMA flood zone
- —
- Chance of flooding over 30 yrs
- —
- Est. flood insurance / yr
- —
Fire risk No data
- Est. fire insurance / yr
- —
Heat risk No data
- Hot days now (above threshold)
- —
- Hot days in 30 yrs
- —
Wind risk No data
- Chance of severe wind over 30 yrs
- —
Air-quality risk No data
- Unhealthy air days now
- —
- Unhealthy air days in 30 yrs
- —
Risk factors via First Street. Map © Google.
Why this score? — see what drove the C- grade
The composite is a weighted blend of 9 inputs, each scored 0–100. Each bar is that input's sub-score; the figure is the points it added to the 100-point composite (weight × sub-score).
- Cash flow +24.1/30.0
- DSCR +7.8/10.0
- 1% rule +6.3/10.0
- Livability +3.9/5.0
- Rent growth +3.7/5.0
- Schools +2.2/10.0
- ARV discount +1.2/15.0
- Condition / age +1.0/5.0
- Appreciation +0.0/10.0
$1,075,000
🖨 Deal sheet 📄 Offer letter ✓ Due diligence
Multi-family units
County records classify this as Multi-Family (2-4 Unit). Listing-text estimate: 3 units. confirmed
Listing remarks MLS
6311 Kennedy Boulevard — Prime Mixed-Use Investment with Full Lot Coverage in North Bergen. An exceptional opportunity to acquire a fully occupied, semi-detached three-family plus two-commercial mixed-use property in the heart of North Bergen, one of the fastest-growing municipalities in the New York metro area. This rare offering sits on a 25' x 110' lot with full lot coverage, maximizing buildout and future development potential — an ideal scenario for both investors seeking steady cash flow or developers pursuing long-term value-add opportunities. Currently generating $99,000 in annual rental income and delivering a 5.77% CAP rate, 6311 Kennedy Boulevard presents near-term upside with minimal capital investment. With approximately $4,000 in upgrades per residential unit, projected income rises to $117,817 annually, increasing returns to a 7.52% CAP rate. Positioned along the highly trafficked Kennedy Boulevard corridor, the property benefits from strong visibility and accessibility. It’s strategically located near major commuter routes, NJ Transit bus lines, Viktor Kilken Field, and a vibrant mix of retail, dining, and neighborhood amenities — making it both a reliable income generator and a compelling long-term asset in the evolving Hudson County market. Detailed Investment Return Analysis available upon request. Qualifies for non-commercial financing through program at CrossCountry Mortgage.
Key facts
- Steady cash flow
- Strong visibility
- 25 x 110 lot
Tags
Neighborhood map
What this means for you Summary
Snapshot
- This is a 3 × 5-bed/4.0-bath units multifamily listed at $1.07M. Condition is rated poor.
Deal economics
- At list price, monthly cash flow is $2k ($26k/yr) — positive. Per door: $710/mo.
- The deal already cash-flows at list — no discount required.
- Meets the 1% rule at list price ($12k rent vs $1.07M).
- Recommended offer: $978k (9.0% below list) — sets the bar for market timing.
- Cap rate 8.7% vs local median 1.5% in West New York — top-decile yield for the area; either an underpriced asset or a hidden risk that comps aren't pricing in. Stress-test before assuming the spread holds.
Location & tenants
- Location reads 77/100 on livability (#119 in NJ, #3,034 nationally) — a middle-class / working-renter tenant base. Strengths: amenities A+, commute A+, health & safety A; Watch: schools D+, cost of living F.
- North Bergen School District (suburban): math 12% / reading 37% proficiency, ranked #393 of 472 in NJ (top 83%) — low school quality limits family demand, transient renter base, plan for 1-2y turnover.
- Market conditions: Rents rising fast (+5.0%/yr); 209 active listings in the ZIP; solid renter incomes; 5,310 units permitted in Hudson County in 2024 (4,154 in 5+ unit buildings).
- At $12,102/mo this rent would consume 184% of the median local household income ($79k/yr) (locally 3908% of renters already pay >50% of income on rent) — very limited rent-growth headroom before tenants either downsize or default.
Forward outlook
- Local home prices are declining (-3.0%/yr); year-one equity from $7k of loan paydown is wiped out by about $32k of value loss. Plan a longer hold.
- Hudson County population projected at +29% by 2050 — long-run rental-demand tailwind backs the buy-and-hold thesis.
- At projected returns (-3.0% appreciation + 5.0% rent growth), your $301k cash investment doubles in ~10 years — after that, you're playing with house money.
Negotiation context
- It's been on market 100 days — a 9% lower offer ($978k) is reasonable based on typical stale-listing flexibility.
- 6 sale attempts with the ask held roughly flat each time — persistent listings suggest the price (not the market) is what's stuck; bring a comps-based counter.
Questions for the listing agent
- It's been on market 100 days. Have you received any prior offers? Is the seller open to a 9% concession, seller financing, or rate buy-down credit?
- Can we see the unit-by-unit rent roll, current vacancy, and any below-market leases? What's the average tenancy length?
- What capital expenditures (roof, boiler, parking lot, exteriors) have been made in the last 5 years, and what's planned in the next 2?
- Have any recent inspections been done? Can we get a copy of the seller's disclosures and any deferred-maintenance estimates?
- Why hasn't it sold? Are there any deal-killer items the seller is aware of (foundation, flood, title, zoning, code violations)?
- Is there a deadline driving the sale (1031 exchange, divorce, estate, relocation)? That informs how much negotiation room exists.
- Schools are D-rated, which usually means shorter tenancies and higher turnover. Who's the typical renter profile here, and what's been the actual vacancy rate?
- What's the average days-on-market for RENTAL listings here right now (not sales)? A rising rental-DOM trend means longer vacancies and softer asking-rent achievability than the comps imply.
- What's the recent tenant-quality profile in this submarket — average credit score on applications, eviction rate, late-payment / NSF rate, and stable-employment percentage? A property-management company in the area should have these aggregated.
- How much new apartment / multifamily construction is in the pipeline within 1–3 miles? Heavy new supply (>2% of stock underway) typically softens rents 12–24 months out; light construction supports rent growth.
Investment metrics
- 1% rule
- 1.13% ✓
- Cap rate
- 8.67%
- Cash-on-cash
- 8.50%
- DSCR
- 1.38
- GRM
- 7.4
CMA / ARV
- ARV (median comp)
- $942,148
- List price
- $1,075,000
- Delta
- 14.10%
- Verdict
- OVERPRICED
- Comps
- 7 within 1.0 mi
Projected returns pro-forma
-3.0% appreciation · 4.99% rent growth · sell at horizon
- IRR
- -1.2%
- Equity multiple
- 0.95×
- Total profit
- $-13,546
- Equity at exit
- $160,286
- IRR
- 10.5%
- Equity multiple
- 1.89×
- Total profit
- $269,370
- Equity at exit
- $92,946
Cash invested: $301,000 (down + closing). Projections, not guarantees.
Landlord ↔ Tenant lean methodology
- Overall (STATE)
- 21 Tenant-Leaning
- State New Jersey
- 21 Tenant-Leaning · D+6
- County
- — inherits STATE
- City
- — inherits STATE
ZIP-level market 07047
- Home prices YoY
- -31.5%
- Rents YoY
- 5.0%
- Active inventory
- 209
- Price-to-rent
- 22.2×
Monthly cashflow live
- Estimated rent
- $12,102 high interval (Pro) →
- Mortgage (P&I)
- −$5,637
- Tax est. 1.5%
- −$1,344 /mo · $16,125/yr
- Insurance
- −$448
- HOA
- −$0
- Vacancy / Maint / Mgmt
- −$2,541
- Net cashflow
- $2,131
Break-even live
3-unit breakdown (identical units grouped — click to expand)
| Units | Beds | Baths | Est. rent |
|---|---|---|---|
| 3× units | 5 | 4 | $12,102 |
| #1 | 5 | 4 | $4,034 |
| #2 | 5 | 4 | $4,034 |
| #3 | 5 | 4 | $4,034 |
| Total (3 units) | $12,102 | ||
UW: 25.0% down · 7.5% · 30yr · 1.5% tax · 5.0% vac · 8.0% maint · 8.0% mgmt
Financing live
Cash to close
- Down payment
- $268,750
- Closing costs
- $32,250
- Reserves months
- —
- Total cash needed
- —
Loan-product check · same deal, 3 products live
Conventional
25% down · 7.5% · 30yr
- Down + closing
- —
- Monthly P&I
- —
- Monthly cashflow
- —
- DSCR
- —
- Eligible?
- —
Personal DTI + credit; lowest rate.
DSCR
20% down · 8.5% · 30yr
- Down + closing
- —
- Monthly P&I
- —
- Monthly cashflow
- —
- DSCR
- —
- Eligible?
- —
No personal income docs; deal must DSCR.
Hard money
10% down · 12.0% · 12mo
- Down + closing
- —
- Monthly P&I
- —
- Monthly cashflow
- —
- DSCR
- —
- Eligible?
- —
Short-term bridge; refi at stabilization.
Listing history 24 events
-
2026-06-18days on market $1,075,000 Active 100 DOM
-
2026-06-17days on market $1,075,000 Active 99 DOM
-
2026-06-16days on market $1,075,000 Active 98 DOM
-
2026-06-15days on market $1,075,000 Active 97 DOM
-
2026-06-13days on market $1,075,000 Active 95 DOM
-
2026-06-09days on market $1,075,000 Active 91 DOM
-
2026-06-08days on market $1,075,000 Active 90 DOM
-
2026-06-07days on market $1,075,000 Active 89 DOM
-
2026-06-04days on market $1,075,000 Active 86 DOM
-
2026-06-03days on market $1,075,000 Active 85 DOM
-
2026-06-02days on market $1,075,000 Active 84 DOM
-
2026-06-01days on market $1,075,000 Active 83 DOM
-
2026-05-31days on market $1,075,000 Active 82 DOM
-
2026-03-10$1,075,000 Active 1443-char remark
Show marketing remark (1443 chars)
6311 Kennedy Boulevard — Prime Mixed-Use Investment with Full Lot Coverage in North Bergen. An exceptional opportunity to acquire a fully occupied, semi-detached three-family plus two-commercial mixed-use property in the heart of North Bergen, one of the fastest-growing municipalities in the New York metro area. This rare offering sits on a 25' x 110' lot with full lot coverage, maximizing buildout and future development potential — an ideal scenario for both investors seeking steady cash flow or developers pursuing long-term value-add opportunities. Currently generating $99,000 in annual rental income and delivering a 5.77% CAP rate, 6311 Kennedy Boulevard presents near-term upside with minimal capital investment. With approximately $4,000 in upgrades per residential unit, projected income rises to $117,817 annually, increasing returns to a 7.52% CAP rate. Positioned along the highly trafficked Kennedy Boulevard corridor, the property benefits from strong visibility and accessibility. It’s strategically located near major commuter routes, NJ Transit bus lines, Viktor Kilken Field, and a vibrant mix of retail, dining, and neighborhood amenities — making it both a reliable income generator and a compelling long-term asset in the evolving Hudson County market. Detailed Investment Return Analysis available upon request. Qualifies for non-commercial financing through program at CrossCountry Mortgage.
-
2026-03-10historical
Show marketing remark (1443 chars)
6311 Kennedy Boulevard — Prime Mixed-Use Investment with Full Lot Coverage in North Bergen. An exceptional opportunity to acquire a fully occupied, semi-detached three-family plus two-commercial mixed-use property in the heart of North Bergen, one of the fastest-growing municipalities in the New York metro area. This rare offering sits on a 25' x 110' lot with full lot coverage, maximizing buildout and future development potential — an ideal scenario for both investors seeking steady cash flow or developers pursuing long-term value-add opportunities. Currently generating $99,000 in annual rental income and delivering a 5.77% CAP rate, 6311 Kennedy Boulevard presents near-term upside with minimal capital investment. With approximately $4,000 in upgrades per residential unit, projected income rises to $117,817 annually, increasing returns to a 7.52% CAP rate. Positioned along the highly trafficked Kennedy Boulevard corridor, the property benefits from strong visibility and accessibility. It’s strategically located near major commuter routes, NJ Transit bus lines, Viktor Kilken Field, and a vibrant mix of retail, dining, and neighborhood amenities — making it both a reliable income generator and a compelling long-term asset in the evolving Hudson County market. Detailed Investment Return Analysis available upon request. Qualifies for non-commercial financing through program at CrossCountry Mortgage.
-
2026-01-18$1,100,000 Active
-
2026-01-18historical
-
2025-12-02$1,100,000 Active
-
2025-12-02historical
-
2025-11-11$1,200,000 Active
-
2025-11-10historical
-
2025-08-18$1,200,000 Active
-
2025-08-15historical
-
2025-05-06$1,200,000 Active
ⓘ Source: listings_history table (triggers on properties + properties_extension) + one-shot
backfill from property_details.listing_events for pre-trigger history.
Nearby sold comps map
Loading sold comps map…
Walkable amenities ~0.75 mi
Loading nearby amenities…
Taxation est. · year 1
- Rental income
- $145,224
- − Mortgage interest
- −$60,217
- − Property taxes
- −$16,125
- − Insurance
- −$5,375
- − Repairs & maintenance
- −$11,618
- − Management
- −$11,618
- − Depreciation
- −$31,273
- Taxable income
- $8,999
- Est. tax owed @ 24.0%
- −$2,160
- After-tax cash flow
- $23,418/yr
For passive investors: Depreciation is non-cash, so a rental often shows a tax loss while cash-flowing — sheltering income. Rental losses are passive: they offset passive income freely, and up to $25,000/yr can offset ordinary (W-2) income if you actively participate and your MAGI is under $100k (phasing out to $0 by $150k); unused losses carry forward. On sale, claimed depreciation is recaptured at up to 25%, and gains may owe capital-gains tax (a 1031 exchange can defer both). Figures are a year-1 estimate at your 24.0% rate — not tax advice; consult a CPA.
Condition & rehab AI · 12 photos
This three-family plus two-commercial property requires extensive renovation to improve its condition and increase its resale and rental value.
Repairs flagged
- Major kitchen appliances — outdated and in need of replacement
- Major bathroom fixtures — dated and in need of replacement
- Major roof — visible wear and tear
- Major exterior siding — appears aged and in need of repair
- Major flooring — dated and worn linoleum
- Major interior walls/paint — paint appears chipped and faded
- Major windows — some windows appear to be in need of replacement
- Major HVAC/mechanicals — age suggests potential need for replacement
Value-add opportunities
- Resale extensive renovation of kitchen and bathrooms — modernizing outdated spaces
- Resale extensive exterior and interior painting — enhancing curb appeal and interior aesthetics
- Both replacement of windows and HVAC system — improving energy efficiency and comfort
- Both landscaping and curb appeal improvements — enhancing overall property value and appeal
Renovation cost estimate screening
| Repair item | Severity | Est. cost |
|---|---|---|
| kitchen appliances · outdated and in need of replacement | Major | $15,000–50,000 |
| bathroom fixtures · dated and in need of replacement | Major | $15,000–50,000 |
| roof · visible wear and tear | Major | $15,000–50,000 |
| exterior siding · appears aged and in need of repair | Major | $15,000–50,000 |
| flooring · dated and worn linoleum | Major | $15,000–50,000 |
| interior walls/paint · paint appears chipped and faded | Major | $15,000–50,000 |
| windows · some windows appear to be in need of replacement | Major | $15,000–50,000 |
| HVAC/mechanicals · age suggests potential need for replacement | Major | $15,000–50,000 |
| Total estimated repair cost · 8 items | $120,000–400,000 |
Value-add ROI direction
- Resale extensive renovation of kitchen and bathrooms — modernizing outdated spaces ↑
- Resale extensive exterior and interior painting — enhancing curb appeal and interior aesthetics ↑
- Both replacement of windows and HVAC system — improving energy efficiency and comfort ↑
- Both landscaping and curb appeal improvements — enhancing overall property value and appeal ↑
ⓘ Cost ranges are severity-bucket heuristics (US national rule-of-thumb). Get contractor quotes + a written scope before underwriting a rehab budget.
Schools (NCES district)
- District
- North Bergen School District
- NCES district ID
- 3411460
- Math proficiency
- 12% ▼ -16.00%
- Reading proficiency
- 37% ▼ -10.00%
- Median HH income
- $54,275
- Composite
- 21.95/100
- National rank
- #8221
- State rank
- #393 of 472 in NJ
Livability — West New York
- Score
- 77/100
- State rank
- #119
- US rank
- #3034
Category grades
Schools grade is shown separately in the Schools card above.
Census & demographics
- County
- Hudson County · 718,323 people
- City population
- 63,758
- Metro
- New York-Newark-Jersey City, NY-NJ-PA
- Population (ZIP)
- 61,250
- Household income
- $78,911
- Rent vs Own
- Severe rent burden
- 3908.0
Population outlook (Hudson County) Hauer SSP2
- Today (2025)
- 771,834 people
- By 2030
- 818,028 · +6.0%
- By 2040
- 907,866 · +17.6%
- By 2050
- 994,480 · +28.8%
- By 2075
- 1,163,301 · +50.7%
- By 2100
- 1,254,703 · +62.6%
Race, ethnicity, and origin ACS 2023
- Neighborhood character
- Predominantly Hispanic (69%)
- Race & ethnicity
- Hispanic / Latino 69% Two or more races 26% White 20% Asian 7% Black 3% Native American 1%
- Hispanic origin (detail)
- Mexican 2% Puerto Rican 7% Cuban 11% Dominican 12%
- Common ancestry
- Romanian 1% Lithuanian 1%
- Foreign-born
- 50% · Canada, Jamaica, South Korea
- Languages at home
- 27% English-only · Spanish 61% Other Indo-European 4% Arabic 3%
Political lean MEDSL · Hudson
- 2024 margin
- Strong D (+28.1) · D 62.6% · R 34.6% · Other 2.8%
- 2008→2024 swing
- -18.7pp toward R · 2008: 46.7pp · 2024: 28.1pp
- All cycles
- 2024: D+28.1 2020: D+46.2 2016: D+51.8 2012: D+55.7 2008: D+46.7
Not yet ingested
- Civics
- —
Market trends
- HPI YoY
- ▼ -192.36%
- Current HPI
- 419.0283
- Rent YoY
- ▲ 4.99%
- Metro
- New York-Newark-Jersey City, NY-NJ-PA
- State GDP YoY
- ▲ 2.05%
- F500 in state
- 34
Industry mix (Fortune 500 HQ in NJ)
| Industry | F500 HQs | Revenue |
|---|---|---|
| Consumer Goods | 3 | $31B |
|
||
| Pharmaceuticals | 2 | $153B |
|
||
| Technology | 2 | $21B |
|
||
| Insurance | 2 | $20B |
|
||
| Healthcare | 2 | $19B |
|
||
| Financial Services | 1 | $70B |
|
||
Price history
-10.4% since first listed11 events — show timeline
- 2026-03-10 Listing Removed — HCMLS
- 2026-03-10 Listed $1,075,000 HCMLS
- 2026-01-18 Listing Removed — HCMLS
- 2026-01-18 Listed $1,100,000 HCMLS
- 2025-12-02 Listing Removed — HCMLS
- 2025-12-02 Listed $1,100,000 HCMLS
- 2025-11-11 Listed $1,200,000 HCMLS
- 2025-11-10 Listing Removed — HCMLS
- 2025-08-18 Listed $1,200,000 HCMLS
- 2025-08-15 Listing Removed — HCMLS
- 2025-05-06 Listed $1,200,000 HCMLS
Cash-flow waterfall
monthlySold comps — $/sqft
last 12 mo · ≤1 miLoading sold comps…