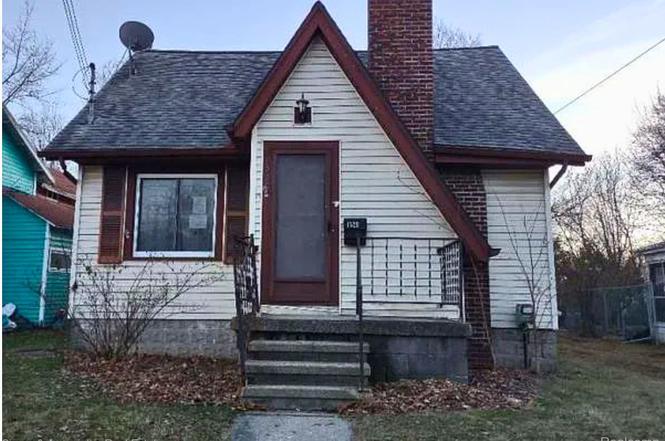
1520 E Oakland Ave · Lansing, MI
Flood risk 1/10 · Minimal
- FEMA flood zone
- X (unshaded)
- Chance of flooding over 30 yrs
- 0.0%
- Est. flood insurance / yr
- $473 – $860
Fire risk 1/10 · Minimal
- Est. fire insurance / yr
- $784 – $1,456
Heat risk 2/10 · Minimal
- Hot days now (above 97°F)
- 7 days/yr
- Hot days in 30 yrs
- 16 days/yr
Wind risk 2/10 · Minimal
- Chance of severe wind over 30 yrs
- —
Air-quality risk 2/10 · Minimal
- Unhealthy air days now
- 1 days/yr
- Unhealthy air days in 30 yrs
- 2 days/yr
Risk factors via First Street. Map © Google.
Why this score? — see what drove the B+ grade
The composite is a weighted blend of 9 inputs, each scored 0–100. Each bar is that input's sub-score; the figure is the points it added to the 100-point composite (weight × sub-score).
- Cash flow +30.0/30.0
- ARV discount +15.0/15.0
- 1% rule +10.0/10.0
- DSCR +10.0/10.0
- Rent growth +5.0/5.0
- Livability +4.0/5.0
- Condition / age +2.5/5.0
- Schools +1.9/10.0
- Appreciation +0.0/10.0
$89,999
🖨 Deal sheet 📄 Offer letter ✓ Due diligence
Listing remarks MLS
Opportunity knocks! This 4-bedroom, 1-bath home is full of potential and ready for your finishing touches. Whether you're a first-time homebuyer looking to build sweat equity or an investor searching for your next flip or rental opportunity, this property offers a great value. The home features a spacious layout with generously sized bedrooms, a large living area, and plenty of room to make it your own. While it could benefit from some updates and cosmetic improvements, the solid footprint provides an excellent starting point for renovation. Conveniently located near schools, shopping, dining, parks, and major highways, this property presents an affordable chance to create value and customize a home to fit your needs. Sold as-is. Schedule your showing today and explore the possibilities.
Key facts
- Large living area
- Solid footprint
- Spacious layout
Tags
Property features AI
Finance
- Other: Located in the Golfmore subdivision; east of Grand River Ave
Exterior
- Parking: Detached garage (1.5 spaces)
- Utilities: Public water; Public sewer
- Home design: Single-family residence; One and one-half story; Ground-level entry with steps
- Construction: Aluminum siding; Block foundation
- Exterior features: Paved road access; Lot dimensions approximately 47.93 x 132.98 (0.15 acres)
Interior
- Kitchen: No specific kitchen appliance details provided
- Bedrooms: Total of 4 rooms (includes bedrooms and living spaces)
- Bathrooms: 1 full bathroom
- Heating & cooling: Forced air heating (natural gas); No cooling system
- Interior features: Full unfinished basement
- Laundry & utility: Has heating (Forced air, Natural gas)
Neighborhood map
What this means for you Summary
Snapshot
- This is a 4-bed/1.0-bath single-family listed at $90k.
Deal economics
- At list price, monthly cash flow is $433 ($5k/yr) — positive.
- The deal already cash-flows at list — no discount required.
- Meets the 1% rule at list price ($2k rent vs $90k).
- Cap rate 12.1% vs local median 6.0% in Lansing — top-decile yield for the area; either an underpriced asset or a hidden risk that comps aren't pricing in. Stress-test before assuming the spread holds.
Location & tenants
- Location reads 79/100 on livability (#94 in MI, #2,182 nationally) — a middle-class / working-renter tenant base. Strengths: amenities A+, commute A+, cost of living A+; Watch: employment D, schools F, crime F.
- Lansing Public School District (urban): math 14% / reading 23% proficiency, ranked #650 of 760 in MI (top 86%) — low school quality limits family demand, transient renter base, plan for 1-2y turnover; 68% free/reduced lunch — lower-income household profile, screen leases tightly.
- Market conditions: Rents rising fast (+10.5%/yr); 138 active listings in the ZIP; 12 comparable units currently listed for rent nearby; rentals lingering (median 44d on market — plan ~5-8 weeks vacancy on turnover, expect pricing pressure); 58% of comp listings sitting > 30 days — soft ceiling on asking rent; 350 units permitted in Ingham County in 2024 (186 in 5+ unit buildings).
Forward outlook
- Local home prices are declining (-3.0%/yr); year-one equity from $622 of loan paydown is wiped out by about $3k of value loss. Plan a longer hold.
- Ingham County population projected at +11% by 2050 — modest demand growth; plan on rents tracking national, not racing it.
- At projected returns (-3.0% appreciation + 8.0% rent growth), your $25k cash investment doubles in ~5 years — after that, you're playing with house money.
Negotiation context
- Only 2 days on market — expect competitive offers; lowballing is unlikely to land.
- 7 sale attempts since 7y ago with the ask held roughly flat each time — persistent listings suggest the price (not the market) is what's stuck; bring a comps-based counter.
- Current owner paid $44k; list at $90k implies a 105% gain — meaningful room to come down on a strong offer.
Risks & watch-outs
- Watch-outs: property tax is 4.1% of price; built in 1930 — expect roof / HVAC / electrical / plumbing capex.
Questions for the listing agent
- Built in 1930 — when were the roof, HVAC, electrical panel, plumbing, and water heater last replaced?
- Property tax is high relative to price — has the assessment been appealed recently, and will the sale trigger a re-assessment?
- Is there a deadline driving the sale (1031 exchange, divorce, estate, relocation)? That informs how much negotiation room exists.
- Schools are F-rated, which usually means shorter tenancies and higher turnover. Who's the typical renter profile here, and what's been the actual vacancy rate?
- Crime grade is F in this area — have there been break-ins, vandalism, or insurance claims at this property in the last 3 years? What carrier currently insures it and at what premium?
- What's the average days-on-market for RENTAL listings here right now (not sales)? A rising rental-DOM trend means longer vacancies and softer asking-rent achievability than the comps imply.
- What's the recent tenant-quality profile in this submarket — average credit score on applications, eviction rate, late-payment / NSF rate, and stable-employment percentage? A property-management company in the area should have these aggregated.
- How much new for-sale + rental construction is in the pipeline within 1–3 miles? Heavy new supply typically softens prices + rents 12–24 months out; constrained supply supports both.
Investment metrics
- 1% rule
- 1.76% ✓
- Cap rate
- 12.06%
- Cash-on-cash
- 20.61%
- DSCR
- 1.92
- GRM
- 4.7
CMA / ARV
- ARV (on-the-fly)
- $143,625
- Comps found
- 12
Show comp detail 12 sales within ~0.75 mi
| Address | Dist | Beds/Ba | Sqft | Sold | Price | $/sf | Match |
|---|---|---|---|---|---|---|---|
| 823 Maryland Ave | 0.06mi | 3/2.0 (-1) | 1,044 (-9%) | 1mo | $129,000 | $124 | 72 |
| 1527 Massachusetts Ave | 0.66mi | 3/1.0 (-1) | 1,172 (+2%) | 1mo | $90,000 | $77 | 60 |
| 713 N Francis Ave | 0.63mi | 3/1.0 (-1) | 1,122 (-2%) | 3mo | $179,900 | $160 | 59 |
| 414 N Clemens Ave | 0.50mi | 3/1.0 (-1) | 1,222 (+6%) | 3mo | $153,000 | $125 | 58 |
| 605 N Fairview Ave | 0.45mi | 3/1.0 (-1) | 1,046 (-9%) | 1mo | $177,000 | $169 | 58 |
| 1311 Illinois Ave | 0.47mi | 3/1.0 (-1) | 1,056 (-8%) | 3mo | $137,000 | $130 | 57 |
| 1530 New York Ave | 0.69mi | 3/2.0 (-1) | 1,161 (+1%) | 1mo | $130,000 | $112 | 56 |
| 605 N Clemens Ave | 0.40mi | 3/1.0 (-1) | 1,004 (-13%) | 1mo | $169,900 | $169 | 55 |
| 1115 Porter St | 0.41mi | 3/1.5 (-1) | 1,296 (+13%) | 1mo | $66,500 | $51 | 52 |
| 1013 N Pennsylvania Ave | 0.49mi | 3/1.5 (-1) | 1,034 (-10%) | 4mo | $89,000 | $86 | 50 |
| 1632 Ohio Ave | 0.69mi | 3/1.0 (-1) | 1,044 (-9%) | 1mo | $155,000 | $148 | 47 |
| 1508 Ohio Ave | 0.54mi | 3/2.0 (-1) | 1,320 (+15%) | 1mo | $156,900 | $119 | 40 |
Match score weights: distance 35% · size 25% · config 20% · recency 20%. Top-matched comps best support the ARV.
Projected returns pro-forma
-3.0% appreciation · 8.0% rent growth · sell at horizon
- IRR
- 19.5%
- Equity multiple
- 1.85×
- Total profit
- $21,500
- Equity at exit
- $13,419
- IRR
- 31.6%
- Equity multiple
- 4.69×
- Total profit
- $92,921
- Equity at exit
- $7,781
Cash invested: $25,200 (down + closing). Projections, not guarantees.
Landlord ↔ Tenant lean methodology
- Overall (STATE)
- 62 Landlord-Friendly
- State Michigan
- 62 Landlord-Friendly · EVEN
- County
- — inherits STATE
- City
- — inherits STATE
ZIP-level market 48906
- Rents YoY
- 10.5%
- Active inventory
- 138
- Price-to-rent
- 4.7×
Monthly cashflow live
- Estimated rent
- $1,585 high interval (Pro) →
- Mortgage (P&I)
- −$472
- Tax from tax record
- −$310 /mo · $3,716/yr
- Insurance
- −$37
- HOA
- −$0
- Vacancy / Maint / Mgmt
- −$333
- Net cashflow
- $433
Break-even live
UW: 25.0% down · 7.5% · 30yr · 1.5% tax · 5.0% vac · 8.0% maint · 8.0% mgmt
Financing live
Cash to close
- Down payment
- $22,500
- Closing costs
- $2,700
- Reserves months
- —
- Total cash needed
- —
Loan-product check · same deal, 3 products live
Conventional
25% down · 7.5% · 30yr
- Down + closing
- —
- Monthly P&I
- —
- Monthly cashflow
- —
- DSCR
- —
- Eligible?
- —
Personal DTI + credit; lowest rate.
DSCR
20% down · 8.5% · 30yr
- Down + closing
- —
- Monthly P&I
- —
- Monthly cashflow
- —
- DSCR
- —
- Eligible?
- —
No personal income docs; deal must DSCR.
Hard money
10% down · 12.0% · 12mo
- Down + closing
- —
- Monthly P&I
- —
- Monthly cashflow
- —
- DSCR
- —
- Eligible?
- —
Short-term bridge; refi at stabilization.
Rent comps 12 comps
| Address | Beds | Baths | Sqft | Rent | $/sqft | DOM | Units | Dist |
|---|---|---|---|---|---|---|---|---|
| 1102 Clark St Lansing, MI | 3.0 | 1.0 | 1232 | $1,550 | $1.26 | 21d | 1 | 0.24mi |
| 1228 N Fairview Ave Lansing, MI | 3.0 | 2.0 | 1100 | $1,700 | $1.55 | 44d | 1 | 0.52mi |
| 414 N Hayford Ave Lansing, MI | 3.0 | 1.0 | 990 | $1,425 | $1.44 | 44d | 1 | 0.64mi |
| 1561 Massachusetts Ave Lansing, MI | 3.0 | 2.0 | 1100 | $1,400 | $1.27 | 44d | 1 | 0.69mi |
| 208 S Bingham St Lansing, MI | 4.0 | 1.0 | 1020 | $1,500 | $1.47 | 14d | 1 | 0.86mi |
| 329 S Clemens Ave Lansing, MI | 3.0 | 1.0 | 1194 | $1,400 | $1.17 | 21d | 1 | 0.96mi |
| 1715 Peppertree Ln Lansing, MI | 2.0–3.0 | 1.5 | 1120 | $1,595 | $1.42 | 44d | 2 | 1.01mi |
| 910 Dakin St Lansing, MI | 3.0 | 1.0 | 908 | $1,295 | $1.43 | 44d | 1 | 1.24mi |
| 1027 Climax St Lansing, MI | 3.0 | 1.5 | 1298 | $1,550 | $1.19 | 14d | 1 | 1.32mi |
| 433 Seymour Ave Unit 3 Lansing, MI | 3.0 | 1.0 | 1250 | $1,395 | $1.12 | 44d | 1 | 1.40mi |
| 1502 S Shore Dr East Lansing, MI | 3.0 | 1.0–2.0 | 689 | $1,900 | $2.76 | 14d | 14 | 1.47mi |
| 401 S Washington Sq Unit 201 Lansing, MI | 3.0 | 1.0 | 1254 | $1,560 | $1.24 | 44d | 1 | 1.48mi |
Listing history 3 events
-
2026-06-18days on market $89,999 Active 2 DOM
-
2026-06-17remarks 699-char remark
-
2026-06-17$89,999 Active 1 DOM
ⓘ Source: listings_history table (triggers on properties + properties_extension) + one-shot
backfill from property_details.listing_events for pre-trigger history.
Tax reassessment forecast MI · Partial reset (capped growth)
- Current annual tax
- $3,716 · $310/mo
- Projected year-2 tax
- $3,716 · $310/mo
- Expected delta
- $0/yr ($0/mo · 0.0%)
ⓘ Screening estimate from a state-policy table — verify with the county assessor before closing.
Climate risk First Street
- Flood 1/10 Low FEMA zone X (unshaded) · 0% chance over 30 yrs
- Wildfire 1/10 Low
- Heat 2/10 Low 7 d/yr ≥97°F today · 16 d/yr by 30 yrs out
- Wind 2/10 Low
- Air quality 2/10 Low 1 unhealthy d/yr today · 2 by 30 yrs out
Nearby sold comps map
Loading sold comps map…
Walkable amenities ~0.75 mi
Loading nearby amenities…
Taxation est. · year 1
- Rental income
- $19,017
- − Mortgage interest
- −$5,041
- − Property taxes
- −$3,716
- − Insurance
- −$450
- − Repairs & maintenance
- −$1,521
- − Management
- −$1,521
- − Depreciation
- −$2,618
- Taxable income
- $4,148
- Est. tax owed @ 24.0%
- −$996
- After-tax cash flow
- $4,198/yr
For passive investors: Depreciation is non-cash, so a rental often shows a tax loss while cash-flowing — sheltering income. Rental losses are passive: they offset passive income freely, and up to $25,000/yr can offset ordinary (W-2) income if you actively participate and your MAGI is under $100k (phasing out to $0 by $150k); unused losses carry forward. On sale, claimed depreciation is recaptured at up to 25%, and gains may owe capital-gains tax (a 1031 exchange can defer both). Figures are a year-1 estimate at your 24.0% rate — not tax advice; consult a CPA.
Schools (NCES district)
- District
- Lansing Public School District
- NCES district ID
- 2621150
- Math proficiency
- 14% ▲ 1.00%
- Reading proficiency
- 23% ▲ 3.00%
- Median HH income
- $37,453
- Composite
- 18.76/100
- National rank
- #14002
- State rank
- #650 of 760 in MI
Livability — Lansing
- Score
- 79/100
- State rank
- #94
- US rank
- #2182
Category grades
Schools grade is shown separately in the Schools card above.
Census & demographics
- Census place
- Lansing, MI
- County
- Ingham County · 237,052 people
- City population
- 161,269
- Metro
- Lansing-East Lansing, MI
- Population (ZIP)
- 25,901
- Household income
- $64,315
- Rent vs Own
- Severe rent burden
- 851.0
Population outlook (Ingham County) Hauer SSP2
- Today (2025)
- 300,362 people
- By 2030
- 307,808 · +2.5%
- By 2040
- 320,492 · +6.7%
- By 2050
- 333,223 · +10.9%
- By 2075
- 373,693 · +24.4%
- By 2100
- 392,021 · +30.5%
Race, ethnicity, and origin ACS 2023
- Neighborhood character
- Diverse neighborhood (Simpson 0.56)
- Race & ethnicity
- White 64% Black 15% Two or more races 12% Hispanic / Latino 12% Asian 2%
- Hispanic origin (detail)
- Mexican 9%
- Common ancestry
- Romanian 3% Lithuanian 2% Iranian 2%
- Foreign-born
- 6% · Canada, China
- Languages at home
- 88% English-only · Spanish 5% Other Asian/Pacific 1% French/Haitian/Cajun 1%
Political lean MEDSL · Ingham
- 2024 margin
- Strong D (+29.7) · D 63.9% · R 34.2% · Other 2.0%
- 2008→2024 swing
- -3.6pp toward R · 2008: 33.3pp · 2024: 29.7pp
- All cycles
- 2024: D+29.7 2020: D+32.2 2016: D+27.6 2012: D+27.9 2008: D+33.3
Not yet ingested
- Civics
- —
Market trends
- HPI YoY
- ▼ -135.54%
- Current HPI
- 228.7023
- Rent YoY
- ▲ 10.50%
- Metro
- Lansing-East Lansing, MI
- State GDP YoY
- ▲ 1.37%
- F500 in state
- 28
Industry mix (Fortune 500 HQ in MI)
| Industry | F500 HQs | Revenue |
|---|---|---|
| Automotive Parts | 3 | $48B |
|
||
| Automotive | 2 | $372B |
|
||
| Chemicals | 1 | $45B |
|
||
| Automotive Retail | 1 | $29B |
|
||
| Healthcare / Medical Devices | 1 | $23B |
|
||
| Automotive Technology | 1 | $20B |
|
||
Price history
+50.2% since first listed20 events — show timeline
- 2026-06-17 Listed $89,999 REALCOMP
- 2026-06-15 Listed $89,999 MiRealSource-MiMLS
- 2023-03-16 Sold (MLS) $44,000 MiRealSource-MiMLS
- 2023-03-16 Sold (MLS) $44,000 REALCOMP
- 2023-03-07 Pending — REALCOMP
- 2023-03-07 Pending — MiRealSource-MiMLS
- 2023-02-27 Price Changed $33,500 MiRealSource-MiMLS
- 2023-02-27 Price Changed $33,500 REALCOMP
- 2023-02-11 Price Changed $41,400 MiRealSource-MiMLS
- 2023-02-10 Price Changed $41,400 REALCOMP
- 2023-01-26 Listed $47,700 MiRealSource-MiMLS
- 2023-01-26 Listed $47,700 REALCOMP
- 2020-12-12 Listing Removed — REALCOMP
- 2020-12-11 Listing Removed — Greater Lansing AoR
- 2020-08-05 Relisted — REALCOMP
- 2020-08-02 Listing Removed — REALCOMP
- 2020-06-04 Price Changed $44,500 REALCOMP
- 2020-04-07 Price Changed $54,500 REALCOMP
- 2019-11-05 Listed $44,500 Greater Lansing AoR
- 2019-11-05 Listed $59,900 REALCOMP
Property tax history
+9.2%/yrLatest (2025): $3,716 · +21.5% YoY. Source: county tax records.
Cash-flow waterfall
monthlySold comps — $/sqft
last 12 mo · ≤1 miLoading sold comps…