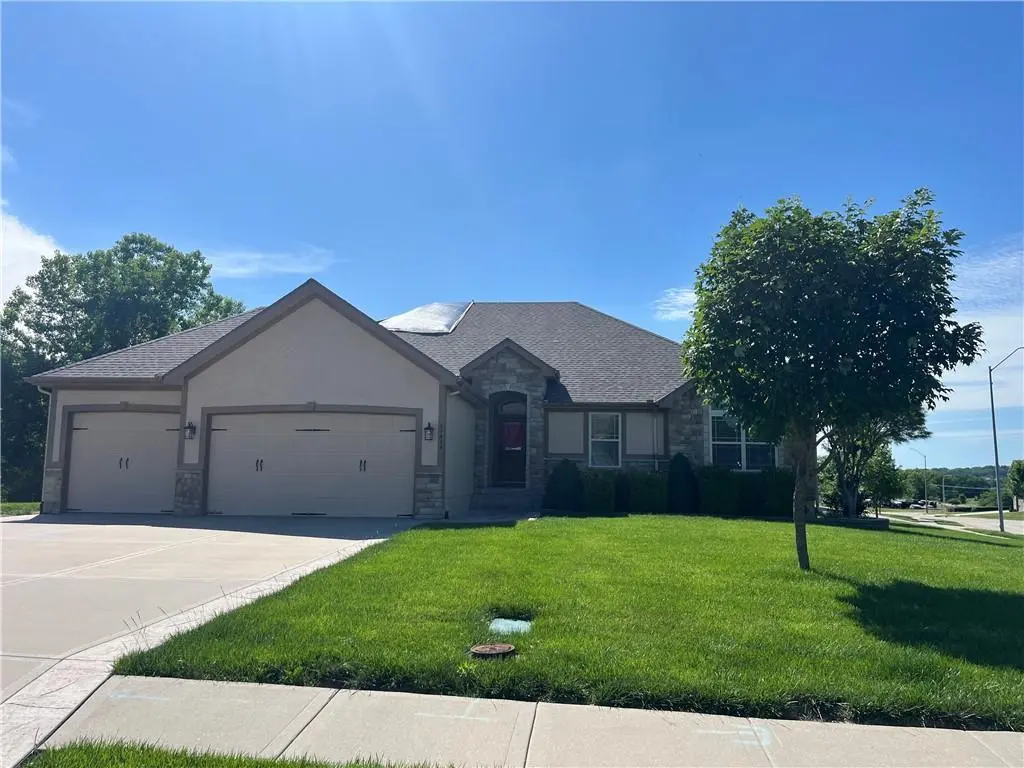
21413 E 32nd Ter S · Independence, MO
Flood risk 8/10 · Major
- FEMA flood zone
- X (unshaded)
- Chance of flooding over 30 yrs
- 0.99%
- Est. flood insurance / yr
- $473 – $860
Fire risk 2/10 · Minimal
- Est. fire insurance / yr
- $1,054 – $1,958
Heat risk 4/10 · Minor
- Hot days now (above 106°F)
- 7 days/yr
- Hot days in 30 yrs
- 17 days/yr
Wind risk 2/10 · Minimal
- Chance of severe wind over 30 yrs
- —
Air-quality risk 4/10 · Minor
- Unhealthy air days now
- 4 days/yr
- Unhealthy air days in 30 yrs
- 5 days/yr
Risk factors via First Street. Map © Google.
Why this score? — see what drove the C grade
The composite is a weighted blend of 9 inputs, each scored 0–100. Each bar is that input's sub-score; the figure is the points it added to the 100-point composite (weight × sub-score).
- Cash flow +16.4/30.0
- ARV discount +15.0/15.0
- 1% rule +6.0/10.0
- DSCR +5.1/10.0
- Schools +5.1/10.0
- Livability +4.1/5.0
- Rent growth +3.1/5.0
- Condition / age +2.5/5.0
- Appreciation +0.0/10.0
$213,000
🖨 Deal sheet (PDF) 📄 Offer letter ✓ Due diligence
Listing remarks MLS
Impressive Custom Built Home - From the Man Cave to the huge walk in panty, no details have been missed. Amazing Upgrades. Five Bedrooms and 3.5 Bathrooms. Generous sized Bedrooms. Very open concept great for entertaining and family gatherings. Main Floor Laundry Room. Beautiful Fireplace in the Great Room with vaulted ceilings. Kitchen is equipped with Stainless Steel Appliances, large Island large enough for several barstools. Family Room equipped with large Wet Bar, built-ins and media area. Great Storage. 5th Bedroom currently used as an Office. Newer patio addition. Blue Springs Schools. Independence Taxes and Utilities.
Key facts
- 3 garage spots
- Built 2011
Property features AI
Finance
- HOA & community: Homeowners association with an annual fee of $180
Exterior
- Parking: Attached garage with garage door opener; 3-car garage
- Security: Security system
- Utilities: Public water; Public sewer
- Home design: Single-family residence; Ranch / Reverse 1.5-story floor plan
- Construction: Stone and frame with stucco exterior; Composition roof
- Exterior features: Patio; Covered patio; Porch; Corner lot; Cul-de-sac location; Level yard
Interior
- Kitchen: Granite counters; Kitchen island; Pantry; Built-in oven; Stainless steel appliances; Microwave; Dishwasher; Disposal
- Bedrooms: 5 bedrooms total; Main-level bedrooms present; Basement bedrooms present; Bedrooms with ceiling fans; Walk-in closets in some bedrooms
- Flooring: Wood flooring in several rooms; Carpet in bedrooms and other areas; Ceramic tile in select rooms
- Bathrooms: 3 full bathrooms; 1 half bathroom; Bathrooms with ceramic tile and granite counters (varies by room)
- Heating & cooling: Heat pump for heating and cooling
- Interior features: Ceiling fans; Custom cabinets; Kitchen island; Pantry; Vaulted ceilings; Walk-in closets; Wet bar; Thermal windows; Fireplace in great room
- Laundry & utility: Main-level laundry located off the kitchen
Neighborhood map
What this means for you Summary
Snapshot
- This is a 4-bed/3.0-bath single-family listed at $213k.
Deal economics
- At list price, monthly cash flow is $64 ($774/yr) — positive.
- The deal already cash-flows at list — no discount required.
- Meets the 1% rule at list price ($2k rent vs $213k).
- Cap rate 7.0% vs local median 5.0% in Independence — top-decile yield for the area; either an underpriced asset or a hidden risk that comps aren't pricing in. Stress-test before assuming the spread holds.
Location & tenants
- Location reads 82/100 on livability (#10 in MO, #1,296 nationally) — a professional / high-income tenant draw. Strengths: amenities A+, commute A+, cost of living A+; Watch: employment D+, crime F.
- Blue Springs R-IV (suburban): math 55% / reading 60% proficiency, ranked #17 of 324 in MO (top 5%) — acceptable for families but not a draw, mixed tenant base, ~2y average lease.
- Zoned schools: Sunny Pointe Elem. (math 60% / reading 63%, grade B, #113 of 1,115 statewide, top 10%, 505 students, 32% FRL); Paul Kinder Middle School (math 46% / reading 49%, grade C-, #88 of 391 statewide, top 24%, 729 students, 37% FRL); Blue Springs High (math 50% / reading 65%, grade C, #49 of 521 statewide, top 9%, 2,383 students, 28% FRL).
- Market conditions: Rents rising (+2.3%/yr); 70 active listings in the ZIP; 3 comparable units currently listed for rent nearby; rentals lingering (median 46d on market — plan ~5-8 weeks vacancy on turnover, expect pricing pressure); 67% of comp listings sitting > 30 days — soft ceiling on asking rent; 4,002 units permitted in Jackson County in 2024 (2,271 in 5+ unit buildings).
- This rent runs 39% of the median local income ($71k/yr) — at the standard rent-burdened threshold; future hikes will face affordability resistance.
Forward outlook
- Local home prices are declining (-3.0%/yr); year-one equity from $1k of loan paydown is wiped out by about $6k of value loss. Plan a longer hold.
- Jackson County population projected at +4% by 2050 — modest demand growth; plan on rents tracking national, not racing it.
Negotiation context
- Only 1 days on market — expect competitive offers; lowballing is unlikely to land.
- 3 sale attempts since 17y ago with the ask held roughly flat each time — persistent listings suggest the price (not the market) is what's stuck; bring a comps-based counter.
Risks & watch-outs
- Watch-outs: property tax is 2.8% of price; flood insurance adds $56/mo.
- Climate carrying-cost: severe flood risk — expect insurance premiums to compound above CPI over the hold.
Questions for the listing agent
- Property tax is high relative to price — has the assessment been appealed recently, and will the sale trigger a re-assessment?
- What's the actual annual flood-insurance premium (NFIP or private), and is the property in a SFHA with mandatory coverage?
- What does the HOA fee cover, when was the last increase, and are there any pending special assessments or reserve-fund shortfalls?
- Is there a deadline driving the sale (1031 exchange, divorce, estate, relocation)? That informs how much negotiation room exists.
- Crime grade is F in this area — have there been break-ins, vandalism, or insurance claims at this property in the last 3 years? What carrier currently insures it and at what premium?
- What's the average days-on-market for RENTAL listings here right now (not sales)? A rising rental-DOM trend means longer vacancies and softer asking-rent achievability than the comps imply.
- What's the recent tenant-quality profile in this submarket — average credit score on applications, eviction rate, late-payment / NSF rate, and stable-employment percentage? A property-management company in the area should have these aggregated.
- How much new for-sale + rental construction is in the pipeline within 1–3 miles? Heavy new supply typically softens prices + rents 12–24 months out; constrained supply supports both.
Investment metrics
- 1% rule
- 1.10% ✓
- Cap rate
- 6.97%
- Cash-on-cash
- 2.41%
- DSCR
- 1.11
- GRM
- 7.6
CMA / ARV
- ARV (on-the-fly)
- $418,068
- Comps found
- 4
Show comp detail 4 sales within ~0.75 mi
| Address | Dist | Beds/Ba | Sqft | Sold | Price | $/sf | Match |
|---|---|---|---|---|---|---|---|
| 21805 E 32nd Ter S | 0.24mi | 4/3.0 | 2,414 (+9%) | 2mo | $469,900 | $195 | 72 |
| 3224 S Cardinal Ct | 0.57mi | 4/3.0 | 2,488 (+12%) | 3mo | $359,950 | $145 | 50 |
| 3420 S Victoria Dr | 0.74mi | 3/3.0 (-1) | 2,122 (-4%) | 8mo | $350,000 | $165 | 47 |
| 2738 S Crenshaw Rd | 0.70mi | 3/2.0 (-1) | 2,008 (-9%) | 23mo | $380,000 | $189 | 24 |
Match score weights: distance 35% · size 25% · config 20% · recency 20%. Top-matched comps best support the ARV.
Projected returns pro-forma
-3.0% appreciation · 2.32% rent growth · sell at horizon
- IRR
- -15.0%
- Equity multiple
- 0.47×
- Total profit
- $-31,772
- Equity at exit
- $31,759
- IRR
- -7.6%
- Equity multiple
- 0.53×
- Total profit
- $-27,890
- Equity at exit
- $18,416
Cash invested: $59,640 (down + closing). Projections, not guarantees.
Landlord ↔ Tenant lean methodology
- Overall (STATE)
- 81 Strongly Landlord-Friendly
- State Missouri
- 81 Strongly Landlord-Friendly · R+10
- County
- — inherits STATE
- City
- — inherits STATE
ZIP-level market 64057
- Rents YoY
- 2.3%
- Active inventory
- 70
- Price-to-rent
- 7.6×
Monthly cashflow live
- Estimated rent
- $2,336 medium interval (Pro) →
- Mortgage (P&I)
- −$1,117
- Tax from tax record
- −$504 /mo · $6,052/yr
- Insurance
- −$89
- Flood insurance flood zone
- −$56 /mo · $666/yr
- HOA
- −$15
- Vacancy / Maint / Mgmt
- −$490
- Net cashflow
- $64
Break-even live
Sensitivity live
| Price | -10% $185 | -5% $125 | +0% $64 | +5% $4 | +10% $-56 |
|---|---|---|---|---|---|
| Rent | -10% $-120 | -5% $-28 | +0% $64 | +5% $157 | +10% $249 |
| Rate | -1.0pp $172 | -0.5pp $119 | base $64 | +0.5pp $9 | +1.0pp $-47 |
UW: 25.0% down · 7.5% · 30yr · 1.5% tax · 5.0% vac · 8.0% maint · 8.0% mgmt
Financing live
Cash to close
- Down payment
- $53,250
- Closing costs
- $6,390
- Reserves months
- —
- Total cash needed
- —
Loan-product check · same deal, 3 products live
Conventional
25% down · 7.5% · 30yr
- Down + closing
- —
- Monthly P&I
- —
- Monthly cashflow
- —
- DSCR
- —
- Eligible?
- —
Personal DTI + credit; lowest rate.
DSCR
20% down · 8.5% · 30yr
- Down + closing
- —
- Monthly P&I
- —
- Monthly cashflow
- —
- DSCR
- —
- Eligible?
- —
No personal income docs; deal must DSCR.
Hard money
10% down · 12.0% · 12mo
- Down + closing
- —
- Monthly P&I
- —
- Monthly cashflow
- —
- DSCR
- —
- Eligible?
- —
Short-term bridge; refi at stabilization.
Rent comps 3 comps
| Address | Beds | Baths | Sqft | Rent | $/sqft | DOM | Units | Dist |
|---|---|---|---|---|---|---|---|---|
| 2972 Iva Dr Independence, MO | 3.0 | 2.0 | 1442 | $2,005 | $1.39 | 45d | 1 | 1.37mi |
| 20209 E 23rd Ter Ct S Independence, MO | 4.0 | 2.5 | 2003 | $2,545 | $1.27 | 45d | 1 | 1.41mi |
| 20201 E 23rd Ter Ct S Independence, MO | 4.0 | 3.0 | 1427 | $2,595 | $1.82 | 3d | 1 | 1.43mi |
HOA detail
- Monthly dues
- $15 · $180/yr
Listing history 3 events
-
2026-06-15status $213,000 Pending 1 DOM
-
2026-06-13remarks 60-char remark
-
2026-06-13$213,000 Active 1 DOM
ⓘ Source: listings_history table (triggers on properties + properties_extension) + one-shot
backfill from property_details.listing_events for pre-trigger history.
Tax reassessment forecast MO · Resets to sale price
- Current annual tax
- $6,052 · $504/mo
- Projected year-2 tax
- $6,052 · $504/mo
- Expected delta
- $0/yr ($0/mo · 0.0%)
ⓘ Screening estimate from a state-policy table — verify with the county assessor before closing.
Climate risk First Street
- Flood 8/10 Severe FEMA zone X (unshaded) · 99% chance over 30 yrs
- Wildfire 2/10 Low
- Heat 4/10 Moderate 7 d/yr ≥106°F today · 17 d/yr by 30 yrs out
- Wind 2/10 Low
- Air quality 4/10 Moderate 4 unhealthy d/yr today · 5 by 30 yrs out
Nearby sold comps map
Loading sold comps map…
Walkable amenities ~0.75 mi
Loading nearby amenities…
Taxation est. · year 1
- Rental income
- $28,026
- − Mortgage interest
- −$11,931
- − Property taxes
- −$6,052
- − Insurance
- −$1,732
- − Repairs & maintenance
- −$2,242
- − Management
- −$2,242
- − HOA
- −$180
- − Depreciation
- −$6,196
- Taxable loss
- −$2,549
- Est. tax savings @ 24.0%
- +$612
- After-tax cash flow
- $1,385/yr
For passive investors: Depreciation is non-cash, so a rental often shows a tax loss while cash-flowing — sheltering income. Rental losses are passive: they offset passive income freely, and up to $25,000/yr can offset ordinary (W-2) income if you actively participate and your MAGI is under $100k (phasing out to $0 by $150k); unused losses carry forward. On sale, claimed depreciation is recaptured at up to 25%, and gains may owe capital-gains tax (a 1031 exchange can defer both). Figures are a year-1 estimate at your 24.0% rate — not tax advice; consult a CPA.
Schools (NCES district)
- District
- Blue Springs R-IV
- NCES district ID
- 2905310
- Math proficiency
- 55% ▼ -10.00%
- Reading proficiency
- 60% ▼ -6.00%
- Median HH income
- $67,959
- Composite
- 50.71/100
- National rank
- #1819
- State rank
- #17 of 324 in MO
Livability — Independence
- Score
- 82/100
- State rank
- #10
- US rank
- #1296
Category grades
Schools grade is shown separately in the Schools card above.
Census & demographics
- Census place
- Independence, MO
- County
- Jackson County · 687,798 people
- City population
- 117,675
- Metro
- Kansas City, MO-KS
- Population (ZIP)
- 14,328
- Household income
- $71,402
- Rent vs Own
- Severe rent burden
- 637.0
Population outlook (Jackson County) Hauer SSP2
- Today (2025)
- 719,589 people
- By 2030
- 731,456 · +1.6%
- By 2040
- 746,689 · +3.8%
- By 2050
- 749,289 · +4.1%
- By 2075
- 736,227 · +2.3%
- By 2100
- 668,210 · -7.1%
Race, ethnicity, and origin ACS 2023
- Neighborhood character
- Predominantly White (74%)
- Race & ethnicity
- White 74% Black 14% Two or more races 4% Hispanic / Latino 4% Asian 2% Pacific Islander 2%
- Common ancestry
- Italian 8% Slovak 3% Lithuanian 2%
- Foreign-born
- 2%
- Languages at home
- 97% English-only · Spanish 1% Vietnamese 1% Other Indo-European 1%
Political lean MEDSL · Jackson
- 2024 margin
- D (+19.3) · D 58.9% · R 39.5% · Other 1.6%
- 2008→2024 swing
- -6.1pp toward R · 2008: 25.4pp · 2024: 19.3pp
- All cycles
- 2024: D+19.3 2020: D+22.0 2016: D+16.6 2012: D+19.0 2008: D+25.4
Not yet ingested
- Civics
- —
Market trends
- HPI YoY
- ▼ -178.01%
- Current HPI
- 230.0639
- Rent YoY
- ▲ 2.32%
- Metro
- Kansas City, MO-KS
- State GDP YoY
- ▲ 1.84%
- F500 in state
- 20
Industry mix (Fortune 500 HQ in MO)
| Industry | F500 HQs | Revenue |
|---|---|---|
| Healthcare | 1 | $163B |
|
||
| Insurance | 1 | $21B |
|
||
| Industrial Technology | 1 | $17B |
|
||
| Retail | 1 | $16B |
|
||
| Industrial Distribution | 1 | $10B |
|
||
| Utilities | 1 | $9B |
|
||
Price history
+433.8% since first listed6 events — show timeline
- 2026-06-12 Listed $213,000 Heartland MLS as Distributed by MLS Grid
- 2015-07-31 Sold (MLS) — Heartland MLS as Distributed by MLS Grid
- 2015-07-28 Sold (Public Records) — Public Records
- 2015-06-01 Listed $340,000 Heartland MLS as Distributed by MLS Grid
- 2010-12-01 Listing Removed — Heartland MLS as Distributed by MLS Grid
- 2009-12-04 Listed $39,900 Heartland MLS as Distributed by MLS Grid
Property tax history
+2.2%/yrLatest (2025): $6,052 · +4.3% YoY. Source: county tax records.
Cash-flow waterfall
monthlySold comps — $/sqft
last 12 mo · ≤1 miLoading sold comps…