654 New Holland Ave · Lancaster, PA
Flood risk 1/10 · Minimal
- FEMA flood zone
- X (unshaded)
- Chance of flooding over 30 yrs
- 0.0%
- Est. flood insurance / yr
- $473 – $860
Fire risk 1/10 · Minimal
- Est. fire insurance / yr
- $511 – $949
Heat risk 6/10 · Moderate
- Hot days now (above 101°F)
- 7 days/yr
- Hot days in 30 yrs
- 15 days/yr
Wind risk 4/10 · Minor
- Chance of severe wind over 30 yrs
- 15.0%
Air-quality risk 4/10 · Minor
- Unhealthy air days now
- 4 days/yr
- Unhealthy air days in 30 yrs
- 7 days/yr
Risk factors via First Street. Map © Google.
Why this score? — see what drove the D grade
The composite is a weighted blend of 9 inputs, each scored 0–100. Each bar is that input's sub-score; the figure is the points it added to the 100-point composite (weight × sub-score).
- ARV discount +13.7/15.0
- Cash flow +10.9/30.0
- Livability +4.2/5.0
- DSCR +3.2/10.0
- 1% rule +3.1/10.0
- Rent growth +2.8/5.0
- Condition / age +2.5/5.0
- Schools +1.6/10.0
- Appreciation +0.0/10.0
$234,900
🖨 Deal sheet 📄 Offer letter ✓ Due diligence
Listing remarks MLS
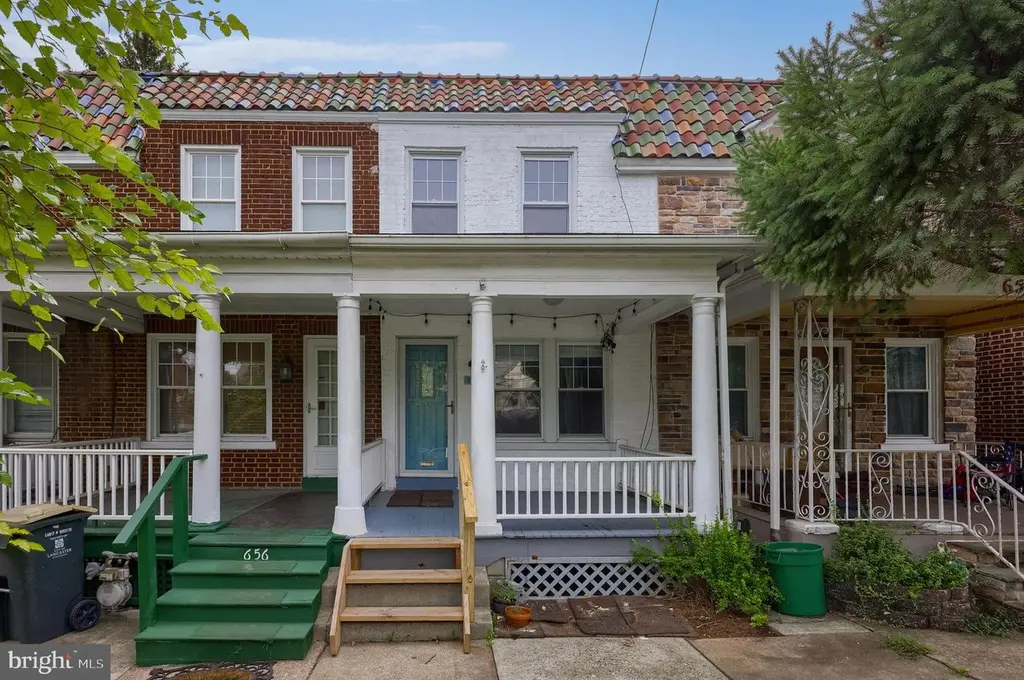
Welcome to 654 New Holland Avenue - a 3 bedroom, 1 bathroom home in the heart of Lancaster city. Enter through the private front deck to the spacious, open-layout main level just waiting for you to make it your own. The second level has 3 cozy bedrooms, including a primary bedroom with front facing windows and ceiling fan. Enjoy a full bath - boasting a tub/shower combo w/ grab bars for added accessibility - and a skylight! The full, unfinished basement offers endless possibilities for future finishing, but currently has great storage potential w/ washer & dryer hookups. Less than a . 5 mile to McCaskey High School, less than 2 miles from Route 30, and a short walk down the street from the Lancaster Science Factory! Backyard can be converted to off-street parking. Schedule a private showing today!
Key facts
- Unfinished basement
- Full bath
- Private front deck
Tags
Neighborhood map
What this means for you Summary
Snapshot
- This is a 3-bed/1.0-bath townhouse listed at $235k.
Deal economics
- At list price, monthly cash flow is $-103 ($-1k/yr) — negative.
- To cash-flow at today's rent, offer at most $217k (7.8% below list).
- To meet the 1% rule (rent ≥ 1% of price), the offer needs to be $191k (18.9% below list).
- Recommended offer: $191k (18.9% below list) — sets the bar for 1% rule.
- Cap rate 5.8% vs local median 4.2% in Lancaster — top-decile yield for the area; either an underpriced asset or a hidden risk that comps aren't pricing in. Stress-test before assuming the spread holds.
Location & tenants
- Location reads 85/100 on livability (#71 in PA, #498 nationally) — a professional / high-income tenant draw. Strengths: amenities A+, commute A+, cost of living A+; Watch: crime C-, employment C-.
- Lancaster SD (urban): math 12% / reading 25% proficiency, ranked #500 of 539 in PA (top 93%) — low school quality limits family demand, transient renter base, plan for 1-2y turnover; 72% free/reduced lunch — lower-income household profile, screen leases tightly.
- Market conditions: Rents rising (+1.2%/yr); 161 active listings in the ZIP; 30 comparable units currently listed for rent nearby; rentals at typical pace (median 21d on market — plan ~3-4 weeks tenant-placement turnaround); solid renter incomes; 1,093 units permitted in Lancaster County in 2024 (201 in 5+ unit buildings).
- This rent runs 30% of the median local income ($76k/yr) — at the standard rent-burdened threshold; future hikes will face affordability resistance.
Forward outlook
- Local home prices are declining (-3.0%/yr); year-one equity from $2k of loan paydown is wiped out by about $7k of value loss. Plan a longer hold.
- Lancaster County population projected at +5% by 2050 — modest demand growth; plan on rents tracking national, not racing it.
Negotiation context
- It's been on market 57 days — a 3% lower offer ($228k) is reasonable based on typical stale-listing flexibility.
- 5 sale attempts since 10y ago with the ask held roughly flat each time — persistent listings suggest the price (not the market) is what's stuck; bring a comps-based counter.
- Current owner paid $203k; 16% above their basis — modest negotiation headroom, anchor on the comps not their cost.
Risks & watch-outs
- Watch-outs: built in 1926 — expect roof / HVAC / electrical / plumbing capex.
- Climate carrying-cost: extreme-heat days projected 7→15/yr by 2055 (HVAC capex compounding) — expect insurance premiums to compound above CPI over the hold.
Questions for the listing agent
- What do current leases actually rent for vs. the listed asking? Can we see a recent rent roll and the last 12 months of T-12 income?
- It's been on market 57 days. Have you received any prior offers? Is the seller open to a 19% concession, seller financing, or rate buy-down credit?
- Built in 1926 — when were the roof, HVAC, electrical panel, plumbing, and water heater last replaced?
- Is there a deadline driving the sale (1031 exchange, divorce, estate, relocation)? That informs how much negotiation room exists.
- The area grade is low — what's the realistic commute time and amenity access for the typical tenant pool here? Any planned neighborhood developments (good or bad) we should know about?
- What's the average days-on-market for RENTAL listings here right now (not sales)? A rising rental-DOM trend means longer vacancies and softer asking-rent achievability than the comps imply.
- What's the recent tenant-quality profile in this submarket — average credit score on applications, eviction rate, late-payment / NSF rate, and stable-employment percentage? A property-management company in the area should have these aggregated.
- How much new for-sale + rental construction is in the pipeline within 1–3 miles? Heavy new supply typically softens prices + rents 12–24 months out; constrained supply supports both.
Investment metrics
- 1% rule
- 0.81% ✗
- Cap rate
- 5.77%
- Cash-on-cash
- -1.88%
- DSCR
- 0.92
- GRM
- 10.3
CMA / ARV
- ARV (median comp)
- $272,302
- List price
- $234,900
- Delta
- -13.74%
- Verdict
- UNDERPRICED
- Comps
- 20 within 1.0 mi
Show comp detail 12 sales within ~0.75 mi
| Address | Dist | Beds/Ba | Sqft | Sold | Price | $/sf | Match |
|---|---|---|---|---|---|---|---|
| 726 E Madison St | 0.31mi | 3/1.0 | 1,102 (+6%) | 2mo | $235,000 | $213 | 74 |
| 742 E Fulton St | 0.42mi | 3/1.0 | 1,068 (+3%) | 4mo | $205,000 | $192 | 73 |
| 665 Lehigh Ave | 0.24mi | 2/1.0 (-1) | 974 (-6%) | 4mo | $210,000 | $216 | 70 |
| 932 N Plum St | 0.46mi | 3/2.0 | 1,078 (+4%) | 1mo | $271,000 | $251 | 68 |
| 343 E Marion St | 0.63mi | 2/1.0 (-1) | 1,036 (-0%) | 1mo | $255,406 | $247 | 64 |
| 923 Lititz Ave | 0.66mi | 3/1.0 | 1,064 (+2%) | 3mo | $140,500 | $132 | 62 |
| 717 E Walnut St | 0.34mi | 3/1.5 | 1,170 (+12%) | 2mo | $284,900 | $244 | 60 |
| 855 Fountain Ave | 0.48mi | 2/1.0 (-1) | 1,124 (+8%) | 3mo | $241,000 | $214 | 57 |
| 247 N Shippen St #411 | 0.57mi | 2/2.0 (-1) | 1,132 (+9%) | 2mo | $205,000 | $181 | 48 |
| 624 Olive St | 0.41mi | 3/2.0 | 1,194 (+15%) | 5mo | $267,000 | $224 | 48 |
| 347 E Orange St | 0.66mi | 2/1.0 (-1) | 1,162 (+12%) | 0mo | $210,000 | $181 | 44 |
| 353 E Marion St | 0.63mi | 2/2.0 (-1) | 945 (-9%) | 4mo | $236,000 | $250 | 43 |
Match score weights: distance 35% · size 25% · config 20% · recency 20%. Top-matched comps best support the ARV.
Projected returns pro-forma
-3.0% appreciation · 1.2% rent growth · sell at horizon
- IRR
- -21.4%
- Equity multiple
- 0.27×
- Total profit
- $-48,005
- Equity at exit
- $35,024
- IRR
- -19.8%
- Equity multiple
- 0.03×
- Total profit
- $-63,602
- Equity at exit
- $20,310
Cash invested: $65,772 (down + closing). Projections, not guarantees.
Landlord ↔ Tenant lean methodology
- Overall (STATE)
- 62 Landlord-Friendly
- State Pennsylvania
- 62 Landlord-Friendly · EVEN
- County
- — inherits STATE
- City
- — inherits STATE
ZIP-level market 17602
- Rents YoY
- 1.2%
- Active inventory
- 161
- Price-to-rent
- 10.3×
Monthly cashflow live
- Estimated rent
- $1,906 high interval (Pro) →
- Mortgage (P&I)
- −$1,232
- Tax from tax record
- −$279 /mo · $3,351/yr
- Insurance
- −$98
- HOA
- −$0
- Vacancy / Maint / Mgmt
- −$400
- Net cashflow
- $-103
Break-even live
UW: 25.0% down · 7.5% · 30yr · 1.5% tax · 5.0% vac · 8.0% maint · 8.0% mgmt
Financing live
Cash to close
- Down payment
- $58,725
- Closing costs
- $7,047
- Reserves months
- —
- Total cash needed
- —
Loan-product check · same deal, 3 products live
Conventional
25% down · 7.5% · 30yr
- Down + closing
- —
- Monthly P&I
- —
- Monthly cashflow
- —
- DSCR
- —
- Eligible?
- —
Personal DTI + credit; lowest rate.
DSCR
20% down · 8.5% · 30yr
- Down + closing
- —
- Monthly P&I
- —
- Monthly cashflow
- —
- DSCR
- —
- Eligible?
- —
No personal income docs; deal must DSCR.
Hard money
10% down · 12.0% · 12mo
- Down + closing
- —
- Monthly P&I
- —
- Monthly cashflow
- —
- DSCR
- —
- Eligible?
- —
Short-term bridge; refi at stabilization.
Rent comps 30 comps
| Address | Beds | Baths | Sqft | Rent | $/sqft | DOM | Units | Dist |
|---|---|---|---|---|---|---|---|---|
| 766 New Holland Ave Lancaster, PA | 3.0 | 1.0 | 1152 | $1,795 | $1.56 | 14d | 1 | 0.17mi |
| 605 Lehigh Ave Lancaster, PA | 2.0 | 1.0 | 784 | $1,395 | $1.78 | 44d | 1 | 0.24mi |
| 738 E Madison St Lancaster, PA | 3.0 | 1.0 | 1102 | $1,750 | $1.59 | 44d | 1 | 0.30mi |
| 701 Martha Ave Lancaster, PA | 2.0 | 1.0–2.0 | 1096 | $2,600 | $2.37 | 14d | 1 | 0.37mi |
| 231 N Shippen St #224 Lancaster, PA | 2.0 | 2.0 | 1155 | $2,285 | $1.98 | 14d | 1 | 0.55mi |
| 135 E Ross St Unit 2nd Floor Lancaster, PA | 2.0 | 1.0 | 1000 | $1,575 | $1.57 | 14d | 1 | 0.65mi |
| 225 E King St Unit 2 Lancaster, PA | 2.0 | 2.5 | 1075 | $2,600 | $2.42 | 44d | 1 | 0.81mi |
| 225 E King St Unit 1 Lancaster, PA | 2.0 | 1.0 | 957 | $1,950 | $2.04 | 14d | 1 | 0.81mi |
| 425 N Prince St Apt 206 Lancaster, PA | 2.0 | 2.0 | 1138 | $1,995 | $1.75 | 44d | 1 | 0.87mi |
| 202 N Queen St Lancaster, PA | 2.0 | 1.0–2.0 | 697 | $2,718 | $3.90 | 14d | 12 | 0.89mi |
| 1000 Strand WAY Neffsville, PA | 1.0–2.0 | 1.0–2.0 | 1033 | $2,850 | $2.76 | 14d | 15 | 0.92mi |
| 1216 Clark St Lancaster, PA | 4.0 | 1.5 | 1270 | $2,195 | $1.73 | 14d | 1 | 0.95mi |
| 767 Clermont Ave Lancaster, PA | 2.0 | 1.0 | 850 | $1,395 | $1.64 | 14d | 1 | 0.96mi |
| 816 N Prince St Lancaster, PA | 1.0–2.0 | 1.0–2.0 | 794 | $2,195 | $2.76 | 14d | 7 | 0.97mi |
| 50 Knollwood Dr Lancaster, PA | 2.0 | 1.5 | 1067 | $1,925 | $1.80 | 14d | 3 | 1.01mi |
| 118 N Prince St Lancaster, PA | 1.0–3.0 | 1.0–3.0 | 1274 | $4,703 | $3.69 | 14d | 48 | 1.03mi |
| 1405 Oregon Pike Apt A Lancaster, PA | 2.0 | 1.0 | 1000 | $1,295 | $1.29 | 44d | 1 | 1.08mi |
| 5000 Foundry Dr Lancaster, PA | 1.0–2.0 | 1.0–2.0 | 970 | $2,575 | $2.65 | 14d | 10 | 1.14mi |
| 128 N Mulberry St Unit 1 Lancaster, PA | 2.0 | 2.0 | 1500 | $2,250 | $1.50 | 23d | 1 | 1.16mi |
| 1522 Princess Anne Dr Lancaster, PA | 4.0 | 2.0 | 1352 | $2,400 | $1.78 | 44d | 1 | 1.23mi |
| 433 W Walnut St Apt 2 Lancaster, PA | 2.0 | 1.0 | 900 | $1,840 | $2.04 | 23d | 1 | 1.25mi |
| 549 Howard Ave Lancaster, PA | 4.0 | 1.0 | 1439 | $1,700 | $1.18 | 44d | 1 | 1.28mi |
| 214 W Strawberry St Lancaster, PA | 3.0 | 1.0 | 1175 | $1,345 | $1.14 | 21d | 1 | 1.29mi |
| 537 Woodward St Lancaster, PA | 3.0 | 2.0 | 1288 | $1,650 | $1.28 | 23d | 1 | 1.33mi |
| 345 1/2 Beaver St Lancaster, PA | 4.0 | 1.0 | 1382 | $2,095 | $1.52 | 44d | 1 | 1.35mi |
| 404 Beaver St Lancaster, PA | 3.0 | 1.0 | 1025 | $1,425 | $1.39 | 23d | 1 | 1.39mi |
| 37 E Filbert St Lancaster, PA | 3.0 | 1.0 | 1002 | $1,750 | $1.75 | 44d | 1 | 1.43mi |
| 1635 Old Philadelphia Pike Lancaster, PA | 2.0 | 2.0 | 1160 | $1,845 | $1.59 | 14d | 1 | 1.44mi |
| 513 Poplar St Lancaster, PA | 3.0 | 1.5 | 1184 | $1,695 | $1.43 | 44d | 1 | 1.46mi |
| 529 Manor St Lancaster, PA | 3.0 | 1.0 | 1434 | $1,635 | $1.14 | 14d | 1 | 1.50mi |
Listing history 31 events
-
2026-06-18days on market $234,900 Active 57 DOM
-
2026-06-17days on market $234,900 Active 56 DOM
-
2026-06-16days on market $234,900 Active 55 DOM
-
2026-06-15days on market $234,900 Active 54 DOM
-
2026-06-14days on market $234,900 Active 52 DOM
-
2026-06-13days on market $234,900 Active 51 DOM
-
2026-06-10days on market $234,900 Active 49 DOM
-
2026-06-09days on market $234,900 Active 48 DOM
-
2026-06-08days on market $234,900 Active 47 DOM
-
2026-06-07days on market $234,900 Active 46 DOM
-
2026-06-03days on market $234,900 Active 42 DOM
-
2026-06-02days on market $234,900 Active 41 DOM
-
2026-06-01days on market $234,900 Active 40 DOM
-
2026-05-31days on market $234,900 Active 39 DOM
-
2026-05-30days on market $234,900 Active 38 DOM
-
2026-04-22$234,900 Active 814-char remark
Show marketing remark (814 chars)
Welcome to 654 New Holland Avenue - a 3 bedroom, 1 bathroom home in the heart of Lancaster city. Enter through the private front deck to the spacious, open-layout main level just waiting for you to make it your own. The second level has 3 cozy bedrooms, including a primary bedroom with front facing windows and ceiling fan. Enjoy a full bath - boasting a tub/shower combo w/ grab bars for added accessibility - and a skylight! The full, unfinished basement offers endless possibilities for future finishing, but currently has great storage potential w/ washer & dryer hookups. Less than a . 5 mile to McCaskey High School, less than 2 miles from Route 30, and a short walk down the street from the Lancaster Science Factory! Backyard can be converted to off-street parking. Schedule a private showing today!
-
2026-01-08historical
-
2025-11-11price $234,900
-
2025-10-09$242,999 Active
-
2023-04-14soldstatus $203,000 Closed
-
2023-03-11status Pending
-
2023-02-18$208,000 Active
-
2023-02-16historical $208,000
-
2020-10-15soldstatus $138,000
-
2020-10-12soldstatus $138,000 Closed
-
2020-09-28status Pending
-
2020-09-25$135,000 Active
-
2016-06-13soldstatus $79,900
-
2016-05-20soldstatus $79,900
-
2016-03-26historical
-
2016-03-15$79,900
ⓘ Source: listings_history table (triggers on properties + properties_extension) + one-shot
backfill from property_details.listing_events for pre-trigger history.
Tax reassessment forecast PA · Partial reset (capped growth)
- Current annual tax
- $3,351 · $279/mo
- Projected year-2 tax
- $3,531 · $294/mo
- Expected delta
- +$180/yr (+$15/mo · 5.4%)
ⓘ Screening estimate from a state-policy table — verify with the county assessor before closing.
Climate risk First Street
- Flood 1/10 Low FEMA zone X (unshaded) · 0% chance over 30 yrs
- Wildfire 1/10 Low
- Heat 6/10 Major 7 d/yr ≥101°F today · 15 d/yr by 30 yrs out
- Wind 4/10 Moderate 15% chance of damaging wind over 30 yrs
- Air quality 4/10 Moderate 4 unhealthy d/yr today · 7 by 30 yrs out
Nearby sold comps map
Loading sold comps map…
Walkable amenities ~0.75 mi
Loading nearby amenities…
Taxation est. · year 1
- Rental income
- $22,873
- − Mortgage interest
- −$13,158
- − Property taxes
- −$3,351
- − Insurance
- −$1,174
- − Repairs & maintenance
- −$1,830
- − Management
- −$1,830
- − Depreciation
- −$6,833
- Taxable loss
- −$5,303
- Est. tax savings @ 24.0%
- +$1,273
- After-tax cash flow
- $35/yr
For passive investors: Depreciation is non-cash, so a rental often shows a tax loss while cash-flowing — sheltering income. Rental losses are passive: they offset passive income freely, and up to $25,000/yr can offset ordinary (W-2) income if you actively participate and your MAGI is under $100k (phasing out to $0 by $150k); unused losses carry forward. On sale, claimed depreciation is recaptured at up to 25%, and gains may owe capital-gains tax (a 1031 exchange can defer both). Figures are a year-1 estimate at your 24.0% rate — not tax advice; consult a CPA.
Schools (NCES district)
- District
- Lancaster SD
- NCES district ID
- 4213140
- Math proficiency
- 12% ▼ -10.00%
- Reading proficiency
- 25% ▼ -13.00%
- Median HH income
- $38,500
- Composite
- 15.52/100
- National rank
- #9301
- State rank
- #500 of 539 in PA
Livability — Lancaster
- Score
- 85/100
- State rank
- #71
- US rank
- #498
Category grades
Schools grade is shown separately in the Schools card above.
Census & demographics
- Census place
- Lancaster, PA
- County
- Lancaster County · 390,309 people
- City population
- 176,170
- Metro
- Lancaster, PA
- Population (ZIP)
- 52,217
- Household income
- $75,862
- Rent vs Own
- Severe rent burden
- 1556.0
Population outlook (Lancaster County) Hauer SSP2
- Today (2025)
- 561,011 people
- By 2030
- 570,969 · +1.8%
- By 2040
- 585,929 · +4.4%
- By 2050
- 591,056 · +5.4%
- By 2075
- 594,747 · +6.0%
- By 2100
- 558,850 · -0.4%
Race, ethnicity, and origin ACS 2023
- Neighborhood character
- Diverse neighborhood (Simpson 0.61)
- Race & ethnicity
- White 52% Hispanic / Latino 32% Two or more races 12% Black 11% Asian 2%
- Hispanic origin (detail)
- Mexican 2% Puerto Rican 21% Cuban 1% Dominican 4%
- Common ancestry
- Romanian 2% Italian 1% Lithuanian 1%
- Foreign-born
- 13% · Canada, Vietnam, South Korea
- Languages at home
- 70% English-only · Spanish 22% German/W. Germanic 2% French/Haitian/Cajun 1%
Political lean MEDSL · Lancaster
- 2024 margin
- R (+15.9) · D 41.5% · R 57.5%
- 2008→2024 swing
- -4.1pp toward R · 2008: -11.8pp · 2024: -15.9pp
- All cycles
- 2024: R+15.9 2020: R+15.8 2016: R+19.7 2012: R+19.2 2008: R+11.8
Not yet ingested
- Civics
- —
Market trends
- HPI YoY
- ▼ -248.05%
- Current HPI
- 288.9141
- Rent YoY
- ▲ 1.20%
- Metro
- Lancaster, PA
- State GDP YoY
- ▲ 1.68%
- F500 in state
- 34
Industry mix (Fortune 500 HQ in PA)
| Industry | F500 HQs | Revenue |
|---|---|---|
| Healthcare | 2 | $309B |
|
||
| Insurance | 2 | $27B |
|
||
| Telecommunications / Media | 1 | $124B |
|
||
| Industrial Distribution | 1 | $22B |
|
||
| Financial Services | 1 | $20B |
|
||
| Chemicals / Materials | 1 | $18B |
|
||
Price history
+194.0% since first listed16 events — show timeline
- 2026-04-22 Listed $234,900 BRIGHT MLS
- 2026-01-08 Listing Removed — BRIGHT MLS
- 2025-11-11 Price Changed $234,900 BRIGHT MLS
- 2025-10-09 Listed $242,999 BRIGHT MLS
- 2023-04-14 Sold (MLS) $203,000 BRIGHT MLS
- 2023-03-11 Pending — BRIGHT MLS
- 2023-02-18 Listed $208,000 BRIGHT MLS
- 2023-02-16 Coming Soon $208,000 BRIGHT MLS
- 2020-10-15 Sold (Public Records) $138,000 Public Records
- 2020-10-12 Sold (MLS) $138,000 BRIGHT MLS
- 2020-09-28 Pending — BRIGHT MLS
- 2020-09-25 Listed $135,000 BRIGHT MLS
- 2016-06-13 Sold (Public Records) $79,900 Public Records
- 2016-05-20 Sold (MLS) $79,900 BRIGHT MLS
- 2016-03-26 Listing Removed — BRIGHT MLS
- 2016-03-15 Listed $79,900 BRIGHT MLS
Property tax history
+1.4%/yrLatest (2026): $3,351 · +3.3% YoY. Source: county tax records.
Cash-flow waterfall
monthlySold comps — $/sqft
last 12 mo · ≤1 miLoading sold comps…