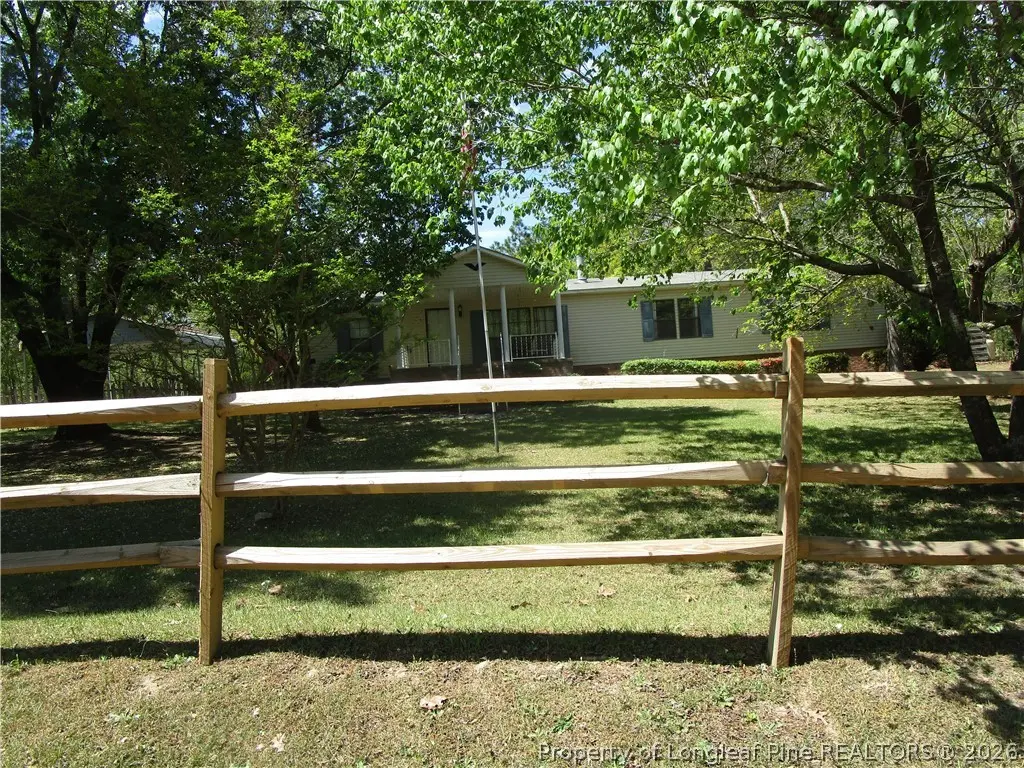
128 Autumn Dr · Spring Lake, NC
Flood risk 1/10 · Minimal
- FEMA flood zone
- X (unshaded)
- Chance of flooding over 30 yrs
- 0.0%
- Est. flood insurance / yr
- $507 – $1,088
Fire risk 6/10 · Moderate
- Est. fire insurance / yr
- $906 – $1,684
Heat risk 6/10 · Moderate
- Hot days now (above 107°F)
- 7 days/yr
- Hot days in 30 yrs
- 16 days/yr
Wind risk 6/10 · Moderate
- Chance of severe wind over 30 yrs
- 66.0%
Air-quality risk 1/10 · Minimal
- Unhealthy air days now
- 0 days/yr
- Unhealthy air days in 30 yrs
- 0 days/yr
Risk factors via First Street. Map © Google.
Why this score? — see what drove the B- grade
The composite is a weighted blend of 9 inputs, each scored 0–100. Each bar is that input's sub-score; the figure is the points it added to the 100-point composite (weight × sub-score).
- Cash flow +30.0/30.0
- DSCR +10.0/10.0
- 1% rule +8.8/10.0
- ARV discount +7.5/15.0
- Schools +4.4/10.0
- Livability +3.0/5.0
- Rent growth +2.5/5.0
- Condition / age +2.5/5.0
- Appreciation +0.0/10.0
$160,000
🖨 Deal sheet 📄 Offer letter ✓ Due diligence
Listing remarks
Affordable 3 bedroom, 2 bath home, on just over an acre in rural subdivision convenient to Fort Bragg, Pope Army airfield off of Vass rd. . Home has plenty of space with open design with lots of family area, , double sided fireplace. Needs some TLC and Seller would be amicable to some repairs depending upon price and terms. As is price is listed, reasonable repairs/upgrades can be added to price. Home has lots of extras such as Storm shelter and detached garage/workshop w/ leanto area for equipment. Aluminum carport, wood deck and fenced back yard. Split rail fencing and metal farm gate for security purposes highlight the huge front yard. Large country porch with porch swing to enjoy the n
Key facts
- Wood deck
- Fenced back yard
- Split rail fencing
Tags
Property features AI
Exterior
- Parking: Detached garage with 1 covered garage space
- Utilities: Public water; Holding tank and septic tank for sewer
- Home design: Residential manufactured home; Located in the Riverbend subdivision; Zoned Residential District
- Construction: Vinyl siding
- Exterior features: Storm door(s); Workshop
Interior
- Kitchen: Dishwasher; Electric oven; Free-standing electric range; Gas range; Refrigerator; Stainless steel appliances; Exhaust fan
- Bedrooms: 6 total rooms (includes bedrooms and living spaces)
- Flooring: Vinyl flooring; Carpet
- Bathrooms: 2 full bathrooms
- Heating & cooling: Natural gas heating; Propane stove; Ceiling fans for cooling
- Interior features: Ceiling fans; Double vanity; Laminate countertops; Bar; Two fireplaces (double-sided, serving den/family room and dining room); Crawl space basement
- Laundry & utility: Electric water heater
Neighborhood map
What this means for you Summary
Snapshot
- This is a 3-bed/2.0-bath single-family listed at $160k.
Deal economics
- At list price, monthly cash flow is $803 ($10k/yr) — positive.
- The deal already cash-flows at list — no discount required.
- Meets the 1% rule at list price ($2k rent vs $160k).
- Recommended offer: $155k (3.0% below list) — sets the bar for market timing.
- Cap rate 12.3% vs local median 4.5% in Spring Lake — top-decile yield for the area; either an underpriced asset or a hidden risk that comps aren't pricing in. Stress-test before assuming the spread holds.
Location & tenants
- Location reads 59/100 on livability (#543 in NC) — a working-class tenant base; expect higher turnover. Strengths: cost of living A+, housing A+; Watch: crime F, amenities F, commute F.
- Moore County Schools (rural): math 48% / reading 54% proficiency, ranked #58 of 178 in NC (top 33%) — acceptable for families but not a draw, mixed tenant base, ~2y average lease.
- Zoned schools: Crain'S Creek Middle (math 37% / reading 47%, grade D-, #199 of 475 statewide, top 43%, 592 students, 51% FRL); Union Pines High (math 63% / reading 70%, grade B, #150 of 535 statewide, top 28%, 1,438 students, 34% FRL) — zoned schools at 42% FRL track the district average.
- Market conditions: 225 active listings in the ZIP; solid renter incomes; 941 units permitted in Moore County in 2024 (0 in 5+ unit buildings).
- This rent runs 33% of the median local income ($80k/yr) — at the standard rent-burdened threshold; future hikes will face affordability resistance.
Forward outlook
- Local home prices are declining (-3.0%/yr); year-one equity from $1k of loan paydown is wiped out by about $5k of value loss. Plan a longer hold.
- Moore County population projected at +29% by 2050 — long-run rental-demand tailwind backs the buy-and-hold thesis.
- At projected returns (-3.0% appreciation + 3.0% rent growth), your $45k cash investment doubles in ~6 years — after that, you're playing with house money.
Negotiation context
- It's been on market 55 days — a 3% lower offer ($155k) is reasonable based on typical stale-listing flexibility.
Risks & watch-outs
- Climate carrying-cost: major wind risk, 66% chance of damaging wind over 30y; major wildfire risk; extreme-heat days projected 7→16/yr by 2055 (HVAC capex compounding) — expect insurance premiums to compound above CPI over the hold.
Questions for the listing agent
- It's been on market 55 days. Have you received any prior offers? Is the seller open to a 3% concession, seller financing, or rate buy-down credit?
- Is there a deadline driving the sale (1031 exchange, divorce, estate, relocation)? That informs how much negotiation room exists.
- Schools are D-rated, which usually means shorter tenancies and higher turnover. Who's the typical renter profile here, and what's been the actual vacancy rate?
- Crime grade is F in this area — have there been break-ins, vandalism, or insurance claims at this property in the last 3 years? What carrier currently insures it and at what premium?
- What's the average days-on-market for RENTAL listings here right now (not sales)? A rising rental-DOM trend means longer vacancies and softer asking-rent achievability than the comps imply.
- What's the recent tenant-quality profile in this submarket — average credit score on applications, eviction rate, late-payment / NSF rate, and stable-employment percentage? A property-management company in the area should have these aggregated.
- How much new for-sale + rental construction is in the pipeline within 1–3 miles? Heavy new supply typically softens prices + rents 12–24 months out; constrained supply supports both.
Investment metrics
- 1% rule
- 1.38% ✓
- Cap rate
- 12.31%
- Cash-on-cash
- 21.50%
- DSCR
- 1.96
- GRM
- 6.0
CMA / ARV
No comps found within radius.
Projected returns pro-forma
-3.0% appreciation · 3.0% rent growth · sell at horizon
- IRR
- 14.0%
- Equity multiple
- 1.56×
- Total profit
- $25,136
- Equity at exit
- $23,857
- IRR
- 22.8%
- Equity multiple
- 2.95×
- Total profit
- $87,453
- Equity at exit
- $13,834
Cash invested: $44,800 (down + closing). Projections, not guarantees.
Landlord ↔ Tenant lean methodology
- Overall (STATE)
- 85 Strongly Landlord-Friendly
- State North Carolina
- 85 Strongly Landlord-Friendly · R+3
- County
- — inherits STATE
- City
- — inherits STATE
ZIP-level market 28394
- Active inventory
- 225
- Price-to-rent
- 6.0×
Monthly cashflow live
- Estimated rent
- $2,209 medium interval (Pro) →
- Mortgage (P&I)
- −$839
- Tax from tax record
- −$37 /mo · $442/yr
- Insurance
- −$67
- HOA
- −$0
- Vacancy / Maint / Mgmt
- −$464
- Net cashflow
- $803
Break-even live
UW: 25.0% down · 7.5% · 30yr · 1.5% tax · 5.0% vac · 8.0% maint · 8.0% mgmt
Financing live
Cash to close
- Down payment
- $40,000
- Closing costs
- $4,800
- Reserves months
- —
- Total cash needed
- —
Loan-product check · same deal, 3 products live
Conventional
25% down · 7.5% · 30yr
- Down + closing
- —
- Monthly P&I
- —
- Monthly cashflow
- —
- DSCR
- —
- Eligible?
- —
Personal DTI + credit; lowest rate.
DSCR
20% down · 8.5% · 30yr
- Down + closing
- —
- Monthly P&I
- —
- Monthly cashflow
- —
- DSCR
- —
- Eligible?
- —
No personal income docs; deal must DSCR.
Hard money
10% down · 12.0% · 12mo
- Down + closing
- —
- Monthly P&I
- —
- Monthly cashflow
- —
- DSCR
- —
- Eligible?
- —
Short-term bridge; refi at stabilization.
Listing history 17 events
-
2026-06-19days on market $160,000 Active 55 DOM
-
2026-06-18days on market $160,000 Active 54 DOM
-
2026-06-17days on market $160,000 Active 53 DOM
-
2026-06-16days on market $160,000 Active 52 DOM
-
2026-06-15days on market $160,000 Active 51 DOM
-
2026-06-14days on market $160,000 Active 49 DOM
-
2026-06-13days on market $160,000 Active 48 DOM
-
2026-06-10days on market $160,000 Active 46 DOM
-
2026-06-09days on market $160,000 Active 45 DOM
-
2026-06-08days on market $160,000 Active 44 DOM
-
2026-06-07days on market $160,000 Active 43 DOM
-
2026-06-05days on market $160,000 Active 40 DOM
-
2026-06-02days on market $160,000 Active 38 DOM
-
2026-06-01days on market $160,000 Active 37 DOM
-
2026-05-31days on market $160,000 Active 36 DOM
-
2026-05-30days on market $160,000 Active 35 DOM
-
2026-04-25$160,000 Active
ⓘ Source: listings_history table (triggers on properties + properties_extension) + one-shot
backfill from property_details.listing_events for pre-trigger history.
Tax reassessment forecast NC · Resets to sale price
- Current annual tax
- $442 · $37/mo
- Projected year-2 tax
- $1,312 · $109/mo
- Expected delta
- +$870/yr (+$72/mo · 196.8%)
ⓘ Screening estimate from a state-policy table — verify with the county assessor before closing.
Climate risk First Street
- Flood 1/10 Low FEMA zone X (unshaded) · 0% chance over 30 yrs
- Wildfire 6/10 Major
- Heat 6/10 Major 7 d/yr ≥107°F today · 16 d/yr by 30 yrs out
- Wind 6/10 Major 66% chance of damaging wind over 30 yrs
- Air quality 1/10 Low 0 unhealthy d/yr today · 0 by 30 yrs out
Nearby sold comps map
Loading sold comps map…
Walkable amenities ~0.75 mi
Loading nearby amenities…
Taxation est. · year 1
- Rental income
- $26,512
- − Mortgage interest
- −$8,962
- − Property taxes
- −$442
- − Insurance
- −$800
- − Repairs & maintenance
- −$2,121
- − Management
- −$2,121
- − Depreciation
- −$4,655
- Taxable income
- $7,411
- Est. tax owed @ 24.0%
- −$1,779
- After-tax cash flow
- $7,855/yr
For passive investors: Depreciation is non-cash, so a rental often shows a tax loss while cash-flowing — sheltering income. Rental losses are passive: they offset passive income freely, and up to $25,000/yr can offset ordinary (W-2) income if you actively participate and your MAGI is under $100k (phasing out to $0 by $150k); unused losses carry forward. On sale, claimed depreciation is recaptured at up to 25%, and gains may owe capital-gains tax (a 1031 exchange can defer both). Figures are a year-1 estimate at your 24.0% rate — not tax advice; consult a CPA.
Schools (NCES district)
- District
- Moore County Schools
- NCES district ID
- 3703090
- Math proficiency
- 48% ▲ 5.00%
- Reading proficiency
- 54% ▲ 5.00%
- Median HH income
- $50,333
- Composite
- 43.63/100
- National rank
- #2967
- State rank
- #58 of 178 in NC
Livability — Spring Lake
- Score
- 59/100
- State rank
- #543
- US rank
- #19811
Category grades
Schools grade is shown separately in the Schools card above.
Census & demographics
- County
- Moore County · 75,247 people
- City population
- 24,000
- Metro
- Pinehurst-Southern Pines, NC
- Population (ZIP)
- 5,936
- Household income
- $79,643
- Rent vs Own
- Severe rent burden
- 109.0
Population outlook (Moore County) Hauer SSP2
- Today (2025)
- 106,902 people
- By 2030
- 113,134 · +5.8%
- By 2040
- 125,682 · +17.6%
- By 2050
- 137,811 · +28.9%
- By 2075
- 164,387 · +53.8%
- By 2100
- 175,595 · +64.3%
Race, ethnicity, and origin ACS 2023
- Neighborhood character
- Predominantly White (74%)
- Race & ethnicity
- White 74% Two or more races 10% Black 9% Hispanic / Latino 8%
- Hispanic origin (detail)
- Mexican 2%
- Common ancestry
- Slovak 6% Italian 2% Romanian 1%
- Foreign-born
- 6% · Canada, Jamaica
- Languages at home
- 91% English-only · Spanish 6% Arabic 2%
Political lean MEDSL · Moore
- 2024 margin
- Strong R (+29.5) · D 34.8% · R 64.3%
- 2008→2024 swing
- -8.1pp toward R · 2008: -21.4pp · 2024: -29.5pp
- All cycles
- 2024: R+29.5 2020: R+27.4 2016: R+29.6 2012: R+28.1 2008: R+21.4
Not yet ingested
- Civics
- —
Market trends
- HPI YoY
- ▼ -106.99%
- Current HPI
- 160.0419
- Rent YoY
- —
- Metro
- Pinehurst-Southern Pines, NC
- State GDP YoY
- ▲ 3.28%
- F500 in state
- 26
Industry mix (Fortune 500 HQ in NC)
| Industry | F500 HQs | Revenue |
|---|---|---|
| Financial Services | 2 | $213B |
|
||
| Retail | 2 | $95B |
|
||
| Industrial Conglomerate | 1 | $38B |
|
||
| Metals / Steel | 1 | $35B |
|
||
| Utilities | 1 | $30B |
|
||
| Industrial Machinery | 1 | $19B |
|
||
Price history
1 event — show timeline
- 2026-04-25 Listed $160,000 LPRMLS
Property tax history
-1.9%/yrLatest (2024): $442 · -4.4% YoY. Source: county tax records.
Cash-flow waterfall
monthlySold comps — $/sqft
last 12 mo · ≤1 miLoading sold comps…