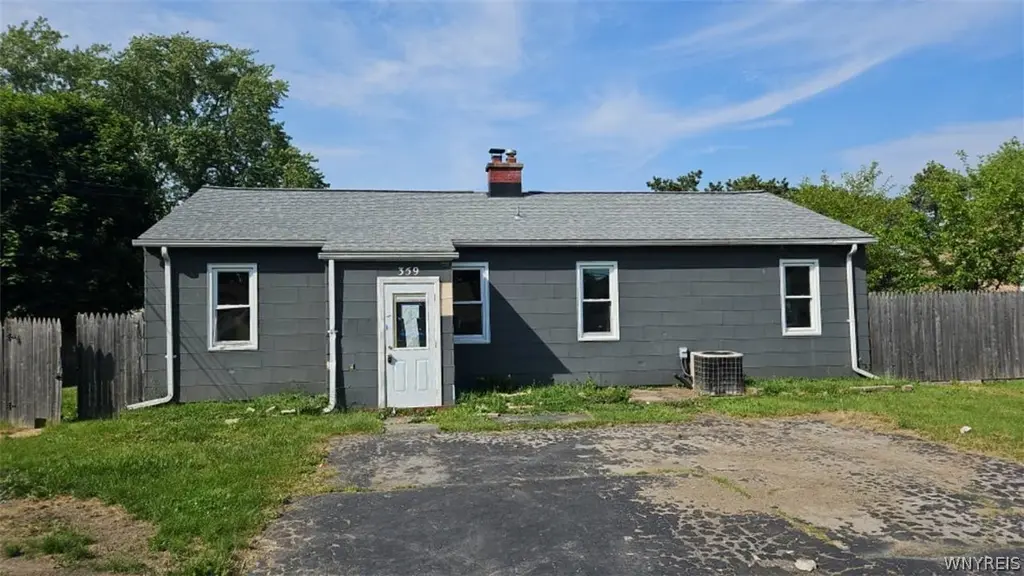
359 Ridgewood Cir #357 · Lackawanna, NY
Flood risk 1/10 · Minimal
- FEMA flood zone
- X (unshaded)
- Chance of flooding over 30 yrs
- 0.0%
- Est. flood insurance / yr
- $473 – $860
Fire risk 1/10 · Minimal
- Est. fire insurance / yr
- $691 – $1,283
Heat risk 3/10 · Minor
- Hot days now (above 92°F)
- 7 days/yr
- Hot days in 30 yrs
- 16 days/yr
Wind risk 1/10 · Minimal
- Chance of severe wind over 30 yrs
- —
Air-quality risk 4/10 · Minor
- Unhealthy air days now
- 3 days/yr
- Unhealthy air days in 30 yrs
- 8 days/yr
Risk factors via First Street. Map © Google.
Why this score? — see what drove the B- grade
The composite is a weighted blend of 9 inputs, each scored 0–100. Each bar is that input's sub-score; the figure is the points it added to the 100-point composite (weight × sub-score).
- Cash flow +30.0/30.0
- 1% rule +10.0/10.0
- DSCR +10.0/10.0
- ARV discount +7.5/15.0
- Livability +3.8/5.0
- Rent growth +2.5/5.0
- Condition / age +2.5/5.0
- Schools +2.0/10.0
- Appreciation +0.0/10.0
$99,900
🖨 Deal sheet 📄 Offer letter ✓ Due diligence
Listing remarks
Three bedroom in the highly sought after Ridgewood Village located just minutes from Buffalo. It has a lot of potential, needs work, selling as is.
Key facts
- 0.31 acre lot
- Built 1940
- Listed 5 days
Property features AI
Exterior
- Parking: No garage
- Utilities: Public water connected; Sewer connected
- Home design: Single-story home; Existing construction; Shingle roof; Composite siding; Stone foundation
- Construction: Built previously (existing); Composite siding construction; Shingle roof; Stone foundation
- Exterior features: Blacktop driveway; Rectangular residential lot; Road frontage on a city street; Lot dimensions approximately 98 x 136
Interior
- Kitchen: Eat-in kitchen
- Bedrooms: Three bedrooms on the main level
- Flooring: Hardwood; Vinyl; Varies
- Bathrooms: One full bathroom on the main level
- Heating & cooling: Gas forced-air heating; Central air conditioning
- Interior features: Eat-in kitchen; Partial basement
- Laundry & utility: Main-level laundry; Gas water heater
Neighborhood map
What this means for you Summary
Snapshot
- This is a 3-bed/1.0-bath single-family listed at $100k.
Deal economics
- At list price, monthly cash flow is $463 ($6k/yr) — positive.
- The deal already cash-flows at list — no discount required.
- Meets the 1% rule at list price ($2k rent vs $100k).
- Cap rate 11.9% vs local median 5.4% in Lackawanna — top-decile yield for the area; either an underpriced asset or a hidden risk that comps aren't pricing in. Stress-test before assuming the spread holds.
Location & tenants
- Location reads 75/100 on livability (#254 in NY, #4,026 nationally) — a middle-class / working-renter tenant base. Strengths: commute A+, cost of living A+, housing A+; Watch: crime C-, schools D+, employment D+.
- Lackawanna City School District (suburban): math 19% / reading 29% proficiency, ranked #588 of 590 in NY (top 100%) — low school quality limits family demand, transient renter base, plan for 1-2y turnover; 71% free/reduced lunch — lower-income household profile, screen leases tightly.
- Market conditions: 92 active listings in the ZIP; 5 comparable units currently listed for rent nearby; rentals leasing fast (median 2d on market — plan ~1-2 weeks tenant-placement turnaround); 1,244 units permitted in Erie County in 2024 (563 in 5+ unit buildings).
Forward outlook
- Local home prices are declining (-3.0%/yr); year-one equity from $691 of loan paydown is wiped out by about $3k of value loss. Plan a longer hold.
- At projected returns (-3.0% appreciation + 3.0% rent growth), your $28k cash investment doubles in ~7 years — after that, you're playing with house money.
Negotiation context
- Only 5 days on market — expect competitive offers; lowballing is unlikely to land.
- Current owner paid $50k; list at $100k implies a 100% gain — meaningful room to come down on a strong offer.
Risks & watch-outs
- Watch-outs: built in 1940 — expect roof / HVAC / electrical / plumbing capex.
Questions for the listing agent
- Built in 1940 — when were the roof, HVAC, electrical panel, plumbing, and water heater last replaced?
- Is there a deadline driving the sale (1031 exchange, divorce, estate, relocation)? That informs how much negotiation room exists.
- Schools are D-rated, which usually means shorter tenancies and higher turnover. Who's the typical renter profile here, and what's been the actual vacancy rate?
- What's the average days-on-market for RENTAL listings here right now (not sales)? A rising rental-DOM trend means longer vacancies and softer asking-rent achievability than the comps imply.
- What's the recent tenant-quality profile in this submarket — average credit score on applications, eviction rate, late-payment / NSF rate, and stable-employment percentage? A property-management company in the area should have these aggregated.
- How much new for-sale + rental construction is in the pipeline within 1–3 miles? Heavy new supply typically softens prices + rents 12–24 months out; constrained supply supports both.
Investment metrics
- 1% rule
- 1.54% ✓
- Cap rate
- 11.85%
- Cash-on-cash
- 19.86%
- DSCR
- 1.88
- GRM
- 5.4
CMA / ARV
- ARV (on-the-fly)
- $240,900
- Comps found
- 12
Show comp detail 12 sales within ~0.75 mi
| Address | Dist | Beds/Ba | Sqft | Sold | Price | $/sf | Match |
|---|---|---|---|---|---|---|---|
| 321 Tampa Dr | 0.31mi | 3/2.0 | 1,000 (-9%) | 0mo | $285,000 | $285 | 66 |
| 331 S Shore Blvd | 0.50mi | 4/1.0 (+1) | 1,139 (+4%) | 4mo | $185,000 | $162 | 62 |
| 41 Elmview Ave | 0.30mi | 3/1.5 | 1,206 (+10%) | 10mo | $245,000 | $203 | 60 |
| 357 S Shore Blvd | 0.52mi | 3/2.0 | 1,139 (+4%) | 9mo | $250,000 | $219 | 58 |
| 48 Ward Ct | 0.65mi | 3/1.0 | 1,054 (-4%) | 9mo | $228,000 | $216 | 55 |
| 238 Orchard Pl | 0.63mi | 3/1.0 | 1,003 (-9%) | 3mo | $220,238 | $220 | 54 |
| 33 Julian Ave #33 | 0.36mi | 2/1.0 (-1) | 1,264 (+15%) | 2mo | $170,000 | $134 | 52 |
| 173 Tampa Dr | 0.55mi | 3/1.5 | 1,008 (-8%) | 9mo | $235,000 | $233 | 51 |
| 199 Orchard Pl | 0.64mi | 3/1.0 | 1,003 (-9%) | 12mo | $199,900 | $199 | 45 |
| 92 Saint Jude Dr | 0.59mi | 3/1.0 | 972 (-12%) | 10mo | $290,000 | $298 | 45 |
| 56 Hansen Ave | 0.62mi | 3/1.0 | 968 (-12%) | 10mo | $325,000 | $336 | 43 |
| 85 Pacific Ave | 0.73mi | 3/1.0 | 950 (-14%) | 8mo | $206,000 | $217 | 36 |
Match score weights: distance 35% · size 25% · config 20% · recency 20%. Top-matched comps best support the ARV.
Projected returns pro-forma
-3.0% appreciation · 3.0% rent growth · sell at horizon
- IRR
- 12.0%
- Equity multiple
- 1.48×
- Total profit
- $13,356
- Equity at exit
- $14,895
- IRR
- 21.0%
- Equity multiple
- 2.78×
- Total profit
- $49,840
- Equity at exit
- $8,638
Cash invested: $27,972 (down + closing). Projections, not guarantees.
Landlord ↔ Tenant lean methodology
- Overall (STATE)
- 15 Strongly Tenant-Friendly
- State New York
- 15 Strongly Tenant-Friendly · D+10
- County
- — inherits STATE
- City
- — inherits STATE
ZIP-level market 14218
- Home prices YoY
- -9.2%
- Active inventory
- 92
- Price-to-rent
- 5.4×
Monthly cashflow live
- Estimated rent
- $1,536 high interval (Pro) →
- Mortgage (P&I)
- −$524
- Tax from tax record
- −$185 /mo · $2,219/yr
- Insurance
- −$42
- HOA
- −$0
- Vacancy / Maint / Mgmt
- −$323
- Net cashflow
- $463
Break-even live
UW: 25.0% down · 7.5% · 30yr · 1.5% tax · 5.0% vac · 8.0% maint · 8.0% mgmt
Financing live
Cash to close
- Down payment
- $24,975
- Closing costs
- $2,997
- Reserves months
- —
- Total cash needed
- —
Loan-product check · same deal, 3 products live
Conventional
25% down · 7.5% · 30yr
- Down + closing
- —
- Monthly P&I
- —
- Monthly cashflow
- —
- DSCR
- —
- Eligible?
- —
Personal DTI + credit; lowest rate.
DSCR
20% down · 8.5% · 30yr
- Down + closing
- —
- Monthly P&I
- —
- Monthly cashflow
- —
- DSCR
- —
- Eligible?
- —
No personal income docs; deal must DSCR.
Hard money
10% down · 12.0% · 12mo
- Down + closing
- —
- Monthly P&I
- —
- Monthly cashflow
- —
- DSCR
- —
- Eligible?
- —
Short-term bridge; refi at stabilization.
Rent comps 5 comps
| Address | Beds | Baths | Sqft | Rent | $/sqft | DOM | Units | Dist |
|---|---|---|---|---|---|---|---|---|
| 133 Orchard Pl Lackawanna, NY | 1.0–2.0 | 1.0 | 700 | $1,855 | $2.65 | 1d | 12 | 0.68mi |
| 127 Langner Rd Buffalo, NY | 2.0 | 1.0 | 900 | $1,400 | $1.56 | 1d | 1 | 0.92mi |
| 40 Vincent Ave Unit 2 Buffalo, NY | 2.0 | 1.0 | 1075 | $875 | $0.81 | 23d | 1 | 0.95mi |
| 158 South Dr Buffalo, NY | 2.0 | 2.5 | 1380 | $2,500 | $1.81 | 1d | 1 | 1.23mi |
| 46 Kirkwood Dr Unit Lower West Seneca, NY | 2.0 | 1.0 | 1064 | $1,350 | $1.27 | 16d | 1 | 1.44mi |
Listing history 6 events
-
2026-06-18days on market $99,900 Active 5 DOM
-
2026-06-17days on market $99,900 Active 4 DOM
-
2026-06-16days on market $99,900 Active 3 DOM
-
2026-06-15days on market $99,900 Active 2 DOM
-
2026-06-13remarks 148-char remark
-
2026-06-13$99,900 Active 1 DOM
ⓘ Source: listings_history table (triggers on properties + properties_extension) + one-shot
backfill from property_details.listing_events for pre-trigger history.
Tax reassessment forecast NY · Partial reset (capped growth)
- Current annual tax
- $2,219 · $185/mo
- Projected year-2 tax
- $2,219 · $185/mo
- Expected delta
- $0/yr ($0/mo · 0.0%)
ⓘ Screening estimate from a state-policy table — verify with the county assessor before closing.
Climate risk First Street
- Flood 1/10 Low FEMA zone X (unshaded) · 0% chance over 30 yrs
- Wildfire 1/10 Low
- Heat 3/10 Moderate 7 d/yr ≥92°F today · 16 d/yr by 30 yrs out
- Wind 1/10 Low
- Air quality 4/10 Moderate 3 unhealthy d/yr today · 8 by 30 yrs out
Nearby sold comps map
Loading sold comps map…
Walkable amenities ~0.75 mi
Loading nearby amenities…
Taxation est. · year 1
- Rental income
- $18,431
- − Mortgage interest
- −$5,596
- − Property taxes
- −$2,219
- − Insurance
- −$500
- − Repairs & maintenance
- −$1,474
- − Management
- −$1,474
- − Depreciation
- −$2,906
- Taxable income
- $4,261
- Est. tax owed @ 24.0%
- −$1,023
- After-tax cash flow
- $4,532/yr
For passive investors: Depreciation is non-cash, so a rental often shows a tax loss while cash-flowing — sheltering income. Rental losses are passive: they offset passive income freely, and up to $25,000/yr can offset ordinary (W-2) income if you actively participate and your MAGI is under $100k (phasing out to $0 by $150k); unused losses carry forward. On sale, claimed depreciation is recaptured at up to 25%, and gains may owe capital-gains tax (a 1031 exchange can defer both). Figures are a year-1 estimate at your 24.0% rate — not tax advice; consult a CPA.
Schools (NCES district)
- District
- Lackawanna City School District
- NCES district ID
- 3616440
- Math proficiency
- 19% ▼ -10.00%
- Reading proficiency
- 29% ▲ 3.00%
- Median HH income
- $35,041
- Composite
- 19.76/100
- National rank
- #8708
- State rank
- #588 of 590 in NY
Livability — Lackawanna
- Score
- 75/100
- State rank
- #254
- US rank
- #4026
Category grades
Schools grade is shown separately in the Schools card above.
Census & demographics
- Census place
- Lackawanna, NY
- City population
- 20,661
- Population (ZIP)
- 20,661
Population outlook (Erie County) Hauer SSP2
- Today (2025)
- 933,037 people
- By 2030
- 935,181 · +0.2%
- By 2040
- 928,531 · -0.5%
- By 2050
- 905,725 · -2.9%
- By 2075
- 834,037 · -10.6%
- By 2100
- 708,033 · -24.1%
Race, ethnicity, and origin ACS 2023
- Neighborhood character
- Predominantly White (73%)
- Race & ethnicity
- White 73% Black 13% Hispanic / Latino 10% Two or more races 5%
- Hispanic origin (detail)
- Puerto Rican 8%
- Common ancestry
- Romanian 18% Lithuanian 2% Slovak 1%
- Foreign-born
- 7% · Canada
- Languages at home
- 80% English-only · Arabic 11% Spanish 6% Russian/Polish/Slavic 1%
Political lean MEDSL · Erie
- 2024 margin
- Lean D (+9.7) · D 54.8% · R 45.2%
- 2008→2024 swing
- -7.9pp toward R · 2008: 17.5pp · 2024: 9.7pp
- All cycles
- 2024: D+9.7 2020: D+14.7 2016: D+4.8 2012: D+15.6 2008: D+17.5
Not yet ingested
- Civics
- —
Market trends
- HPI YoY
- ▼ -39.44%
- Current HPI
- 389.0188
- Rent YoY
- —
- Metro
- —
- State GDP YoY
- ▲ 2.60%
- F500 in state
- 92
Industry mix (Fortune 500 HQ in NY)
| Industry | F500 HQs | Revenue |
|---|---|---|
| Financial Services | 10 | $950B |
|
||
| Consumer Goods | 9 | $162B |
|
||
| Insurance | 4 | $225B |
|
||
| Telecommunications | 2 | $144B |
|
||
| Pharmaceuticals | 2 | $112B |
|
||
| Media / Entertainment | 2 | $69B |
|
||
Price history
+99.8% since first listed2 events — show timeline
- 2026-06-13 Listed $99,900 WNYREIS
- 2017-09-07 Sold (Public Records) $50,000 Public Records
Property tax history
+8.5%/yrLatest (2025): $2,219 · -0.1% YoY. Source: county tax records.
Cash-flow waterfall
monthlySold comps — $/sqft
last 12 mo · ≤1 miLoading sold comps…