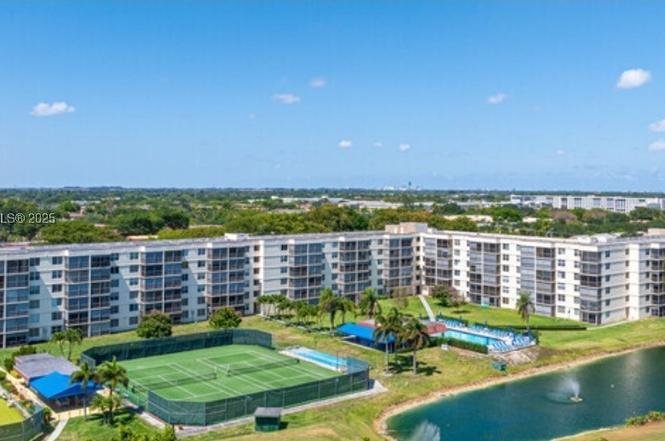
 🌊 Lakefront
691 S Hollybrook Dr #104 · Pembroke Pines, FL
Flood risk 1/10 · Minimal
- FEMA flood zone
- X (shaded)
- Chance of flooding over 30 yrs
- 0.0%
- Est. flood insurance / yr
- $507 – $1,088
Fire risk 1/10 · Minimal
- Est. fire insurance / yr
- $947 – $1,759
Heat risk 9/10 · Severe
- Hot days now (above 105°F)
- 5 days/yr
- Hot days in 30 yrs
- 20 days/yr
Wind risk 10/10 · Severe
- Chance of severe wind over 30 yrs
- 99.0%
Air-quality risk 2/10 · Minimal
- Unhealthy air days now
- 2 days/yr
- Unhealthy air days in 30 yrs
- 2 days/yr
Risk factors via First Street. Map © Google.
Why this score? — see what drove the D grade
The composite is a weighted blend of 9 inputs, each scored 0–100. Each bar is that input's sub-score; the figure is the points it added to the 100-point composite (weight × sub-score).
- 1% rule +10.0/10.0
- Cash flow +8.8/30.0
- ARV discount +7.5/15.0
- Livability +4.2/5.0
- Schools +4.1/10.0
- Condition / age +2.5/5.0
- DSCR +2.4/10.0
- Rent growth +2.3/5.0
- Appreciation +0.0/10.0
$150,000
🖨 Deal sheet (PDF) 📄 Offer letter ✓ Due diligence
Listing remarks
Come and Enjoy Your Lakefront 1st Floor 2 Bedrooms 2 Bathrooms Condo Oasis in your 55+ Active Community of Hollybrook Golf & Tennis in Pembroke Pines, FL. Live vivaciously with all the Amenities you desire and so much more. Amenities include: FREE GOLF (excluding car fees); 2 Golf PGA; and 1 Par 3; Pickleball; Tennis Courts; Shuffleboard; BBQ Area; several Restaurants; Courtesy Bus; Heated Pool; Craft/Hobby Room; Library, designated Vehicle Wash Area; and so much more. Enjoy leisurely strolls throughout the Gated Community and designated Walk/Bike/Jog Paths. Have Fun in the Community and travel freely with close to I-75, I-595, the Turnpike, and beautiful Broward County. Fun in the Su
Key facts
- $707 HOA
- Parking
- Community pool
Property features AI
Finance
- Financial info: Pets allowed with restrictions (maximum 20 lbs)
- HOA & community: Quarterly association fee; Association covers common areas, cable TV, golf, hot water, insurance, internet, grounds maintenance, structure maintenance, parking, security and water; Community amenities include billiard room, fitness center, hobby room, library, barbecue/picnic area, pickleball, pool, shuffleboard court, sauna, spa/hot tub, tennis courts, transportation service and elevators; Located in a senior community
Exterior
- Parking: Assigned parking; Guest parking available; One assigned space
- Security: Gated/complex fenced
- Utilities: Cable available
- Home design: Attached property; Single-story unit (entry level 1); Total of 3 stories in the building; Block construction
- Construction: Block construction
- Exterior features: Enclosed porch; Porch with screened area; Complex is fenced; Lakefront property; Has a view
Interior
- Kitchen: Dishwasher; Electric range; Microwave; Refrigerator; Electric water heater
- Bedrooms: Primary bedroom located on the main/entry level
- Flooring: Ceramic tile
- Bathrooms: 2 full bathrooms
- Heating & cooling: Central air conditioning; Ceiling fans; Electric heating
- Interior features: Blinds on windows; Furnishing negotiable; Bedroom on main level; Family/dining room; First-floor entry; Main level primary bedroom; Main living area on entry level; Split bedroom layout
- Laundry & utility: Electric water heater
Neighborhood map
What this means for you Summary
Snapshot
- This is a 2-bed/2.0-bath condo listed at $150k.
Deal economics
- At list price, monthly cash flow is $-123 ($-1k/yr) — negative.
- To cash-flow at today's rent, offer at most $128k (14.5% below list).
- Meets the 1% rule at list price ($2k rent vs $150k).
- Recommended offer: $128k (14.5% below list) — sets the bar for cash-flow.
- Cap rate 5.3% vs local median 4.0% in Pembroke Pines — top-decile yield for the area; either an underpriced asset or a hidden risk that comps aren't pricing in. Stress-test before assuming the spread holds.
Location & tenants
- Location reads 83/100 on livability (#54 in FL, #933 nationally) — a professional / high-income tenant draw. Strengths: housing A+, health & safety A+, crime A-; Watch: amenities D+, cost of living D+.
- Broward (suburban): math 42% / reading 53% proficiency, ranked #46 of 73 in FL (top 63%) — families likely to look elsewhere, expect single-tenant / working-renter base with shorter leases.
- Zoned schools: Nova Blanche Forman Elementary (math 35% / reading 55%, grade D-, #1,271 of 2,144 statewide, top 60%, 769 students, 72% FRL); Nova Middle School (math 44% / reading 53%, grade C-, #274 of 571 statewide, top 50%, 1,284 students, 68% FRL); Charles W Flanagan High School (math 29% / reading 50%, grade F, #304 of 667 statewide, top 47%, 2,475 students, 57% FRL).
- Market conditions: Rents soft (-0.9%/yr); 446 active listings in the ZIP; 40 comparable units currently listed for rent nearby; rentals at typical pace (median 26d on market — plan ~3-4 weeks tenant-placement turnaround); 2,111 units permitted in Broward County in 2024 (1,265 in 5+ unit buildings).
- This rent runs 39% of the median local income ($69k/yr) — at the standard rent-burdened threshold; future hikes will face affordability resistance.
Forward outlook
- Local home prices are declining (-3.0%/yr); year-one equity from $1k of loan paydown is wiped out by about $4k of value loss. Plan a longer hold.
- Broward County population projected at +34% by 2050 — long-run rental-demand tailwind backs the buy-and-hold thesis.
Negotiation context
- It's been on market 389 days — a 12% lower offer ($132k) is reasonable based on typical stale-listing flexibility.
- 3 sale attempts since 2y ago with the ask held roughly flat each time — persistent listings suggest the price (not the market) is what's stuck; bring a comps-based counter.
Risks & watch-outs
- Watch-outs: property tax is 2.7% of price; HOA is 32% of rent.
- Climate carrying-cost: severe wind risk, 99% chance of damaging wind over 30y; extreme-heat days projected 5→20/yr by 2055 (HVAC capex compounding) — expect insurance premiums to compound above CPI over the hold.
Questions for the listing agent
- What do current leases actually rent for vs. the listed asking? Can we see a recent rent roll and the last 12 months of T-12 income?
- It's been on market 389 days. Have you received any prior offers? Is the seller open to a 15% concession, seller financing, or rate buy-down credit?
- Built in 1974 — when were the roof, HVAC, electrical panel, plumbing, and water heater last replaced?
- Property tax is high relative to price — has the assessment been appealed recently, and will the sale trigger a re-assessment?
- What does the HOA fee cover, when was the last increase, and are there any pending special assessments or reserve-fund shortfalls?
- Any open or pending special assessments — roof, HVAC, plumbing, elevator, façade? What's the per-unit balance and payoff schedule, and is the seller paying it off at close or rolling it to the buyer?
- Why hasn't it sold? Are there any deal-killer items the seller is aware of (foundation, flood, title, zoning, code violations)?
- Is there a deadline driving the sale (1031 exchange, divorce, estate, relocation)? That informs how much negotiation room exists.
- Schools are A-rated — typically a magnet for longer-tenancy family renters. What's the average tenant stay here, and is there a school-zone premium baked into asking?
- The area grade is low — what's the realistic commute time and amenity access for the typical tenant pool here? Any planned neighborhood developments (good or bad) we should know about?
- This sits on a lake — are riparian / water-frontage rights deeded with the parcel? Any dock permits, shoreline easements, or HOA water-use restrictions?
- What's the documented flood / surge / shoreline-erosion history here (FEMA AND non-FEMA — e.g., storm surge, creek backup, septic-field saturation)?
- Any water-quality or seasonal algae-bloom issues that affect tenant satisfaction or short-term-rental demand?
- What's the average days-on-market for RENTAL listings here right now (not sales)? A rising rental-DOM trend means longer vacancies and softer asking-rent achievability than the comps imply.
- What's the recent tenant-quality profile in this submarket — average credit score on applications, eviction rate, late-payment / NSF rate, and stable-employment percentage? A property-management company in the area should have these aggregated.
Investment metrics
- 1% rule
- 1.50% ✓
- Cap rate
- 5.31%
- Cash-on-cash
- -3.52%
- DSCR
- 0.84
- GRM
- 5.6
CMA / ARV
No comps found within radius.
Projected returns pro-forma
-3.0% appreciation · 0.0% rent growth · sell at horizon
- IRR
- -28.5%
- Equity multiple
- 0.09×
- Total profit
- $-38,168
- Equity at exit
- $22,365
- IRR
- -73.4%
- Equity multiple
- -0.58×
- Total profit
- $-66,474
- Equity at exit
- $12,969
Cash invested: $42,000 (down + closing). Projections, not guarantees.
Landlord ↔ Tenant lean methodology
- Overall (STATE)
- 87 Strongly Landlord-Friendly
- State Florida
- 87 Strongly Landlord-Friendly · R+3
- County
- — inherits STATE
- City
- — inherits STATE
ZIP-level market 33025
- Rents YoY
- -0.9%
- Active inventory
- 446
- Price-to-rent
- 5.6×
Monthly cashflow live
- Estimated rent
- $2,244 high interval (Pro) →
- Mortgage (P&I)
- −$787
- Tax from tax record
- −$340 /mo · $4,080/yr
- Insurance
- −$62
- HOA
- −$707
- Vacancy / Maint / Mgmt
- −$471
- Net cashflow
- $-123
Break-even live
Sensitivity live
| Price | -10% $-38 | -5% $-81 | +0% $-123 | +5% $-166 | +10% $-208 |
|---|---|---|---|---|---|
| Rent | -10% $-300 | -5% $-212 | +0% $-123 | +5% $-35 | +10% $54 |
| Rate | -1.0pp $-48 | -0.5pp $-85 | base $-123 | +0.5pp $-162 | +1.0pp $-202 |
UW: 25.0% down · 7.5% · 30yr · 1.5% tax · 5.0% vac · 8.0% maint · 8.0% mgmt
Financing live
Cash to close
- Down payment
- $37,500
- Closing costs
- $4,500
- Reserves months
- —
- Total cash needed
- —
Loan-product check · same deal, 3 products live
Conventional
25% down · 7.5% · 30yr
- Down + closing
- —
- Monthly P&I
- —
- Monthly cashflow
- —
- DSCR
- —
- Eligible?
- —
Personal DTI + credit; lowest rate.
DSCR
20% down · 8.5% · 30yr
- Down + closing
- —
- Monthly P&I
- —
- Monthly cashflow
- —
- DSCR
- —
- Eligible?
- —
No personal income docs; deal must DSCR.
Hard money
10% down · 12.0% · 12mo
- Down + closing
- —
- Monthly P&I
- —
- Monthly cashflow
- —
- DSCR
- —
- Eligible?
- —
Short-term bridge; refi at stabilization.
Rent comps 40 comps
| Address | Beds | Baths | Sqft | Rent | $/sqft | DOM | Units | Dist |
|---|---|---|---|---|---|---|---|---|
| 681 S Hollybrook Dr #305 Pembroke Pines, FL | 2.0 | 2.0 | 1050 | $1,995 | $1.90 | 26d | 1 | 0.05mi |
| 811 S Hollybrook Dr #208 Pembroke Pines, FL | 2.0 | 2.0 | 1170 | $2,500 | $2.14 | 26d | 1 | 0.07mi |
| 671 S Hollybrook Dr #209 Pembroke Pines, FL | 2.0 | 2.0 | 1170 | $1,900 | $1.62 | 26d | 1 | 0.07mi |
| 8960 S Hollybrook Blvd #301 Pembroke Pines, FL | 2.0 | 2.0 | 1170 | $2,800 | $2.39 | 6d | 1 | 0.08mi |
| 8990 S Hollybrook Blvd Pembroke Pines, FL | 1.0–2.0 | 1.5–2.0 | 1035 | $2,000 | $1.93 | 6d | 2 | 0.11mi |
| 820 S Hollybrook Dr #209 Pembroke Pines, FL | 2.0 | 2.0 | 1170 | $2,900 | $2.48 | 26d | 1 | 0.14mi |
| 8940 S Hollybrook Blvd Pembroke Pines, FL | 2.0 | 2.0 | 1170 | $1,725 | $1.47 | 23d | 2 | 0.16mi |
| 8941 S Hollybrook Blvd #203 Pembroke Pines, FL | 2.0 | 2.0 | 1170 | $2,200 | $1.88 | 9d | 1 | 0.17mi |
| 8941 S Hollybrook Blvd #203 Pembroke Pines, FL | 2.0 | 2.0 | 1170 | $2,200 | $1.88 | 26d | 1 | 0.17mi |
| 381 S Hollybrook Dr #106 Pembroke Pines, FL | 1.0 | 1.5 | 900 | $1,700 | $1.89 | 26d | 1 | 0.17mi |
| 830 S Hollybrook Dr #204 Pembroke Pines, FL | 2.0 | 2.0 | 1170 | $1,700 | $1.45 | 7d | 1 | 0.19mi |
| 830 S Hollybrook Dr #204 Pembroke Pines, FL | 2.0 | 2.0 | 1170 | $1,700 | $1.45 | 26d | 1 | 0.19mi |
| 8900 Washington Blvd #410 Pembroke Pines, FL | 1.0 | 1.5 | 800 | $3,100 | $3.88 | 26d | 1 | 0.20mi |
| 8900 Washington Blvd #410 Pembroke Pines, FL | 1.0 | 1.5 | 800 | $3,100 | $3.88 | 3d | 1 | 0.20mi |
| 400 S Hollybrook Dr #202 Pembroke Pines, FL | 2.0 | 2.0 | 1170 | $1,900 | $1.62 | 26d | 1 | 0.22mi |
| 320 Palm Cir E #320 Pembroke Pines, FL | 2.0 | 2.5 | 1113 | $2,500 | $2.25 | 26d | 1 | 0.25mi |
| 306 Palm Cir E Pembroke Pines, FL | 2.0 | 2.0 | 1016 | $2,250 | $2.21 | 5d | 1 | 0.27mi |
| 351 Palm Way Pembroke Pines, FL | 1.0–2.0 | 1.0–2.0 | 787 | $2,095 | $2.66 | 7d | 2 | 0.29mi |
| 9475 Palm Cir N Unit 9475 Pembroke Pines, FL | 2.0 | 2.5 | 1113 | $2,300 | $2.07 | 5d | 1 | 0.30mi |
| 9475 Palm Cir N Unit 9475 Pembroke Pines, FL | 2.0 | 2.5 | 1113 | $2,400 | $2.16 | 26d | 1 | 0.30mi |
| 9800 N Hollybrook Lake Dr Unit 9-303 Pembroke Pines, FL | 2.0 | 2.0 | 1170 | $1,700 | $1.45 | 26d | 1 | 0.31mi |
| 8886 SW 3rd St #204 Pembroke Pines, FL | 2.0 | 2.0 | 985 | $2,200 | $2.23 | 5d | 1 | 0.33mi |
| 8886 SW 3rd St #204 Pembroke Pines, FL | 2.0 | 2.0 | 985 | $2,200 | $2.23 | 23d | 1 | 0.33mi |
| 301 Palm Cir W Unit 301 Pembroke Pines, FL | 2.0 | 2.0 | 1016 | $2,100 | $2.07 | 0d | 1 | 0.34mi |
| 306 Palm Cir W Unit 306 Pembroke Pines, FL | 2.0 | 2.0 | 1016 | $2,350 | $2.31 | 26d | 1 | 0.34mi |
| 251 Palm Cir W #206 Pembroke Pines, FL | 2.0 | 2.0 | 1016 | $2,300 | $2.26 | 26d | 1 | 0.34mi |
| 300 Palm Cir W Unit 305 Pembroke Pines, FL | 1.0 | 1.0 | 739 | $1,700 | $2.30 | 13d | 1 | 0.35mi |
| 203 Palm Cir W Unit 203 Pembroke Pines, FL | 2.0 | 2.0 | 1016 | $2,200 | $2.17 | 14d | 1 | 0.36mi |
| 107 Palm Cir W Unit 107 Pembroke Pines, FL | 2.0 | 1.0 | 881 | $2,100 | $2.38 | 26d | 1 | 0.38mi |
| 250 Palm Cir W #204 Pembroke Pines, FL | 1.0 | 1.0 | 739 | $1,700 | $2.30 | 26d | 1 | 0.38mi |
| 8657 SW 5th St Pembroke Pines, FL | 2.0 | 1.0–2.0 | 877 | $2,125 | $2.42 | 23d | 2 | 0.40mi |
| 8710 SW 3rd St #201 Pembroke Pines, FL | 1.0 | 2.0 | 805 | $1,800 | $2.24 | 26d | 1 | 0.40mi |
| 8657 SW 5th St #205 Pembroke Pines, FL | 2.0 | 2.0 | 985 | $2,350 | $2.39 | 20d | 1 | 0.40mi |
| 417 Palm Cir #417 Pembroke Pines, FL | 2.0 | 2.5 | 1113 | $2,275 | $2.04 | 7d | 1 | 0.41mi |
| 9423 S Hollybrook Lake Dr #203 Pembroke Pines, FL | 2.0 | 2.0 | 1170 | $2,000 | $1.71 | 26d | 1 | 0.45mi |
| 101 NW 93rd Ave #106 Pembroke Pines, FL | 2.0 | 2.0 | 787 | $2,200 | $2.80 | 19d | 1 | 0.46mi |
| 9220 NW 1st St #101 Pembroke Pines, FL | 2.0 | 2.0 | 787 | $2,300 | $2.92 | 0d | 1 | 0.47mi |
| 9117 NW 1st Ct #105 Pembroke Pines, FL | 2.0 | 2.0 | 787 | $1,990 | $2.53 | 16d | 1 | 0.47mi |
| 142 NW 91st Ave #104 Pembroke Pines, FL | 2.0 | 2.0 | 787 | $2,050 | $2.60 | 26d | 1 | 0.47mi |
| 9220 S Hollybrook Lake Dr #208 Pembroke Pines, FL | 2.0 | 2.0 | 1170 | $1,900 | $1.62 | 26d | 1 | 0.47mi |
HOA detail condo
- Monthly dues
- $707 · $8,484/yr
- Likely covers
- poolsecurity
- Assessments
- None detected in remarks — confirm with the listing agent.
Listing history 20 events
-
2026-06-21days on market $150,000 Active 389 DOM
-
2026-06-18days on market $150,000 Active 386 DOM
-
2026-06-17days on market $150,000 Active 385 DOM
-
2026-06-16days on market $150,000 Active 384 DOM
-
2026-06-15days on market $150,000 Active 383 DOM
-
2026-06-13days on market $150,000 Active 381 DOM
-
2026-06-09days on market $150,000 Active 377 DOM
-
2026-06-07days on market $150,000 Active 375 DOM
-
2026-06-04days on market $150,000 Active 372 DOM
-
2026-06-03days on market $150,000 Active 371 DOM
-
2026-06-02days on market $150,000 Active 370 DOM
-
2026-06-01days on market $150,000 Active 369 DOM
-
2026-05-31days on market $150,000 Active 368 DOM
-
2025-05-31status Active
-
2025-04-27$150,000 Active
-
2025-04-09historical $150,000
-
2025-01-13historical
-
2025-01-09price $149,900
-
2024-05-01price $190,000
-
2024-04-03$209,000 Active
ⓘ Source: listings_history table (triggers on properties + properties_extension) + one-shot
backfill from property_details.listing_events for pre-trigger history.
Tax reassessment forecast FL · Resets to sale price
- Current annual tax
- $4,080 · $340/mo
- Projected year-2 tax
- $4,080 · $340/mo
- Expected delta
- $0/yr ($0/mo · 0.0%)
ⓘ Screening estimate from a state-policy table — verify with the county assessor before closing.
Climate risk First Street
- Flood 1/10 Low FEMA zone X (shaded) · 0% chance over 30 yrs
- Wildfire 1/10 Low
- Heat 9/10 Extreme 5 d/yr ≥105°F today · 20 d/yr by 30 yrs out
- Wind 10/10 Extreme 99% chance of damaging wind over 30 yrs
- Air quality 2/10 Low 2 unhealthy d/yr today · 2 by 30 yrs out
Nearby sold comps map
Loading sold comps map…
Walkable amenities ~0.75 mi
Loading nearby amenities…
Taxation est. · year 1
- Rental income
- $26,930
- − Mortgage interest
- −$8,402
- − Property taxes
- −$4,080
- − Insurance
- −$750
- − Repairs & maintenance
- −$2,154
- − Management
- −$2,154
- − HOA
- −$8,484
- − Depreciation
- −$4,364
- Taxable loss
- −$3,459
- Est. tax savings @ 24.0%
- +$830
- After-tax cash flow
- $-648/yr
For passive investors: Depreciation is non-cash, so a rental often shows a tax loss while cash-flowing — sheltering income. Rental losses are passive: they offset passive income freely, and up to $25,000/yr can offset ordinary (W-2) income if you actively participate and your MAGI is under $100k (phasing out to $0 by $150k); unused losses carry forward. On sale, claimed depreciation is recaptured at up to 25%, and gains may owe capital-gains tax (a 1031 exchange can defer both). Figures are a year-1 estimate at your 24.0% rate — not tax advice; consult a CPA.
Schools (NCES district)
- District
- Broward
- NCES district ID
- 1200180
- Math proficiency
- 42% ▼ -18.00%
- Reading proficiency
- 53% ▼ -5.00%
- Median HH income
- $52,139
- Composite
- 40.88/100
- National rank
- #3621
- State rank
- #46 of 73 in FL
Livability — Pembroke Pines
- Score
- 83/100
- State rank
- #54
- US rank
- #933
Category grades
Schools grade is shown separately in the Schools card above.
Census & demographics
- Census place
- Pembroke Pines, FL
- County
- Broward County · 1,963,430 people
- City population
- 180,224
- Metro
- Miami-Fort Lauderdale-Pompano Beach, FL
- Population (ZIP)
- 76,967
- Household income
- $68,743
- Rent vs Own
- Severe rent burden
- 4834.0
Population outlook (Broward County) Hauer SSP2
- Today (2025)
- 2,207,033 people
- By 2030
- 2,360,704 · +7.0%
- By 2040
- 2,661,208 · +20.6%
- By 2050
- 2,946,698 · +33.5%
- By 2075
- 3,602,273 · +63.2%
- By 2100
- 3,970,984 · +79.9%
Race, ethnicity, and origin ACS 2023
- Neighborhood character
- Diverse neighborhood (Simpson 0.64)
- Race & ethnicity
- Black 44% Hispanic / Latino 39% Two or more races 18% White 11% Asian 3%
- Hispanic origin (detail)
- Puerto Rican 4% Cuban 11% Dominican 3% Salvadoran 1%
- Common ancestry
- Hispanic 8% Italian 1%
- Foreign-born
- 38% · Canada, Jamaica, Dominican Republic
- Languages at home
- 54% English-only · Spanish 35% French/Haitian/Cajun 7% Other Indo-European 1%
Political lean MEDSL · Broward
- 2024 margin
- D (+17.0) · D 58.0% · R 41.0%
- 2008→2024 swing
- -17.8pp toward R · 2008: 34.7pp · 2024: 17.0pp
- All cycles
- 2024: D+17.0 2020: D+29.8 2016: D+35.0 2012: D+34.9 2008: D+34.7
Not yet ingested
- Civics
- —
Market trends
- HPI YoY
- ▼ -246.93%
- Current HPI
- 416.2123
- Rent YoY
- ▼ -0.92%
- Metro
- Miami-Fort Lauderdale-Pompano Beach, FL
- State GDP YoY
- ▲ 3.28%
- F500 in state
- 36
Industry mix (Fortune 500 HQ in FL)
| Industry | F500 HQs | Revenue |
|---|---|---|
| Industrial Technology | 2 | $29B |
|
||
| Insurance | 2 | $17B |
|
||
| Retail | 1 | $60B |
|
||
| Technology Distribution | 1 | $58B |
|
||
| Homebuilding | 1 | $35B |
|
||
| Technology Manufacturing | 1 | $35B |
|
||
Price history
-28.2% since first listed7 events — show timeline
- 2025-05-31 Relisted — MARMLS
- 2025-04-27 Listed $150,000 MARMLS
- 2025-04-09 Coming Soon $150,000 MARMLS
- 2025-01-13 Listing Removed — MARMLS
- 2025-01-09 Price Changed $149,900 MARMLS
- 2024-05-01 Price Changed $190,000 MARMLS
- 2024-04-03 Listed $209,000 MARMLS
Property tax history
+7.7%/yrLatest (2025): $4,080 · +2.7% YoY. Source: county tax records.
Cash-flow waterfall
monthlySold comps — $/sqft
last 12 mo · ≤1 miLoading sold comps…