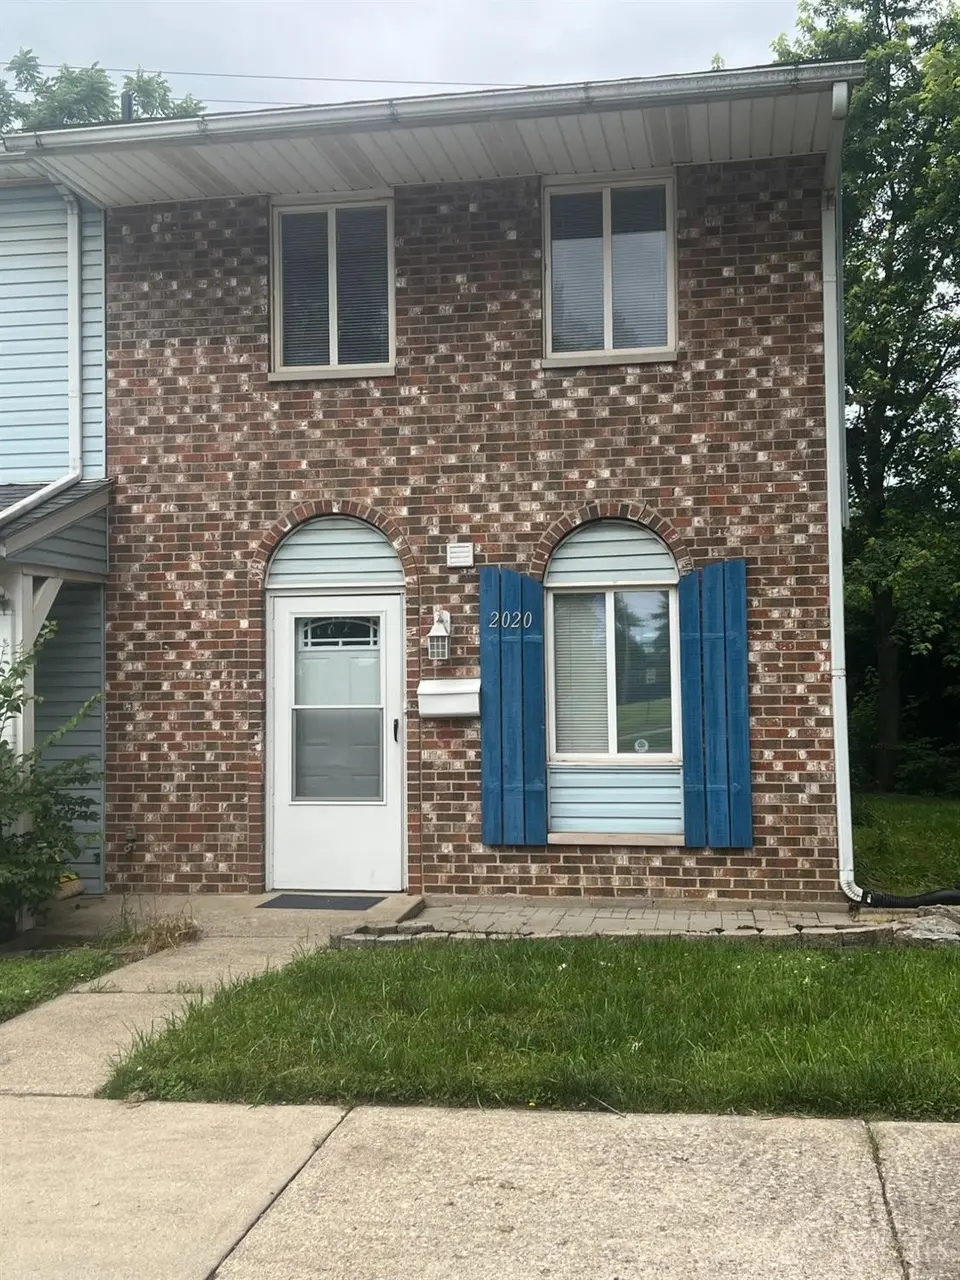
2020 S Breiel Blvd · Middletown, OH
Flood risk 1/10 · Minimal
- FEMA flood zone
- X (unshaded)
- Chance of flooding over 30 yrs
- 0.0%
- Est. flood insurance / yr
- $507 – $1,088
Fire risk 1/10 · Minimal
- Est. fire insurance / yr
- $713 – $1,323
Heat risk 4/10 · Minor
- Hot days now (above 103°F)
- 7 days/yr
- Hot days in 30 yrs
- 19 days/yr
Wind risk 2/10 · Minimal
- Chance of severe wind over 30 yrs
- 1.0%
Air-quality risk 3/10 · Minor
- Unhealthy air days now
- 2 days/yr
- Unhealthy air days in 30 yrs
- 3 days/yr
Risk factors via First Street. Map © Google.
Why this score? — see what drove the C- grade
The composite is a weighted blend of 9 inputs, each scored 0–100. Each bar is that input's sub-score; the figure is the points it added to the 100-point composite (weight × sub-score).
- Cash flow +21.5/30.0
- ARV discount +7.5/15.0
- DSCR +6.9/10.0
- 1% rule +5.2/10.0
- Rent growth +4.1/5.0
- Livability +3.6/5.0
- Condition / age +2.5/5.0
- Schools +2.0/10.0
- Appreciation +0.0/10.0
$119,000
🖨 Deal sheet 📄 Offer letter ✓ Due diligence
Listing remarks MLS
Move in and Relax in this updated Condo with 2 beds and 1 full bath, appliances remain, private patio, and storage shed
Key facts
- Private patio
- Storage shed
- Built 1973
Tags
Property features AI
Finance
- Other: Lease not considered
- HOA & community: No HOA
Exterior
- Parking: 2 assigned parking spaces
- Utilities: Public water; Public sewer; Natural gas
- Home design: Traditional townhouse; Two levels; Unit entry at level 1
- Construction: Brick and vinyl siding exterior; Shingle roof; Poured foundation; Built with residential zoning
- Exterior features: Patio; Aluminum windows; Busline nearby
Interior
- Kitchen: Dishwasher; Oven/Range; Refrigerator; Breakfast room about 9 x 10 on level 1; Dining room about 12 x 10 on level 1
- Bedrooms: 2 bedrooms; Primary bedroom about 11 x 16 on level 2; Second bedroom about 12 x 11 on level 2
- Bathrooms: 1 full bathroom (on level 2); 1 half bathroom (on level 1)
- Heating & cooling: Forced air heating (gas); Central air conditioning; Gas water heating
- Interior features: 6 total rooms; Smoke alarm
Neighborhood map
What this means for you Summary
Snapshot
- This is a 2-bed/1.5-bath condo listed at $119k.
Deal economics
- At list price, monthly cash flow is $179 ($2k/yr) — positive.
- The deal already cash-flows at list — no discount required.
- Meets the 1% rule at list price ($1k rent vs $119k).
- Recommended offer: $117k (1.5% below list) — sets the bar for market timing.
- Cap rate 8.1% vs local median 4.5% in Middletown — top-decile yield for the area; either an underpriced asset or a hidden risk that comps aren't pricing in. Stress-test before assuming the spread holds.
Location & tenants
- Location reads 72/100 on livability (#389 in OH) — a middle-class / working-renter tenant base. Strengths: cost of living A+, housing A+, health & safety A+; Watch: schools D+, crime D+, amenities D+.
- Middletown City (suburban): math 21% / reading 28% proficiency, ranked #610 of 656 in OH (top 93%) — low school quality limits family demand, transient renter base, plan for 1-2y turnover; 69% free/reduced lunch — lower-income household profile, screen leases tightly.
- Market conditions: Rents rising fast (+6.3%/yr); 203 active listings in the ZIP; 22 comparable units currently listed for rent nearby; rentals at typical pace (median 15d on market — plan ~3-4 weeks tenant-placement turnaround); 1,163 units permitted in Butler County in 2024 (356 in 5+ unit buildings).
Forward outlook
- Local home prices are declining (-3.0%/yr); year-one equity from $823 of loan paydown is wiped out by about $4k of value loss. Plan a longer hold.
- At projected returns (-3.0% appreciation + 6.3% rent growth), your $33k cash investment doubles in ~10 years — after that, you're playing with house money.
Negotiation context
- It's been on market 17 days — a 2% lower offer ($117k) is reasonable based on typical stale-listing flexibility.
- 4 sale attempts since 14y ago with the ask held roughly flat each time — persistent listings suggest the price (not the market) is what's stuck; bring a comps-based counter.
- Current owner paid $55k; list at $119k implies a 116% gain — meaningful room to come down on a strong offer.
Questions for the listing agent
- Built in 1973 — when were the roof, HVAC, electrical panel, plumbing, and water heater last replaced?
- Any open or pending special assessments — roof, HVAC, plumbing, elevator, façade? What's the per-unit balance and payoff schedule, and is the seller paying it off at close or rolling it to the buyer?
- Is there a deadline driving the sale (1031 exchange, divorce, estate, relocation)? That informs how much negotiation room exists.
- Schools are D-rated, which usually means shorter tenancies and higher turnover. Who's the typical renter profile here, and what's been the actual vacancy rate?
- Crime grade is D in this area — have there been break-ins, vandalism, or insurance claims at this property in the last 3 years? What carrier currently insures it and at what premium?
- What's the average days-on-market for RENTAL listings here right now (not sales)? A rising rental-DOM trend means longer vacancies and softer asking-rent achievability than the comps imply.
- What's the recent tenant-quality profile in this submarket — average credit score on applications, eviction rate, late-payment / NSF rate, and stable-employment percentage? A property-management company in the area should have these aggregated.
- How much new apartment / multifamily construction is in the pipeline within 1–3 miles? Heavy new supply (>2% of stock underway) typically softens rents 12–24 months out; light construction supports rent growth.
Investment metrics
- 1% rule
- 1.02% ✓
- Cap rate
- 8.10%
- Cash-on-cash
- 6.46%
- DSCR
- 1.29
- GRM
- 8.2
CMA / ARV
No comps found within radius.
Projected returns pro-forma
-3.0% appreciation · 6.31% rent growth · sell at horizon
- IRR
- -2.9%
- Equity multiple
- 0.89×
- Total profit
- $-3,718
- Equity at exit
- $17,743
- IRR
- 10.0%
- Equity multiple
- 1.89×
- Total profit
- $29,681
- Equity at exit
- $10,289
Cash invested: $33,320 (down + closing). Projections, not guarantees.
Landlord ↔ Tenant lean methodology
- Overall (STATE)
- 73 Landlord-Friendly
- State Ohio
- 73 Landlord-Friendly · R+6
- County
- — inherits STATE
- City
- — inherits STATE
ZIP-level market 45044
- Rents YoY
- 6.3%
- Active inventory
- 203
- Price-to-rent
- 8.2×
Monthly cashflow live
- Estimated rent
- $1,208 high interval (Pro) →
- Mortgage (P&I)
- −$624
- Tax from tax record
- −$101 /mo · $1,216/yr
- Insurance
- −$50
- HOA
- −$0
- Vacancy / Maint / Mgmt
- −$254
- Net cashflow
- $179
Break-even live
UW: 25.0% down · 7.5% · 30yr · 1.5% tax · 5.0% vac · 8.0% maint · 8.0% mgmt
Financing live
Cash to close
- Down payment
- $29,750
- Closing costs
- $3,570
- Reserves months
- —
- Total cash needed
- —
Loan-product check · same deal, 3 products live
Conventional
25% down · 7.5% · 30yr
- Down + closing
- —
- Monthly P&I
- —
- Monthly cashflow
- —
- DSCR
- —
- Eligible?
- —
Personal DTI + credit; lowest rate.
DSCR
20% down · 8.5% · 30yr
- Down + closing
- —
- Monthly P&I
- —
- Monthly cashflow
- —
- DSCR
- —
- Eligible?
- —
No personal income docs; deal must DSCR.
Hard money
10% down · 12.0% · 12mo
- Down + closing
- —
- Monthly P&I
- —
- Monthly cashflow
- —
- DSCR
- —
- Eligible?
- —
Short-term bridge; refi at stabilization.
Rent comps 22 comps
| Address | Beds | Baths | Sqft | Rent | $/sqft | DOM | Units | Dist |
|---|---|---|---|---|---|---|---|---|
| 1925 Aaron Dr Middletown, OH | 2.0–3.0 | 1.0 | 900 | $1,050 | $1.17 | 1d | 1 | 0.04mi |
| 1900 Aaron Dr Unit 1970-F Middletown, OH | 2.0 | 1.0 | 819 | $1,075 | $1.31 | 3d | 1 | 0.12mi |
| 1900 Aaron Dr Unit 1940-G Middletown, OH | 2.0 | 1.0 | 819 | $1,100 | $1.34 | 14d | 1 | 0.12mi |
| 1900 Aaron Dr Middletown, OH | 2.0 | 1.0 | 819 | $1,100 | $1.34 | 12d | 1 | 0.13mi |
| 1900 Aaron Dr Middletown, OH | 2.0 | 1.0 | 819 | $10,750 | $13.13 | 4d | 1 | 0.13mi |
| 1900 Aaron Dr Middletown, OH | 2.0 | 1.0 | 819 | $1,100 | $1.34 | 23d | 1 | 0.13mi |
| 1830 S Breiel Blvd Middletown, OH | 2.0 | 1.0 | 906 | $1,150 | $1.27 | 7d | 1 | 0.17mi |
| 1806 S Breiel Blvd Middletown, OH | 2.0 | 1.0 | 906 | $995 | $1.10 | 2d | 1 | 0.19mi |
| 4373 Bonita Dr Middletown, OH | 2.0–4.0 | 1.0–1.5 | 1078 | $1,149 | $1.07 | 1d | 3 | 0.27mi |
| 1600 Jackson Ln Middletown, OH | 2.0 | 1.0 | 750 | $1,050 | $1.40 | 14d | 1 | 0.82mi |
| 1408 Jackson Ln Unit 3 Middletown, OH | 2.0 | 1.0 | 900 | $925 | $1.03 | 23d | 1 | 0.85mi |
| 1408 Jackson Ln Unit 4 Middletown, OH | 2.0 | 1.0 | 900 | $875 | $0.97 | 43d | 1 | 0.85mi |
| 834 Jackson Ln Middletown, OH | 2.0 | 1.0 | 1000 | $1,075 | $1.07 | 43d | 1 | 0.96mi |
| 3122 Beatrice Dr Middletown, OH | 3.0 | 1.0 | 1198 | $1,550 | $1.29 | 43d | 1 | 1.05mi |
| 2689 Audubon Dr Middletown, OH | 2.0 | 1.5 | 930 | $1,240 | $1.33 | 1d | 14 | 1.16mi |
| 1804 Brentwood St Middletown, OH | 3.0 | 1.0 | 1044 | $1,430 | $1.37 | 23d | 1 | 1.21mi |
| 3106 Grand Ave Unit 2 Middletown, OH | 2.0 | 1.0 | 918 | $925 | $1.01 | 43d | 1 | 1.26mi |
| 3003 Grand Ave Middletown, OH | 2.0 | 1.0 | 928 | $1,050 | $1.13 | 10d | 1 | 1.36mi |
| 3003 Grand Ave Fl 1 Middletown, OH | 2.0 | 1.0 | 928 | $1,050 | $1.13 | 7d | 1 | 1.36mi |
| 496 Bavarian St Unit 454 Middletown, OH | 2.0 | 2.0 | 900 | $925 | $1.03 | 43d | 1 | 1.44mi |
| 496 Bavarian St Unit 374 Middletown, OH | 3.0 | 2.5 | 1160 | $1,500 | $1.29 | 43d | 1 | 1.44mi |
| 496 Bavarian St Unit 338 Middletown, OH | 3.0 | 2.5 | 1160 | $1,500 | $1.29 | 11d | 1 | 1.44mi |
HOA detail condo
- Monthly dues
- $0 · $0/yr
- Assessments
- None detected in remarks — confirm with the listing agent.
Listing history 11 events
-
2026-06-18days on market $119,000 Active 17 DOM
-
2026-06-17days on market $119,000 Active 16 DOM
-
2026-06-16days on market $119,000 Active 15 DOM
-
2026-06-15days on market $119,000 Active 14 DOM
-
2026-06-13days on market $119,000 Active 12 DOM
-
2026-06-09days on market $119,000 Active 8 DOM
-
2026-06-08days on market $119,000 Active 7 DOM
-
2026-06-07days on market $119,000 Active 6 DOM
-
2026-06-03days on market $119,000 Active 2 DOM
-
2026-06-02remarks 119-char remark
-
2026-06-02$119,000 Active 1 DOM
ⓘ Source: listings_history table (triggers on properties + properties_extension) + one-shot
backfill from property_details.listing_events for pre-trigger history.
Tax reassessment forecast OH · Partial reset (capped growth)
- Current annual tax
- $1,216 · $101/mo
- Projected year-2 tax
- $1,536 · $128/mo
- Expected delta
- +$320/yr (+$27/mo · 26.3%)
ⓘ Screening estimate from a state-policy table — verify with the county assessor before closing.
Climate risk First Street
- Flood 1/10 Low FEMA zone X (unshaded) · 0% chance over 30 yrs
- Wildfire 1/10 Low
- Heat 4/10 Moderate 7 d/yr ≥103°F today · 19 d/yr by 30 yrs out
- Wind 2/10 Low 100% chance of damaging wind over 30 yrs
- Air quality 3/10 Moderate 2 unhealthy d/yr today · 3 by 30 yrs out
Nearby sold comps map
Loading sold comps map…
Walkable amenities ~0.75 mi
Loading nearby amenities…
Taxation est. · year 1
- Rental income
- $14,495
- − Mortgage interest
- −$6,666
- − Property taxes
- −$1,216
- − Insurance
- −$595
- − Repairs & maintenance
- −$1,160
- − Management
- −$1,160
- − Depreciation
- −$3,462
- Taxable income
- $237
- Est. tax owed @ 24.0%
- −$57
- After-tax cash flow
- $2,095/yr
For passive investors: Depreciation is non-cash, so a rental often shows a tax loss while cash-flowing — sheltering income. Rental losses are passive: they offset passive income freely, and up to $25,000/yr can offset ordinary (W-2) income if you actively participate and your MAGI is under $100k (phasing out to $0 by $150k); unused losses carry forward. On sale, claimed depreciation is recaptured at up to 25%, and gains may owe capital-gains tax (a 1031 exchange can defer both). Figures are a year-1 estimate at your 24.0% rate — not tax advice; consult a CPA.
Schools (NCES district)
- District
- Middletown City
- NCES district ID
- 3904440
- Math proficiency
- 21% ▼ -17.00%
- Reading proficiency
- 28% ▼ -15.00%
- Median HH income
- $36,650
- Composite
- 20.35/100
- National rank
- #8605
- State rank
- #610 of 656 in OH
Livability — Middletown
- Score
- 72/100
- State rank
- #389
- US rank
- #6338
Category grades
Schools grade is shown separately in the Schools card above.
Census & demographics
- Census place
- Middletown, OH
- County
- Butler County · 381,674 people
- City population
- 96,117
- Metro
- Cincinnati, OH-KY-IN
- Population (ZIP)
- 56,217
- Household income
- $73,732
- Rent vs Own
- Severe rent burden
- 1532.0
Population outlook (Butler County) Hauer SSP2
- Today (2025)
- 387,706 people
- By 2030
- 392,028 · +1.1%
- By 2040
- 395,307 · +2.0%
- By 2050
- 391,116 · +0.9%
- By 2075
- 378,642 · -2.3%
- By 2100
- 343,248 · -11.5%
Race, ethnicity, and origin ACS 2023
- Neighborhood character
- Predominantly White (72%)
- Race & ethnicity
- White 72% Black 12% Two or more races 8% Hispanic / Latino 7% Asian 2%
- Hispanic origin (detail)
- Mexican 2% Dominican 1%
- Common ancestry
- Slovak 2% Italian 2% Romanian 2%
- Foreign-born
- 6% · Canada
- Languages at home
- 92% English-only · Spanish 4% Other Indo-European 1% Tagalog/Filipino 1%
Political lean MEDSL · Butler
- 2024 margin
- Strong R (+26.3) · D 36.4% · R 62.7%
- 2008→2024 swing
- -3.6pp toward R · 2008: -22.6pp · 2024: -26.3pp
- All cycles
- 2024: R+26.3 2020: R+24.0 2016: R+28.3 2012: R+26.2 2008: R+22.6
Not yet ingested
- Civics
- —
Market trends
- HPI YoY
- ▼ -164.07%
- Current HPI
- 219.0479
- Rent YoY
- ▲ 6.31%
- Metro
- Cincinnati, OH-KY-IN
- State GDP YoY
- ▲ 1.98%
- F500 in state
- 48
Industry mix (Fortune 500 HQ in OH)
| Industry | F500 HQs | Revenue |
|---|---|---|
| Insurance | 3 | $145B |
|
||
| Industrial Machinery | 3 | $49B |
|
||
| Financial Services | 3 | $24B |
|
||
| Consumer Goods | 2 | $93B |
|
||
| Aerospace / Defense | 2 | $47B |
|
||
| Utilities | 2 | $33B |
|
||
Price history
+325.0% since first listed9 events — show timeline
- 2026-06-01 Listed $119,000 Dayton MLS
- 2026-06-01 Listed $119,000 Cincy MLS
- 2013-03-01 Listing Removed — Cincy MLS
- 2013-03-01 Listing Removed — Dayton MLS
- 2012-08-29 Listed $52,900 Cincy MLS
- 2012-08-29 Listed $52,900 Dayton MLS
- 2008-05-02 Sold (Public Records) $55,000 Public Records
- 1995-07-26 Sold (Public Records) $32,000 Public Records
- 1985-12-01 Sold (Public Records) $28,000 Public Records
Property tax history
+1.0%/yrLatest (2025): $1,216 · +1.3% YoY. Source: county tax records.
Cash-flow waterfall
monthlySold comps — $/sqft
last 12 mo · ≤1 miLoading sold comps…