 Duplex
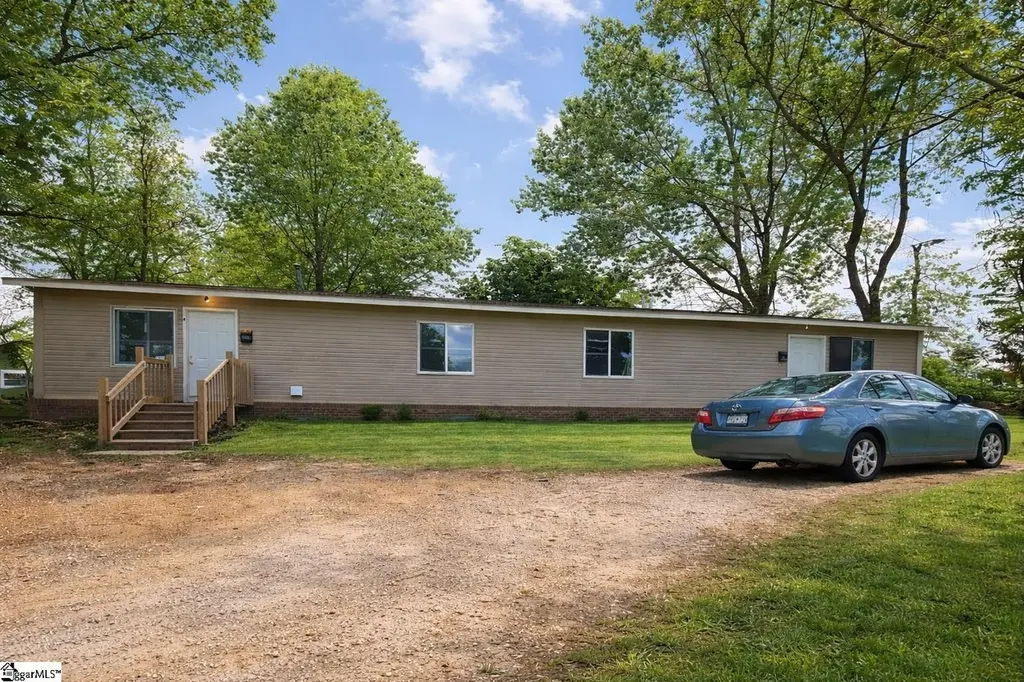
802 Kings Ct · Greenwood, SC
Flood risk 1/10 · Minimal
- FEMA flood zone
- X (unshaded)
- Chance of flooding over 30 yrs
- 0.0%
- Est. flood insurance / yr
- $507 – $1,088
Fire risk 3/10 · Minor
- Est. fire insurance / yr
- $783 – $1,453
Heat risk 6/10 · Moderate
- Hot days now (above 105°F)
- 7 days/yr
- Hot days in 30 yrs
- 17 days/yr
Wind risk 6/10 · Moderate
- Chance of severe wind over 30 yrs
- 27.0%
Air-quality risk 4/10 · Minor
- Unhealthy air days now
- 4 days/yr
- Unhealthy air days in 30 yrs
- 4 days/yr
Risk factors via First Street. Map © Google.
Why this score? — see what drove the B- grade
The composite is a weighted blend of 9 inputs, each scored 0–100. Each bar is that input's sub-score; the figure is the points it added to the 100-point composite (weight × sub-score).
- Cash flow +30.0/30.0
- DSCR +10.0/10.0
- 1% rule +9.9/10.0
- ARV discount +7.5/15.0
- Livability +3.2/5.0
- Schools +2.9/10.0
- Rent growth +2.5/5.0
- Condition / age +2.5/5.0
- Appreciation +0.0/10.0
$135,000
🖨 Deal sheet 📄 Offer letter ✓ Due diligence
Multi-family units
County records classify this as Multi-Family (2-4 Unit). Listing-text estimate: 2 units. confirmed
Listing remarks MLS
Turnkey duplex opportunity in Greenwood—perfect for investors or owner-occupants looking to offset their mortgage! This 2-unit property features a total of 1,820 sq ft, with each side offering 2 bedrooms and 1 full bath. The layout in both units feels open and surprisingly spacious for the square footage. One unit is already tenant-occupied, bringing in $800/month, while the second unit is vacant and ready to go—ideal for immediate rental income or for an owner to move in. The vacant side has been refreshed with brand new carpet in the bedrooms and durable luxury vinyl flooring throughout the main living areas, making it low-maintenance and attractive for tenants for years to come. With $1,600/month in potential gross rental income, this property offers strong cash flow. Located within city limits, it provides convenient access to everything Greenwood has to offer.
Key facts
- Vacant side
- Tenant occupied
- Convenient access
Tags
Property features AI
Finance
- Other: Lot approximately 0.22 acres
- Financial info: Property is a 2-unit multifamily building
- HOA & community: No community amenities
Exterior
- Parking: Off-street parking
- Security: No security features specified
- Utilities: Public water; Electric water heater; Public sewer; Public garbage pickup; Electric power (heating uses electricity)
- Home design: Single-story building; Built in 1982; Crawl space foundation
- Construction: Vinyl siding exterior; Architectural shingle roof; Crawl space foundation; Approximate year built: 1982
- Exterior features: Vinyl siding; Architectural roof
Interior
- Kitchen: No specific kitchen appliance details provided
- Bedrooms: Unit 1: 2 bedrooms (level 1); Unit 2: 2 bedrooms (level 1)
- Flooring: Unit 2: Carpet and laminate flooring; Unit 1: Flooring details not specified
- Bathrooms: Unit 1: 1 full bathroom; Unit 2: 1 full bathroom
- Heating & cooling: Electric heating; Cooling by wall/window units
- Interior features: Each unit includes a living/great room
- Laundry & utility: No laundry appliance details provided
Neighborhood map
What this means for you Summary
Snapshot
- This is a 2 × 2-bed/1.0-bath units multifamily listed at $135k.
Deal economics
- At list price, monthly cash flow is $650 ($8k/yr) — positive. Per door: $325/mo.
- The deal already cash-flows at list — no discount required.
- Meets the 1% rule at list price ($2k rent vs $135k).
- Recommended offer: $127k (6.0% below list) — sets the bar for market timing.
- Cap rate 12.1% vs local median 3.6% in Greenwood — top-decile yield for the area; either an underpriced asset or a hidden risk that comps aren't pricing in. Stress-test before assuming the spread holds.
Location & tenants
- Location reads 63/100 on livability (#167 in SC) — a middle-class / working-renter tenant base. Strengths: cost of living A+, health & safety A+, housing A; Watch: amenities D, crime F, commute F.
- Greenwood 50 (town): math 31% / reading 39% proficiency, ranked #43 of 80 in SC (top 54%) — families likely to look elsewhere, expect single-tenant / working-renter base with shorter leases.
- Zoned schools: Pinecrest Elementary (math 29% / reading 29%, grade F, #413 of 597 statewide, top 69%, 416 students, 100% FRL) — zoned schools average 100% FRL vs 59% district-wide (41 pts higher); higher-poverty schools than district average — tighter screening recommended.
- Market conditions: 168 active listings in the ZIP; 193 units permitted in Greenwood County in 2024 (0 in 5+ unit buildings).
Forward outlook
- Local home prices are declining (-3.0%/yr); year-one equity from $933 of loan paydown is wiped out by about $4k of value loss. Plan a longer hold.
- Greenwood County population projected to shrink 8% by 2050 — rents likely to lag national; underwrite the cash flow, not the appreciation.
- At projected returns (-3.0% appreciation + 3.0% rent growth), your $38k cash investment doubles in ~6 years — after that, you're playing with house money.
Negotiation context
- It's been on market 75 days — a 6% lower offer ($127k) is reasonable based on typical stale-listing flexibility.
- 2 sale attempts; this cycle's ask has dropped $25k (16%) from the opening price — seller is motivated, your offer sets the floor, not the list.
- Current owner paid $70k; list at $135k implies a 93% gain — meaningful room to come down on a strong offer.
Risks & watch-outs
- Climate carrying-cost: major wind risk, 27% chance of damaging wind over 30y; extreme-heat days projected 7→17/yr by 2055 (HVAC capex compounding) — expect insurance premiums to compound above CPI over the hold.
Questions for the listing agent
- It's been on market 75 days. Have you received any prior offers? Is the seller open to a 6% concession, seller financing, or rate buy-down credit?
- Can we see the unit-by-unit rent roll, current vacancy, and any below-market leases? What's the average tenancy length?
- What capital expenditures (roof, boiler, parking lot, exteriors) have been made in the last 5 years, and what's planned in the next 2?
- Why hasn't it sold? Are there any deal-killer items the seller is aware of (foundation, flood, title, zoning, code violations)?
- Is there a deadline driving the sale (1031 exchange, divorce, estate, relocation)? That informs how much negotiation room exists.
- Schools are F-rated, which usually means shorter tenancies and higher turnover. Who's the typical renter profile here, and what's been the actual vacancy rate?
- Crime grade is F in this area — have there been break-ins, vandalism, or insurance claims at this property in the last 3 years? What carrier currently insures it and at what premium?
- What's the average days-on-market for RENTAL listings here right now (not sales)? A rising rental-DOM trend means longer vacancies and softer asking-rent achievability than the comps imply.
- What's the recent tenant-quality profile in this submarket — average credit score on applications, eviction rate, late-payment / NSF rate, and stable-employment percentage? A property-management company in the area should have these aggregated.
- How much new apartment / multifamily construction is in the pipeline within 1–3 miles? Heavy new supply (>2% of stock underway) typically softens rents 12–24 months out; light construction supports rent growth.
Investment metrics
- 1% rule
- 1.49% ✓
- Cap rate
- 12.07%
- Cash-on-cash
- 20.62%
- DSCR
- 1.92
- GRM
- 5.6
CMA / ARV
No comps found within radius.
Projected returns pro-forma
-3.0% appreciation · 3.0% rent growth · sell at horizon
- IRR
- 13.0%
- Equity multiple
- 1.52×
- Total profit
- $19,534
- Equity at exit
- $20,129
- IRR
- 21.9%
- Equity multiple
- 2.86×
- Total profit
- $70,428
- Equity at exit
- $11,672
Cash invested: $37,800 (down + closing). Projections, not guarantees.
Landlord ↔ Tenant lean methodology
- Overall (STATE)
- 90 Strongly Landlord-Friendly
- State South Carolina
- 90 Strongly Landlord-Friendly · R+6
- County
- — inherits STATE
- City
- — inherits STATE
ZIP-level market 29646
- Active inventory
- 168
- Price-to-rent
- 11.2×
Monthly cashflow live
- Estimated rent
- $2,013 medium interval (Pro) →
- Mortgage (P&I)
- −$708
- Tax from tax record
- −$176 /mo · $2,117/yr
- Insurance
- −$56
- HOA
- −$0
- Vacancy / Maint / Mgmt
- −$423
- Net cashflow
- $650
Break-even live
2-unit breakdown (identical units grouped — click to expand)
| Units | Beds | Baths | Est. rent |
|---|---|---|---|
| 2× units | 2 | 1 | $2,014 |
| #1 | 2 | 1 | $1,007 |
| #2 | 2 | 1 | $1,007 |
| Total (2 units) | $2,013 | ||
UW: 25.0% down · 7.5% · 30yr · 1.5% tax · 5.0% vac · 8.0% maint · 8.0% mgmt
Financing live
Cash to close
- Down payment
- $33,750
- Closing costs
- $4,050
- Reserves months
- —
- Total cash needed
- —
Loan-product check · same deal, 3 products live
Conventional
25% down · 7.5% · 30yr
- Down + closing
- —
- Monthly P&I
- —
- Monthly cashflow
- —
- DSCR
- —
- Eligible?
- —
Personal DTI + credit; lowest rate.
DSCR
20% down · 8.5% · 30yr
- Down + closing
- —
- Monthly P&I
- —
- Monthly cashflow
- —
- DSCR
- —
- Eligible?
- —
No personal income docs; deal must DSCR.
Hard money
10% down · 12.0% · 12mo
- Down + closing
- —
- Monthly P&I
- —
- Monthly cashflow
- —
- DSCR
- —
- Eligible?
- —
Short-term bridge; refi at stabilization.
Listing history 23 events
-
2026-06-19days on market $135,000 Active 75 DOM
-
2026-06-18days on market $135,000 Active 74 DOM
-
2026-06-17days on market $135,000 Active 73 DOM
-
2026-06-17price $135,000 Active 72 DOM
-
2026-06-16days on market $145,000 Active 72 DOM
-
2026-06-15days on market $145,000 Active 71 DOM
-
2026-06-14days on market $145,000 Active 69 DOM
-
2026-06-12days on market $145,000 Active 68 DOM
-
2026-06-09days on market $145,000 Active 65 DOM
-
2026-06-08days on market $145,000 Active 64 DOM
-
2026-06-07days on market $145,000 Active 63 DOM
-
2026-06-07days on market $145,000 Active 62 DOM
-
2026-06-03days on market $145,000 Active 59 DOM
-
2026-06-02days on market $145,000 Active 58 DOM
-
2026-06-01days on market $145,000 Active 57 DOM
-
2026-05-31days on market $145,000 Active 56 DOM
-
2026-05-30days on market $145,000 Active 55 DOM
-
2026-04-29price $145,000
-
2026-04-15price $145,000 889-char remark
Show marketing remark (889 chars)
Turnkey duplex opportunity in Greenwood—perfect for investors or owner-occupants looking to offset their mortgage! This 2-unit property features a total of 1,820 sq ft, with each side offering 2 bedrooms and 1 full bath. The layout in both units feels open and surprisingly spacious for the square footage. One unit is already tenant-occupied, bringing in $800/month, while the second unit is vacant and ready to go—ideal for immediate rental income or for an owner to move in. The vacant side has been refreshed with brand new carpet in the bedrooms and durable luxury vinyl flooring throughout the main living areas, making it low-maintenance and attractive for tenants for years to come. With $1,600/month in potential gross rental income, this property offers strong cash flow. Located within city limits, it provides convenient access to everything Greenwood has to offer.
-
2026-04-05$160,000 Active 889-char remark
Show marketing remark (889 chars)
Turnkey duplex opportunity in Greenwood—perfect for investors or owner-occupants looking to offset their mortgage! This 2-unit property features a total of 1,820 sq ft, with each side offering 2 bedrooms and 1 full bath. The layout in both units feels open and surprisingly spacious for the square footage. One unit is already tenant-occupied, bringing in $800/month, while the second unit is vacant and ready to go—ideal for immediate rental income or for an owner to move in. The vacant side has been refreshed with brand new carpet in the bedrooms and durable luxury vinyl flooring throughout the main living areas, making it low-maintenance and attractive for tenants for years to come. With $1,600/month in potential gross rental income, this property offers strong cash flow. Located within city limits, it provides convenient access to everything Greenwood has to offer.
-
2026-04-04$160,000 Active
-
2022-04-08soldstatus $70,000
-
2014-06-30soldstatus $16,000
ⓘ Source: listings_history table (triggers on properties + properties_extension) + one-shot
backfill from property_details.listing_events for pre-trigger history.
Tax reassessment forecast SC · Resets to sale price
- Current annual tax
- $2,117 · $176/mo
- Projected year-2 tax
- $2,117 · $176/mo
- Expected delta
- $0/yr ($0/mo · 0.0%)
ⓘ Screening estimate from a state-policy table — verify with the county assessor before closing.
Climate risk First Street
- Flood 1/10 Low FEMA zone X (unshaded) · 0% chance over 30 yrs
- Wildfire 3/10 Moderate
- Heat 6/10 Major 7 d/yr ≥105°F today · 17 d/yr by 30 yrs out
- Wind 6/10 Major 27% chance of damaging wind over 30 yrs
- Air quality 4/10 Moderate 4 unhealthy d/yr today · 4 by 30 yrs out
Nearby sold comps map
Loading sold comps map…
Walkable amenities ~0.75 mi
Loading nearby amenities…
Taxation est. · year 1
- Rental income
- $24,156
- − Mortgage interest
- −$7,562
- − Property taxes
- −$2,117
- − Insurance
- −$675
- − Repairs & maintenance
- −$1,932
- − Management
- −$1,932
- − Depreciation
- −$3,927
- Taxable income
- $6,009
- Est. tax owed @ 24.0%
- −$1,442
- After-tax cash flow
- $6,353/yr
For passive investors: Depreciation is non-cash, so a rental often shows a tax loss while cash-flowing — sheltering income. Rental losses are passive: they offset passive income freely, and up to $25,000/yr can offset ordinary (W-2) income if you actively participate and your MAGI is under $100k (phasing out to $0 by $150k); unused losses carry forward. On sale, claimed depreciation is recaptured at up to 25%, and gains may owe capital-gains tax (a 1031 exchange can defer both). Figures are a year-1 estimate at your 24.0% rate — not tax advice; consult a CPA.
Schools (NCES district)
- District
- Greenwood 50
- NCES district ID
- 4502340
- Math proficiency
- 31% ▼ -4.00%
- Reading proficiency
- 39% ▲ 2.00%
- Median HH income
- $37,663
- Composite
- 29.14/100
- National rank
- #6585
- State rank
- #43 of 80 in SC
Livability — Greenwood
- Score
- 63/100
- State rank
- #167
- US rank
- #15097
Category grades
Schools grade is shown separately in the Schools card above.
Census & demographics
- Census place
- Greenwood, SC
- City population
- 26,275
- Population (ZIP)
- 28,413
Population outlook (Greenwood County) Hauer SSP2
- Today (2025)
- 69,627 people
- By 2030
- 68,905 · -1.0%
- By 2040
- 66,640 · -4.3%
- By 2050
- 63,768 · -8.4%
- By 2075
- 55,769 · -19.9%
- By 2100
- 47,293 · -32.1%
Race, ethnicity, and origin ACS 2023
- Neighborhood character
- Diverse neighborhood (Simpson 0.61)
- Race & ethnicity
- White 44% Black 43% Hispanic / Latino 10% Two or more races 3%
- Hispanic origin (detail)
- Mexican 9%
- Common ancestry
- Slovak 1% Serbian 1% Lithuanian 1%
- Foreign-born
- 5% · Canada, Dominican Republic
- Languages at home
- 92% English-only · Spanish 7%
Political lean MEDSL · Greenwood
- 2024 margin
- Strong R (+29.0) · D 34.9% · R 63.8% · Other 1.3%
- 2008→2024 swing
- -13.3pp toward R · 2008: -15.7pp · 2024: -29.0pp
- All cycles
- 2024: R+29.0 2020: R+22.8 2016: R+21.8 2012: R+15.4 2008: R+15.7
Not yet ingested
- Civics
- —
Market trends
- HPI YoY
- ▼ -208.03%
- Current HPI
- 153.1055
- Rent YoY
- —
- Metro
- —
- State GDP YoY
- ▲ 4.51%
- F500 in state
- 2
Industry mix (Fortune 500 HQ in SC)
| Industry | F500 HQs | Revenue |
|---|---|---|
| Packaging | 1 | $7B |
|
||
Price history
+806.2% since first listed6 events — show timeline
- 2026-04-29 Price Changed $145,000 Greater Greenville MLS
- 2026-04-15 Price Changed $145,000 GAOR
- 2026-04-05 Listed $160,000 GAOR
- 2026-04-04 Listed $160,000 Greater Greenville MLS
- 2022-04-08 Sold (Public Records) $70,000 Public Records
- 2014-06-30 Sold (Public Records) $16,000 Public Records
Property tax history
+6.5%/yrLatest (2025): $2,117 · +1.6% YoY. Source: county tax records.
Cash-flow waterfall
monthlySold comps — $/sqft
last 12 mo · ≤1 miLoading sold comps…