9448 Pinewood Ave · Elberta, AL
Flood risk 1/10 · Minimal
- FEMA flood zone
- X (unshaded)
- Chance of flooding over 30 yrs
- 0.0%
- Est. flood insurance / yr
- $507 – $1,088
Fire risk 4/10 · Minor
- Est. fire insurance / yr
- $916 – $1,700
Heat risk 10/10 · Severe
- Hot days now (above 104°F)
- 7 days/yr
- Hot days in 30 yrs
- 23 days/yr
Wind risk 9/10 · Severe
- Chance of severe wind over 30 yrs
- 99.0%
Air-quality risk 2/10 · Minimal
- Unhealthy air days now
- 1 days/yr
- Unhealthy air days in 30 yrs
- 1 days/yr
Risk factors via First Street. Map © Google.
Why this score? — see what drove the C+ grade
The composite is a weighted blend of 9 inputs, each scored 0–100. Each bar is that input's sub-score; the figure is the points it added to the 100-point composite (weight × sub-score).
- Cash flow +25.8/30.0
- ARV discount +12.9/15.0
- DSCR +8.6/10.0
- 1% rule +5.6/10.0
- Schools +3.9/10.0
- Livability +2.8/5.0
- Rent growth +2.5/5.0
- Condition / age +2.5/5.0
- Appreciation +0.0/10.0
$179,900
🖨 Deal sheet (PDF) 📄 Offer letter ✓ Due diligence
Listing remarks
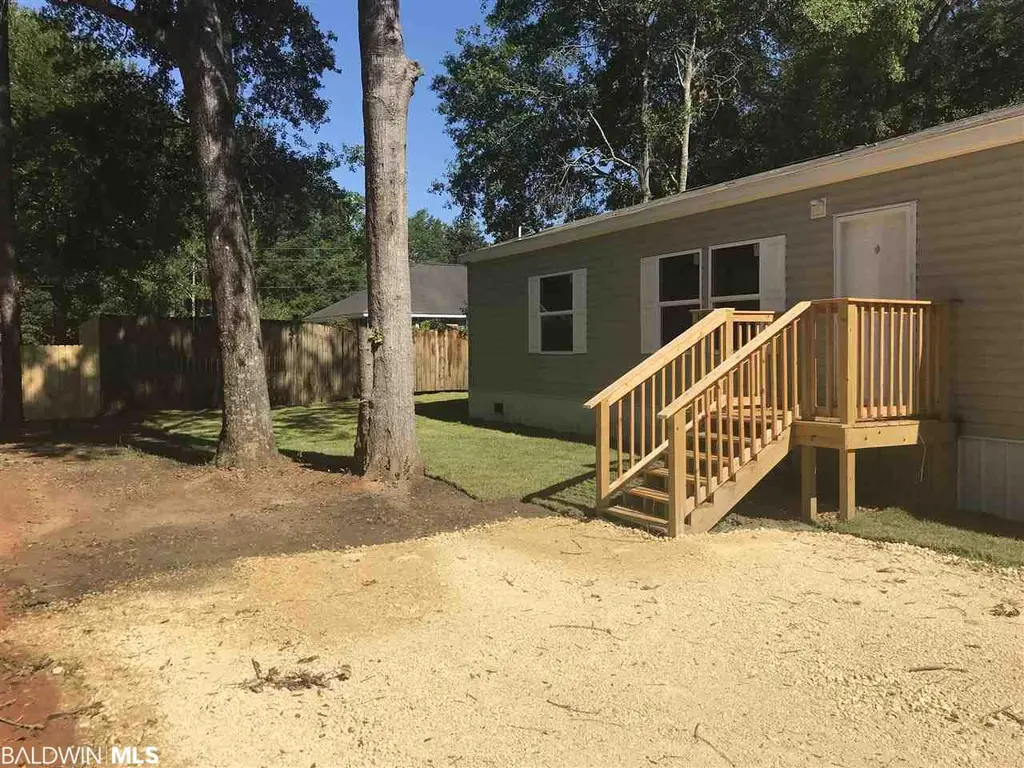
Back on the Market!!!!!!! 3 bedrooms and 2 full bathrooms located just a short walk to Wolf Bay!!!!!! Private boat launch, pier and a large common are perfect for the weekend picnics!!!!!! New pictures to be posted soon!!!!!!!! Call today to see this home located within the Elberts School District!!!!!! Buyer to verify all information during due diligence.
Key facts
- 7,000 sq ft lot
- Built 2020
- Listed 101 days
Property features AI
Finance
- HOA & community: No transfer fees; Community features: Fishing
Exterior
- Parking: Parking for three or more vehicles
- Utilities: Orange Beach Water Authority water; Riviera Utilities; Electric service by Baldwin EMC
- Home design: One-story home; Resale property
- Construction: Vinyl siding; Pillar/post/pier foundation; Composition roof; Approx. 1,024 square feet (per seller)
- Exterior features: Boat ramp access; Lot less than 1 acre; Whole/full ownership
Interior
- Kitchen: Dishwasher; Electric range; Refrigerator
- Bedrooms: Master bedroom on the main level (approx. 14.5' x 11.5'); Second bedroom (approx. 12' x 8'); Third bedroom (approx. 11.4' x 8.5')
- Flooring: Vinyl flooring
- Bathrooms: 2 full bathrooms
- Heating & cooling: Electric heating; Central electric cooling
- Interior features: Ceiling fan(s); No fireplace
Neighborhood map
What this means for you Summary
Snapshot
- This is a 3-bed/2.0-bath manufactured listed at $180k.
Deal economics
- At list price, monthly cash flow is $436 ($5k/yr) — positive.
- The deal already cash-flows at list — no discount required.
- Meets the 1% rule at list price ($2k rent vs $180k).
- Recommended offer: $164k (9.0% below list) — sets the bar for market timing.
- Cap rate 9.2% vs local median 3.2% in Elberta — top-decile yield for the area; either an underpriced asset or a hidden risk that comps aren't pricing in. Stress-test before assuming the spread holds.
Location & tenants
- Location reads 55/100 on livability (#433 in AL) — a working-class tenant base; expect higher turnover. Strengths: cost of living A+, housing A+; Watch: employment C-, crime F, amenities F.
- Baldwin County (rural): math 33% / reading 57% proficiency, ranked #18 of 129 in AL (top 14%) — families likely to look elsewhere, expect single-tenant / working-renter base with shorter leases.
- Zoned schools: Elberta Elementary School (math 47% / reading 65%, grade C+, #83 of 627 statewide, top 13%, 884 students, 58% FRL); Elberta Middle School (math 21% / reading 67%, grade D, #42 of 257 statewide, top 17%, 267 students, 63% FRL); Elberta High School (math 32% / reading 37%, grade F, #47 of 305 statewide, top 17%, 784 students, 60% FRL) — zoned schools average 60% FRL vs 38% district-wide (22 pts higher); higher-poverty schools than district average — tighter screening recommended.
- Market conditions: 162 active listings in the ZIP; 3,883 units permitted in Baldwin County in 2024 (481 in 5+ unit buildings).
Forward outlook
- Local home prices are declining (-3.0%/yr); year-one equity from $1k of loan paydown is wiped out by about $5k of value loss. Plan a longer hold.
- Baldwin County population projected at +42% by 2050 — long-run rental-demand tailwind backs the buy-and-hold thesis.
Negotiation context
- It's been on market 101 days — a 9% lower offer ($164k) is reasonable based on typical stale-listing flexibility.
- 3 sale attempts since 6y ago with the ask held roughly flat each time — persistent listings suggest the price (not the market) is what's stuck; bring a comps-based counter.
Risks & watch-outs
- Climate carrying-cost: severe wind risk, 99% chance of damaging wind over 30y; extreme-heat days projected 7→23/yr by 2055 (HVAC capex compounding) — expect insurance premiums to compound above CPI over the hold.
Questions for the listing agent
- It's been on market 101 days. Have you received any prior offers? Is the seller open to a 9% concession, seller financing, or rate buy-down credit?
- Why hasn't it sold? Are there any deal-killer items the seller is aware of (foundation, flood, title, zoning, code violations)?
- Is there a deadline driving the sale (1031 exchange, divorce, estate, relocation)? That informs how much negotiation room exists.
- Schools are B-rated — typically a magnet for longer-tenancy family renters. What's the average tenant stay here, and is there a school-zone premium baked into asking?
- Crime grade is F in this area — have there been break-ins, vandalism, or insurance claims at this property in the last 3 years? What carrier currently insures it and at what premium?
- What's the average days-on-market for RENTAL listings here right now (not sales)? A rising rental-DOM trend means longer vacancies and softer asking-rent achievability than the comps imply.
- What's the recent tenant-quality profile in this submarket — average credit score on applications, eviction rate, late-payment / NSF rate, and stable-employment percentage? A property-management company in the area should have these aggregated.
- How much new for-sale + rental construction is in the pipeline within 1–3 miles? Heavy new supply typically softens prices + rents 12–24 months out; constrained supply supports both.
Investment metrics
- 1% rule
- 1.06% ✓
- Cap rate
- 9.20%
- Cash-on-cash
- 10.40%
- DSCR
- 1.46
- GRM
- 7.9
CMA / ARV
- ARV (median comp)
- $204,500
- List price
- $179,900
- Delta
- -12.03%
- Verdict
- UNDERPRICED
- Comps
- 2 within 1.0 mi
Show comp detail 4 sales within ~0.75 mi
| Address | Dist | Beds/Ba | Sqft | Sold | Price | $/sf | Match |
|---|---|---|---|---|---|---|---|
| 9492 Brighton Ave | 0.13mi | 3/2.0 | 1,178 (+2%) | 14mo | $275,000 | $233 | 79 |
| 25185 Pompano Dr | 0.31mi | 3/2.0 | 1,216 (+6%) | 2mo | $259,000 | $213 | 75 |
| 25317 Pompano Dr | 0.25mi | 3/2.0 | 1,120 (-3%) | 14mo | $105,000 | $94 | 72 |
| 9380 Seabright Ave | 0.10mi | 2/2.0 (-1) | 1,216 (+6%) | 13mo | $150,000 | $123 | 70 |
Match score weights: distance 35% · size 25% · config 20% · recency 20%. Top-matched comps best support the ARV.
Projected returns pro-forma
-3.0% appreciation · 3.0% rent growth · sell at horizon
- IRR
- -0.7%
- Equity multiple
- 0.97×
- Total profit
- $-1,432
- Equity at exit
- $26,824
- IRR
- 8.9%
- Equity multiple
- 1.68×
- Total profit
- $34,227
- Equity at exit
- $15,554
Cash invested: $50,372 (down + closing). Projections, not guarantees.
Landlord ↔ Tenant lean methodology
- Overall (STATE)
- 90 Strongly Landlord-Friendly
- State Alabama
- 90 Strongly Landlord-Friendly · R+15
- County
- — inherits STATE
- City
- — inherits STATE
ZIP-level market 36530
- Home prices YoY
- -4.5%
- Active inventory
- 162
- Price-to-rent
- 7.9×
Monthly cashflow live
- Estimated rent
- $1,905 medium interval (Pro) →
- Mortgage (P&I)
- −$943
- Tax from tax record
- −$50 /mo · $600/yr
- Insurance
- −$75
- HOA
- −$0
- Vacancy / Maint / Mgmt
- −$400
- Net cashflow
- $436
Break-even live
Sensitivity live
| Price | -10% $538 | -5% $487 | +0% $436 | +5% $386 | +10% $335 |
|---|---|---|---|---|---|
| Rent | -10% $286 | -5% $361 | +0% $436 | +5% $512 | +10% $587 |
| Rate | -1.0pp $527 | -0.5pp $482 | base $436 | +0.5pp $390 | +1.0pp $342 |
UW: 25.0% down · 7.5% · 30yr · 1.5% tax · 5.0% vac · 8.0% maint · 8.0% mgmt
Financing live
Cash to close
- Down payment
- $44,975
- Closing costs
- $5,397
- Reserves months
- —
- Total cash needed
- —
Loan-product check · same deal, 3 products live
Conventional
25% down · 7.5% · 30yr
- Down + closing
- —
- Monthly P&I
- —
- Monthly cashflow
- —
- DSCR
- —
- Eligible?
- —
Personal DTI + credit; lowest rate.
DSCR
20% down · 8.5% · 30yr
- Down + closing
- —
- Monthly P&I
- —
- Monthly cashflow
- —
- DSCR
- —
- Eligible?
- —
No personal income docs; deal must DSCR.
Hard money
10% down · 12.0% · 12mo
- Down + closing
- —
- Monthly P&I
- —
- Monthly cashflow
- —
- DSCR
- —
- Eligible?
- —
Short-term bridge; refi at stabilization.
Listing history 9 events
-
2026-05-30status $179,900 Pending 101 DOM
-
2026-02-17$179,900 Active
-
2026-02-17price $179,900
-
2025-08-23price $179,900
-
2025-06-27$189,900 Active
-
2021-06-03soldstatus
-
2021-05-24soldstatus $35,000
-
2020-03-17$137,400
-
2005-06-24soldstatus $78,000
ⓘ Source: listings_history table (triggers on properties + properties_extension) + one-shot
backfill from property_details.listing_events for pre-trigger history.
Tax reassessment forecast AL · Resets to sale price
- Current annual tax
- $600 · $50/mo
- Projected year-2 tax
- $738 · $61/mo
- Expected delta
- +$138/yr (+$11/mo · 22.9%)
ⓘ Screening estimate from a state-policy table — verify with the county assessor before closing.
Climate risk First Street
- Flood 1/10 Low FEMA zone X (unshaded) · 0% chance over 30 yrs
- Wildfire 4/10 Moderate
- Heat 10/10 Extreme 7 d/yr ≥104°F today · 23 d/yr by 30 yrs out
- Wind 9/10 Extreme 99% chance of damaging wind over 30 yrs
- Air quality 2/10 Low 1 unhealthy d/yr today · 1 by 30 yrs out
Nearby sold comps map
Loading sold comps map…
Walkable amenities ~0.75 mi
Loading nearby amenities…
Taxation est. · year 1
- Rental income
- $22,858
- − Mortgage interest
- −$10,077
- − Property taxes
- −$600
- − Insurance
- −$900
- − Repairs & maintenance
- −$1,829
- − Management
- −$1,829
- − Depreciation
- −$5,233
- Taxable income
- $2,391
- Est. tax owed @ 24.0%
- −$574
- After-tax cash flow
- $4,664/yr
For passive investors: Depreciation is non-cash, so a rental often shows a tax loss while cash-flowing — sheltering income. Rental losses are passive: they offset passive income freely, and up to $25,000/yr can offset ordinary (W-2) income if you actively participate and your MAGI is under $100k (phasing out to $0 by $150k); unused losses carry forward. On sale, claimed depreciation is recaptured at up to 25%, and gains may owe capital-gains tax (a 1031 exchange can defer both). Figures are a year-1 estimate at your 24.0% rate — not tax advice; consult a CPA.
Schools (NCES district)
- District
- Baldwin County
- NCES district ID
- 0100270
- Math proficiency
- 33% ▼ -26.00%
- Reading proficiency
- 57% ▲ 1.00%
- Median HH income
- $50,677
- Composite
- 38.61/100
- National rank
- #4157
- State rank
- #18 of 129 in AL
Livability — Elberta
- Score
- 55/100
- State rank
- #433
- US rank
- #23280
Category grades
Schools grade is shown separately in the Schools card above.
Census & demographics
- Census place
- Elberta, AL
- Population (ZIP)
- 6,824
Population outlook (Baldwin County) Hauer SSP2
- Today (2025)
- 248,264 people
- By 2030
- 270,315 · +8.9%
- By 2040
- 312,967 · +26.1%
- By 2050
- 352,262 · +41.9%
- By 2075
- 438,841 · +76.8%
- By 2100
- 487,736 · +96.5%
Race, ethnicity, and origin ACS 2023
- Neighborhood character
- Predominantly White (92%)
- Race & ethnicity
- White 92% Two or more races 7% Hispanic / Latino 4%
- Common ancestry
- Italian 5% Slovak 2% Romanian 1%
- Foreign-born
- 3% · Canada
- Languages at home
- 97% English-only · Spanish 2%
Political lean MEDSL · Baldwin
- 2024 margin
- Solid R (+58.2) · D 20.5% · R 78.7%
- 2008→2024 swing
- -6.7pp toward R · 2008: -51.5pp · 2024: -58.2pp
- All cycles
- 2024: R+58.2 2020: R+53.8 2016: R+57.8 2012: R+55.8 2008: R+51.5
Not yet ingested
- Civics
- —
Market trends
- HPI YoY
- ▼ -17.08%
- Current HPI
- 366.2288
- Rent YoY
- —
- Metro
- —
- State GDP YoY
- ▲ 2.94%
- F500 in state
- 4
Industry mix (Fortune 500 HQ in AL)
| Industry | F500 HQs | Revenue |
|---|---|---|
| Financial Services | 1 | $8B |
|
||
| Healthcare | 1 | $5B |
|
||
Price history
+117.8% since first listed10 events — show timeline
- 2026-06-01 Sold (MLS) $169,900 BCAR
- 2026-05-29 Pending — BCAR
- 2026-02-17 Listed $179,900 BCAR
- 2026-02-17 Price Changed $179,900 BCAR
- 2025-08-23 Price Changed $179,900 BCAR
- 2025-06-27 Listed $189,900 BCAR
- 2021-06-03 Sold (MLS) $169,900 BCAR
- 2021-05-24 Sold (Public Records) $35,000 Public Records
- 2020-03-17 Listed $137,400 BCAR
- 2005-06-24 Sold (Public Records) $78,000 Public Records
Property tax history
+10.6%/yrLatest (2025): $600 · +5.3% YoY. Source: county tax records.
Cash-flow waterfall
monthlySold comps — $/sqft
last 12 mo · ≤1 miLoading sold comps…