212 Glendale Dr · Denton, MI
Flood risk 1/10 · Minimal
- FEMA flood zone
- X (unshaded)
- Chance of flooding over 30 yrs
- 0.0%
- Est. flood insurance / yr
- $473 – $860
Fire risk 2/10 · Minimal
- Est. fire insurance / yr
- $784 – $1,456
Heat risk 1/10 · Minimal
- Hot days now (above 93°F)
- 7 days/yr
- Hot days in 30 yrs
- 13 days/yr
Wind risk 1/10 · Minimal
- Chance of severe wind over 30 yrs
- —
Air-quality risk 2/10 · Minimal
- Unhealthy air days now
- 0 days/yr
- Unhealthy air days in 30 yrs
- 1 days/yr
Risk factors via First Street. Map © Google.
Why this score? — see what drove the D+ grade
The composite is a weighted blend of 9 inputs, each scored 0–100. Each bar is that input's sub-score; the figure is the points it added to the 100-point composite (weight × sub-score).
- Cash flow +20.2/30.0
- DSCR +6.4/10.0
- ARV discount +5.0/15.0
- 1% rule +4.8/10.0
- Rent growth +2.5/5.0
- Livability +2.5/5.0
- Condition / age +2.5/5.0
- Schools +2.2/10.0
- Appreciation +0.0/10.0
$169,900
🖨 Deal sheet 📄 Offer letter ✓ Due diligence
Listing remarks MLS
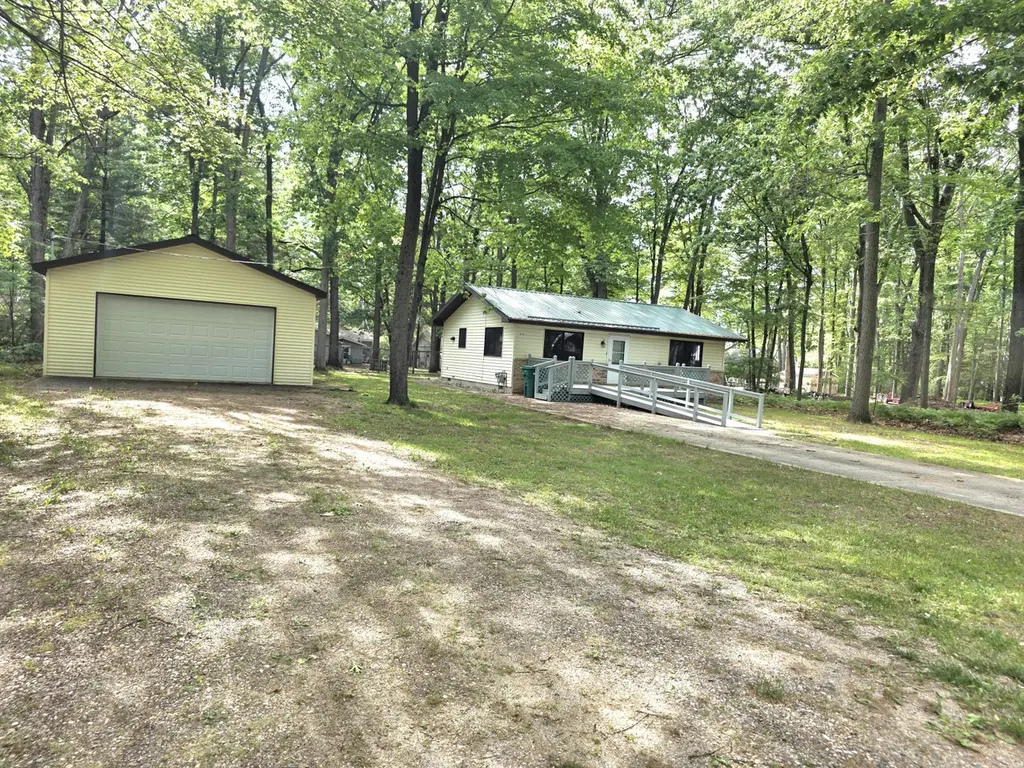
Built in 1987 with a open floor plan & handicap assessable are some of the selling points for this charming home. From the outside of the home you will notice a large front porch with wheel chair ramp leading to your front door. As you move through the living area you will notice 2 bedrooms to the left along with the 3/4 bath with hand rails and low clearance shower. Finally we go through the large dining room and kitchen with laundry hook ups to right side and out the back door to view a smaller deck that looks over concrete patio with built in fire pit and large shed. All of this is located on 2 lots close to town and public beaches.
Key facts
- Cement fire pit
- Plenty of parking
- Double lot
Tags
Property features AI
Exterior
- Parking: 2-car garage
- Utilities: Well water; Public sewer
- Home design: Single family residence; Residential property; 100 x 150 lot (0.34 acres); Zoned residential; Subdivision: T22N R3W
- Construction: Crawl space / no finished basement
- Exterior features: Paved road access; Shed on property
Interior
- Kitchen: Dishwasher; Oven; Range; Refrigerator
- Bathrooms: 1 full bathroom
- Heating & cooling: Forced air heating; Natural gas fuel
- Interior features: Dishwasher; Dryer; Refrigerator; Washer; Oven; Range; Gas water heater
- Laundry & utility: Main level laundry; Washer; Dryer
Neighborhood map
What this means for you Summary
Snapshot
- This is a 2-bed/1.0-bath single-family listed at $170k.
Deal economics
- At list price, monthly cash flow is $213 ($3k/yr) — positive.
- The deal already cash-flows at list — no discount required.
- To meet the 1% rule (rent ≥ 1% of price), the offer needs to be $167k (1.7% below list).
- Recommended offer: $167k (1.7% below list) — sets the bar for 1% rule.
Location & tenants
- Location reads: area grade D — affects rentability + tenant quality, not the cash-flow math above.
- Houghton Lake Community Schools (rural): math 18% / reading 36% proficiency, ranked #410 of 540 in MI (top 76%) — low school quality limits family demand, transient renter base, plan for 1-2y turnover.
- Zoned schools: Houghton Lake Jrsr High School (math 17% / reading 37%, grade F, #462 of 713 statewide, top 66%, 511 students, 71% FRL).
- Market conditions: 84 active listings in the ZIP; 73 units permitted in Roscommon County in 2024 (0 in 5+ unit buildings).
Forward outlook
- Local home prices are declining (-3.0%/yr); year-one equity from $1k of loan paydown is wiped out by about $5k of value loss. Plan a longer hold.
- Roscommon County population projected at -21% by 2050 — secular population decline; favor cash flow + early exit over multi-decade hold.
Negotiation context
- Only 6 days on market — expect competitive offers; lowballing is unlikely to land.
- Current owner paid $48k; list at $170k implies a 258% gain — meaningful room to come down on a strong offer.
Questions for the listing agent
- Is there a deadline driving the sale (1031 exchange, divorce, estate, relocation)? That informs how much negotiation room exists.
- The area grade is low — what's the realistic commute time and amenity access for the typical tenant pool here? Any planned neighborhood developments (good or bad) we should know about?
- What's the average days-on-market for RENTAL listings here right now (not sales)? A rising rental-DOM trend means longer vacancies and softer asking-rent achievability than the comps imply.
- What's the recent tenant-quality profile in this submarket — average credit score on applications, eviction rate, late-payment / NSF rate, and stable-employment percentage? A property-management company in the area should have these aggregated.
- How much new for-sale + rental construction is in the pipeline within 1–3 miles? Heavy new supply typically softens prices + rents 12–24 months out; constrained supply supports both.
Investment metrics
- 1% rule
- 0.98% ✗
- Cap rate
- 7.80%
- Cash-on-cash
- 5.38%
- DSCR
- 1.24
- GRM
- 8.5
CMA / ARV
- ARV (on-the-fly)
- $160,888
- Comps found
- 9
Show comp detail 9 sales within ~0.75 mi
| Address | Dist | Beds/Ba | Sqft | Sold | Price | $/sf | Match |
|---|---|---|---|---|---|---|---|
| 204 Arrowhead Dr | 0.23mi | 2/1.0 | 900 (+2%) | 13mo | $176,000 | $196 | 75 |
| 200 Peach Tree Ave | 0.57mi | 2/1.0 | 900 (+2%) | 2mo | $115,000 | $128 | 69 |
| 584 W Houghton Lake Dr | 0.28mi | 2/1.0 | 816 (-8%) | 11mo | $165,000 | $202 | 65 |
| 230 Glendale Dr | 0.10mi | 2/1.0 | 780 (-12%) | 15mo | $142,000 | $182 | 63 |
| 302 W Houghton Lake Dr | 0.19mi | 2/1.5 | 832 (-6%) | 21mo | $210,000 | $252 | 62 |
| 504 Sullivan | 0.66mi | 2/1.0 | 908 (+3%) | 14mo | $135,000 | $149 | 53 |
| 2931 S Gladwin Rd | 0.67mi | 3/1.0 (+1) | 975 (+10%) | 16mo | $105,000 | $108 | 33 |
| 208 Pine Oak Dr | 0.58mi | 2/1.0 | 768 (-13%) | 24mo | $87,500 | $114 | 32 |
| 107 Waldenwood | 0.74mi | 3/1.5 (+1) | 1,008 (+14%) | 24mo | $315,000 | $313 | 15 |
Match score weights: distance 35% · size 25% · config 20% · recency 20%. Top-matched comps best support the ARV.
Projected returns pro-forma
-3.0% appreciation · 3.0% rent growth · sell at horizon
- IRR
- -8.0%
- Equity multiple
- 0.71×
- Total profit
- $-13,971
- Equity at exit
- $25,333
- IRR
- 1.6%
- Equity multiple
- 1.11×
- Total profit
- $5,249
- Equity at exit
- $14,690
Cash invested: $47,572 (down + closing). Projections, not guarantees.
Landlord ↔ Tenant lean methodology
- Overall (STATE)
- 62 Landlord-Friendly
- State Michigan
- 62 Landlord-Friendly · EVEN
- County
- — inherits STATE
- City
- — inherits STATE
ZIP-level market 48651
- Home prices YoY
- -25.6%
- Active inventory
- 84
- Price-to-rent
- 8.5×
Monthly cashflow live
- Estimated rent
- $1,671 medium interval (Pro) →
- Mortgage (P&I)
- −$891
- Tax from tax record
- −$145 /mo · $1,739/yr
- Insurance
- −$71
- HOA
- −$0
- Vacancy / Maint / Mgmt
- −$351
- Net cashflow
- $213
Break-even live
UW: 25.0% down · 7.5% · 30yr · 1.5% tax · 5.0% vac · 8.0% maint · 8.0% mgmt
Financing live
Cash to close
- Down payment
- $42,475
- Closing costs
- $5,097
- Reserves months
- —
- Total cash needed
- —
Loan-product check · same deal, 3 products live
Conventional
25% down · 7.5% · 30yr
- Down + closing
- —
- Monthly P&I
- —
- Monthly cashflow
- —
- DSCR
- —
- Eligible?
- —
Personal DTI + credit; lowest rate.
DSCR
20% down · 8.5% · 30yr
- Down + closing
- —
- Monthly P&I
- —
- Monthly cashflow
- —
- DSCR
- —
- Eligible?
- —
No personal income docs; deal must DSCR.
Hard money
10% down · 12.0% · 12mo
- Down + closing
- —
- Monthly P&I
- —
- Monthly cashflow
- —
- DSCR
- —
- Eligible?
- —
Short-term bridge; refi at stabilization.
Listing history 6 events
-
2026-06-18days on market $169,900 Active 6 DOM
-
2026-06-17days on market $169,900 Active 5 DOM
-
2026-06-16days on market $169,900 Active 4 DOM
-
2026-06-15days on market $169,900 Active 3 DOM
-
2026-06-12remarks 668-char remark
-
2026-06-12$169,900 Active 1 DOM
ⓘ Source: listings_history table (triggers on properties + properties_extension) + one-shot
backfill from property_details.listing_events for pre-trigger history.
Tax reassessment forecast MI · Partial reset (capped growth)
- Current annual tax
- $1,739 · $145/mo
- Projected year-2 tax
- $2,178 · $181/mo
- Expected delta
- +$439/yr (+$37/mo · 25.2%)
ⓘ Screening estimate from a state-policy table — verify with the county assessor before closing.
Climate risk First Street
- Flood 1/10 Low FEMA zone X (unshaded) · 0% chance over 30 yrs
- Wildfire 2/10 Low
- Heat 1/10 Low 7 d/yr ≥93°F today · 13 d/yr by 30 yrs out
- Wind 1/10 Low
- Air quality 2/10 Low 0 unhealthy d/yr today · 1 by 30 yrs out
Nearby sold comps map
Loading sold comps map…
Walkable amenities ~0.75 mi
Loading nearby amenities…
Taxation est. · year 1
- Rental income
- $20,049
- − Mortgage interest
- −$9,517
- − Property taxes
- −$1,739
- − Insurance
- −$850
- − Repairs & maintenance
- −$1,604
- − Management
- −$1,604
- − Depreciation
- −$4,943
- Taxable loss
- −$208
- Est. tax savings @ 24.0%
- +$50
- After-tax cash flow
- $2,608/yr
For passive investors: Depreciation is non-cash, so a rental often shows a tax loss while cash-flowing — sheltering income. Rental losses are passive: they offset passive income freely, and up to $25,000/yr can offset ordinary (W-2) income if you actively participate and your MAGI is under $100k (phasing out to $0 by $150k); unused losses carry forward. On sale, claimed depreciation is recaptured at up to 25%, and gains may owe capital-gains tax (a 1031 exchange can defer both). Figures are a year-1 estimate at your 24.0% rate — not tax advice; consult a CPA.
Schools (NCES district)
- District
- Houghton Lake Community Schools
- NCES district ID
- 2618600
- Math proficiency
- 18% ▼ -7.00%
- Reading proficiency
- 36% ▼ -3.00%
- Median HH income
- $34,744
- Composite
- 22.19/100
- National rank
- #8158
- State rank
- #410 of 540 in MI
Livability — Denton
No livability data for this city. (Only ~50 U.S. cities are tracked.)
Census & demographics
- Census place
- Prudenville, MI
- Population (ZIP)
- 4,331
Population outlook (Roscommon County) Hauer SSP2
- Today (2025)
- 22,249 people
- By 2030
- 21,206 · -4.7%
- By 2040
- 19,070 · -14.3%
- By 2050
- 17,564 · -21.1%
- By 2075
- 15,420 · -30.7%
- By 2100
- 13,168 · -40.8%
Race, ethnicity, and origin ACS 2023
- Neighborhood character
- Predominantly White (94%)
- Race & ethnicity
- White 94% Two or more races 4% Hispanic / Latino 1%
- Common ancestry
- Romanian 9% Slovak 4% Iranian 4%
- Foreign-born
- 2%
- Languages at home
- 98% English-only · Spanish 1%
Political lean MEDSL · Roscommon
- 2024 margin
- Solid R (+32.9) · D 32.9% · R 65.9% · Other 1.2%
- 2008→2024 swing
- -35.5pp toward R · 2008: 2.5pp · 2024: -32.9pp
- All cycles
- 2024: R+32.9 2020: R+30.0 2016: R+29.6 2012: R+3.9 2008: D+2.5
Not yet ingested
- Civics
- —
Market trends
- HPI YoY
- ▼ -87.27%
- Current HPI
- 252.9662
- Rent YoY
- —
- Metro
- —
- State GDP YoY
- ▲ 1.37%
- F500 in state
- 28
Industry mix (Fortune 500 HQ in MI)
| Industry | F500 HQs | Revenue |
|---|---|---|
| Automotive Parts | 3 | $48B |
|
||
| Automotive | 2 | $372B |
|
||
| Chemicals | 1 | $45B |
|
||
| Automotive Retail | 1 | $29B |
|
||
| Healthcare / Medical Devices | 1 | $23B |
|
||
| Automotive Technology | 1 | $20B |
|
||
Price history
+257.7% since first listed3 events — show timeline
- 2026-06-10 Listed $169,900 WWMLS
- 2017-06-13 Sold (Public Records) $47,500 Public Records
- 2017-06-08 Sold (MLS) $47,500 WWMLS
Property tax history
+3.3%/yrLatest (2025): $1,739 · +2.7% YoY. Source: county tax records.
Cash-flow waterfall
monthlySold comps — $/sqft
last 12 mo · ≤1 miLoading sold comps…