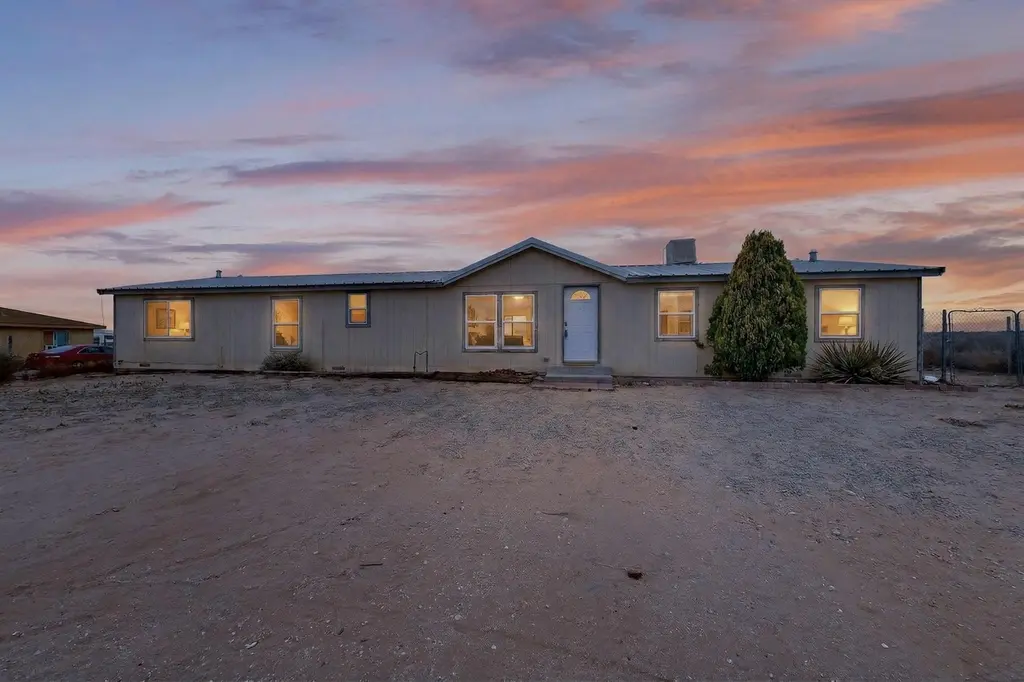
217 Hondo Rd SW · Rio Rancho, NM
Flood risk 4/10 · Minor
- FEMA flood zone
- X (unshaded)
- Chance of flooding over 30 yrs
- 0.22%
- Est. flood insurance / yr
- $507 – $1,088
Fire risk 3/10 · Minor
- Est. fire insurance / yr
- $706 – $1,312
Heat risk 4/10 · Minor
- Hot days now (above 94°F)
- 7 days/yr
- Hot days in 30 yrs
- 19 days/yr
Wind risk 1/10 · Minimal
- Chance of severe wind over 30 yrs
- —
Air-quality risk 1/10 · Minimal
- Unhealthy air days now
- 0 days/yr
- Unhealthy air days in 30 yrs
- 0 days/yr
Risk factors via First Street. Map © Google.
Why this score? — see what drove the B grade
The composite is a weighted blend of 9 inputs, each scored 0–100. Each bar is that input's sub-score; the figure is the points it added to the 100-point composite (weight × sub-score).
- Cash flow +26.8/30.0
- ARV discount +15.0/15.0
- DSCR +9.2/10.0
- 1% rule +6.1/10.0
- Schools +5.2/10.0
- Livability +3.6/5.0
- Rent growth +3.3/5.0
- Condition / age +2.5/5.0
- Appreciation +0.0/10.0
$220,000
🖨 Deal sheet 📄 Offer letter ✓ Due diligence
Listing remarks MLS
Wonderful opportunity sitting on approximately 0.87 acres in Rio Rancho! This property features an open layout and a functional floor plan ready for renovation. Most of the popcorn ceiling and some flooring have been removed, giving a head start on the remodel. The home includes a metal roof and multiple outbuildings, providing additional storage or workspace. Ideal for investors or buyers looking to bring their vision to life.
Key facts
- 0.87 acre lot
- Built 1997
- Listed 10 days
Neighborhood map
What this means for you Summary
Snapshot
- This is a 4-bed/2.0-bath single-family listed at $220k.
Deal economics
- At list price, monthly cash flow is $599 ($7k/yr) — positive.
- The deal already cash-flows at list — no discount required.
- Meets the 1% rule at list price ($2k rent vs $220k).
- Cap rate 9.6% vs local median 3.6% in Rio Rancho — top-decile yield for the area; either an underpriced asset or a hidden risk that comps aren't pricing in. Stress-test before assuming the spread holds.
Location & tenants
- Location reads 71/100 on livability (#17 in NM) — a middle-class / working-renter tenant base. Strengths: housing A+, cost of living A; Watch: schools C-, amenities D, commute F.
- Rio Rancho Public Schools (suburban): math 48% / reading 73% proficiency, ranked #4 of 29 in NM (top 14%) — acceptable for families but not a draw, mixed tenant base, ~2y average lease.
- Market conditions: Rents rising (+3.1%/yr); 825 active listings in the ZIP; 1 comparable units currently listed for rent nearby; solid renter incomes; 1,278 units permitted in Sandoval County in 2024 (216 in 5+ unit buildings).
- This rent runs 34% of the median local income ($87k/yr) — at the standard rent-burdened threshold; future hikes will face affordability resistance.
Forward outlook
- Local home prices are declining (-3.0%/yr); year-one equity from $2k of loan paydown is wiped out by about $7k of value loss. Plan a longer hold.
- Sandoval County population projected at +15% by 2050 — long-run rental-demand tailwind backs the buy-and-hold thesis.
- At projected returns (-3.0% appreciation + 3.1% rent growth), your $62k cash investment doubles in ~10 years — after that, you're playing with house money.
Negotiation context
- Only 10 days on market — expect competitive offers; lowballing is unlikely to land.
- 2 sale attempts with the ask held roughly flat each time — persistent listings suggest the price (not the market) is what's stuck; bring a comps-based counter.
Questions for the listing agent
- Is there a deadline driving the sale (1031 exchange, divorce, estate, relocation)? That informs how much negotiation room exists.
- What's the average days-on-market for RENTAL listings here right now (not sales)? A rising rental-DOM trend means longer vacancies and softer asking-rent achievability than the comps imply.
- What's the recent tenant-quality profile in this submarket — average credit score on applications, eviction rate, late-payment / NSF rate, and stable-employment percentage? A property-management company in the area should have these aggregated.
- How much new for-sale + rental construction is in the pipeline within 1–3 miles? Heavy new supply typically softens prices + rents 12–24 months out; constrained supply supports both.
Investment metrics
- 1% rule
- 1.11% ✓
- Cap rate
- 9.56%
- Cash-on-cash
- 11.67%
- DSCR
- 1.52
- GRM
- 7.5
CMA / ARV
- ARV (median comp)
- $370,545
- List price
- $220,000
- Delta
- -40.63%
- Verdict
- UNDERPRICED
- Comps
- 20 within 1.0 mi
Show comp detail 1 sale within ~0.75 mi
| Address | Dist | Beds/Ba | Sqft | Sold | Price | $/sf | Match |
|---|---|---|---|---|---|---|---|
| 128 Prism Ave SW | 0.62mi | 4/2.0 | 1,897 (-8%) | 1mo | $345,000 | $182 | 56 |
Match score weights: distance 35% · size 25% · config 20% · recency 20%. Top-matched comps best support the ARV.
Projected returns pro-forma
-3.0% appreciation · 3.13% rent growth · sell at horizon
- IRR
- 1.2%
- Equity multiple
- 1.04×
- Total profit
- $2,756
- Equity at exit
- $32,803
- IRR
- 10.9%
- Equity multiple
- 1.85×
- Total profit
- $52,543
- Equity at exit
- $19,022
Cash invested: $61,600 (down + closing). Projections, not guarantees.
Landlord ↔ Tenant lean methodology
- Overall (STATE)
- 55 Moderately Landlord-Leaning
- State New Mexico
- 55 Moderately Landlord-Leaning · D+3
- County
- — inherits STATE
- City
- — inherits STATE
ZIP-level market 87124
- Rents YoY
- 3.1%
- Active inventory
- 825
- Price-to-rent
- 7.5×
Monthly cashflow live
- Estimated rent
- $2,447 medium interval (Pro) →
- Mortgage (P&I)
- −$1,154
- Tax from tax record
- −$88 /mo · $1,059/yr
- Insurance
- −$92
- HOA
- −$0
- Vacancy / Maint / Mgmt
- −$514
- Net cashflow
- $599
Break-even live
UW: 25.0% down · 7.5% · 30yr · 1.5% tax · 5.0% vac · 8.0% maint · 8.0% mgmt
Financing live
Cash to close
- Down payment
- $55,000
- Closing costs
- $6,600
- Reserves months
- —
- Total cash needed
- —
Loan-product check · same deal, 3 products live
Conventional
25% down · 7.5% · 30yr
- Down + closing
- —
- Monthly P&I
- —
- Monthly cashflow
- —
- DSCR
- —
- Eligible?
- —
Personal DTI + credit; lowest rate.
DSCR
20% down · 8.5% · 30yr
- Down + closing
- —
- Monthly P&I
- —
- Monthly cashflow
- —
- DSCR
- —
- Eligible?
- —
No personal income docs; deal must DSCR.
Hard money
10% down · 12.0% · 12mo
- Down + closing
- —
- Monthly P&I
- —
- Monthly cashflow
- —
- DSCR
- —
- Eligible?
- —
Short-term bridge; refi at stabilization.
Rent comps 1 comps
| Address | Beds | Baths | Sqft | Rent | $/sqft | DOM | Units | Dist |
|---|---|---|---|---|---|---|---|---|
| 308 Prism Ave SW Rio Rancho, NM | 4.0 | 2.0 | 1504 | $2,395 | $1.59 | 2d | 1 | 0.20mi |
Listing history 5 events
-
2026-05-05status Pending 431-char remark
Show marketing remark (431 chars)
Wonderful opportunity sitting on approximately 0.87 acres in Rio Rancho! This property features an open layout and a functional floor plan ready for renovation. Most of the popcorn ceiling and some flooring have been removed, giving a head start on the remodel. The home includes a metal roof and multiple outbuildings, providing additional storage or workspace. Ideal for investors or buyers looking to bring their vision to life.
-
2026-04-30status Active 431-char remark
Show marketing remark (431 chars)
Wonderful opportunity sitting on approximately 0.87 acres in Rio Rancho! This property features an open layout and a functional floor plan ready for renovation. Most of the popcorn ceiling and some flooring have been removed, giving a head start on the remodel. The home includes a metal roof and multiple outbuildings, providing additional storage or workspace. Ideal for investors or buyers looking to bring their vision to life.
-
2026-04-07status Pending 431-char remark
Show marketing remark (431 chars)
Wonderful opportunity sitting on approximately 0.87 acres in Rio Rancho! This property features an open layout and a functional floor plan ready for renovation. Most of the popcorn ceiling and some flooring have been removed, giving a head start on the remodel. The home includes a metal roof and multiple outbuildings, providing additional storage or workspace. Ideal for investors or buyers looking to bring their vision to life.
-
2026-03-26$220,000 Active 431-char remark
Show marketing remark (431 chars)
Wonderful opportunity sitting on approximately 0.87 acres in Rio Rancho! This property features an open layout and a functional floor plan ready for renovation. Most of the popcorn ceiling and some flooring have been removed, giving a head start on the remodel. The home includes a metal roof and multiple outbuildings, providing additional storage or workspace. Ideal for investors or buyers looking to bring their vision to life.
-
2015-09-28soldstatus
ⓘ Source: listings_history table (triggers on properties + properties_extension) + one-shot
backfill from property_details.listing_events for pre-trigger history.
Tax reassessment forecast NM · Resets to sale price
- Current annual tax
- $1,059 · $88/mo
- Projected year-2 tax
- $1,760 · $147/mo
- Expected delta
- +$701/yr (+$58/mo · 66.1%)
ⓘ Screening estimate from a state-policy table — verify with the county assessor before closing.
Climate risk First Street
- Flood 4/10 Moderate FEMA zone X (unshaded) · 22% chance over 30 yrs
- Wildfire 3/10 Moderate
- Heat 4/10 Moderate 7 d/yr ≥94°F today · 19 d/yr by 30 yrs out
- Wind 1/10 Low
- Air quality 1/10 Low 0 unhealthy d/yr today · 0 by 30 yrs out
Nearby sold comps map
Loading sold comps map…
Walkable amenities ~0.75 mi
Loading nearby amenities…
Taxation est. · year 1
- Rental income
- $29,360
- − Mortgage interest
- −$12,323
- − Property taxes
- −$1,059
- − Insurance
- −$1,100
- − Repairs & maintenance
- −$2,349
- − Management
- −$2,349
- − Depreciation
- −$6,400
- Taxable income
- $3,779
- Est. tax owed @ 24.0%
- −$907
- After-tax cash flow
- $6,283/yr
For passive investors: Depreciation is non-cash, so a rental often shows a tax loss while cash-flowing — sheltering income. Rental losses are passive: they offset passive income freely, and up to $25,000/yr can offset ordinary (W-2) income if you actively participate and your MAGI is under $100k (phasing out to $0 by $150k); unused losses carry forward. On sale, claimed depreciation is recaptured at up to 25%, and gains may owe capital-gains tax (a 1031 exchange can defer both). Figures are a year-1 estimate at your 24.0% rate — not tax advice; consult a CPA.
Schools (NCES district)
- District
- Rio Rancho Public Schools
- NCES district ID
- 3500010
- Math proficiency
- 48% ▲ 38.00%
- Reading proficiency
- 73% ▲ 48.00%
- Median HH income
- $59,410
- Composite
- 52.29/100
- National rank
- #1595
- State rank
- #4 of 29 in NM
Livability — Rio Rancho
- Score
- 71/100
- State rank
- #17
- US rank
- #7253
Category grades
Schools grade is shown separately in the Schools card above.
Census & demographics
- County
- Sandoval County · 110,336 people
- City population
- 110,336
- Metro
- Albuquerque, NM
- Population (ZIP)
- 58,499
- Household income
- $86,555
- Rent vs Own
- Severe rent burden
- 1027.0
Population outlook (Sandoval County) Hauer SSP2
- Today (2025)
- 155,072 people
- By 2030
- 161,714 · +4.3%
- By 2040
- 171,831 · +10.8%
- By 2050
- 178,536 · +15.1%
- By 2075
- 192,517 · +24.1%
- By 2100
- 197,952 · +27.7%
Race, ethnicity, and origin ACS 2023
- Neighborhood character
- Diverse neighborhood (Simpson 0.61)
- Race & ethnicity
- White 47% Hispanic / Latino 41% Two or more races 18% Native American 5% Black 3% Asian 2%
- Hispanic origin (detail)
- Mexican 24% Puerto Rican 2%
- Common ancestry
- Lithuanian 3% Slovak 2% Italian 2%
- Foreign-born
- 6% · Canada, Vietnam, China
- Languages at home
- 84% English-only · Spanish 12% Vietnamese 1%
Political lean MEDSL · Sandoval
- 2024 margin
- Lean D (+5.8) · D 51.8% · R 46.0% · Other 2.2%
- 2008→2024 swing
- -7.0pp toward R · 2008: 12.8pp · 2024: 5.8pp
- All cycles
- 2024: D+5.8 2020: D+8.4 2016: D+2.7 2012: D+5.1 2008: D+12.8
Not yet ingested
- Civics
- —
Market trends
- HPI YoY
- ▼ -303.50%
- Current HPI
- 219.8377
- Rent YoY
- ▲ 3.13%
- Metro
- Albuquerque, NM
- State GDP YoY
- —
- F500 in state
- 0
Price history
5 events — show timeline
- 2026-05-05 Pending — Southwest MLS
- 2026-04-30 Relisted — Southwest MLS
- 2026-04-07 Pending — Southwest MLS
- 2026-03-26 Listed $220,000 Southwest MLS
- 2015-09-28 Sold (Public Records) — Public Records
Property tax history
+2.6%/yrLatest (2024): $1,059 · +3.3% YoY. Source: county tax records.
Cash-flow waterfall
monthlySold comps — $/sqft
last 12 mo · ≤1 miLoading sold comps…