 Multi-family
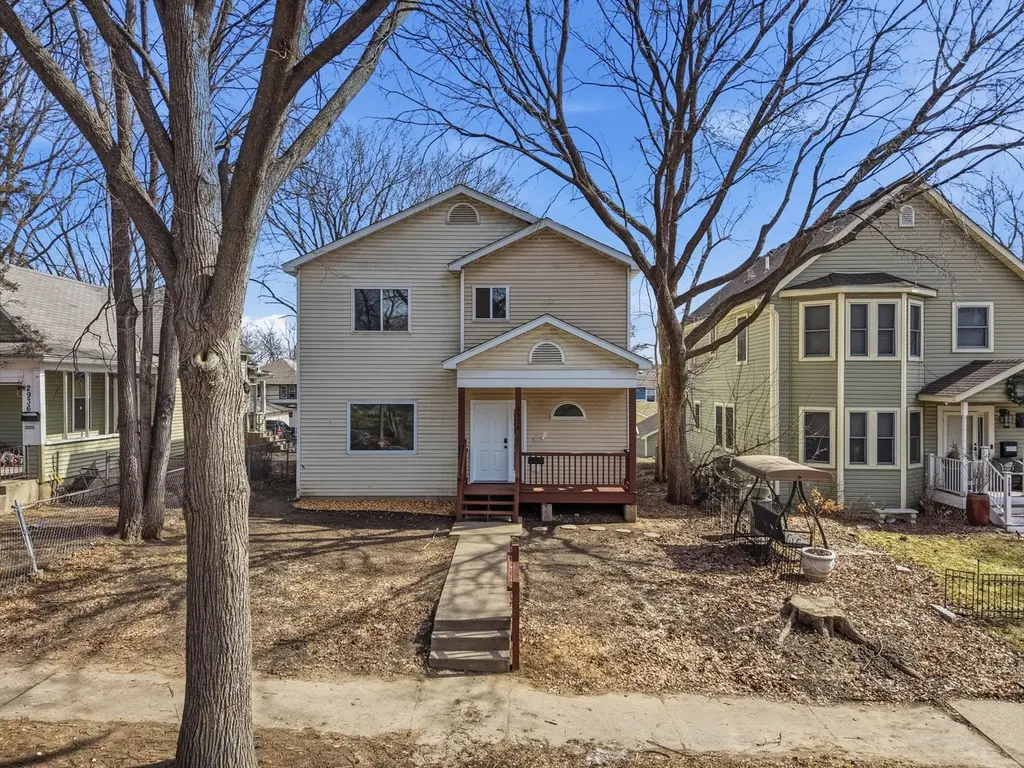
2934 Aldrich Ave N · Minneapolis, MN
Flood risk 1/10 · Minimal
- FEMA flood zone
- X (unshaded)
- Chance of flooding over 30 yrs
- 0.0%
- Est. flood insurance / yr
- $507 – $1,088
Fire risk 1/10 · Minimal
- Est. fire insurance / yr
- $888 – $1,650
Heat risk 2/10 · Minimal
- Hot days now (above 99°F)
- 7 days/yr
- Hot days in 30 yrs
- 14 days/yr
Wind risk 2/10 · Minimal
- Chance of severe wind over 30 yrs
- —
Air-quality risk 2/10 · Minimal
- Unhealthy air days now
- 1 days/yr
- Unhealthy air days in 30 yrs
- 1 days/yr
Risk factors via First Street. Map © Google.
Why this score? — see what drove the B- grade
The composite is a weighted blend of 9 inputs, each scored 0–100. Each bar is that input's sub-score; the figure is the points it added to the 100-point composite (weight × sub-score).
- Cash flow +30.0/30.0
- DSCR +10.0/10.0
- 1% rule +8.1/10.0
- ARV discount +7.5/15.0
- Rent growth +4.3/5.0
- Livability +3.9/5.0
- Schools +3.5/10.0
- Condition / age +2.5/5.0
- Appreciation +0.0/10.0
$264,900
🖨 Deal sheet (PDF) 📄 Offer letter ✓ Due diligence
Multi-family units
County records classify this as Multi-Family (5+ Unit). Listing-text estimate: 1 unit. estimate disagrees with records
5+ unit building — per-unit beds/baths from public records are typically unavailable; the breakdown below (if shown) is an estimate from the listing text.
Listing remarks MLS
6 BEDROOMS! SECT 8 APPROVED GREAT RENTAL OPPORTUNITY. CORPORATE OWNED & SOLD AS-IS. PRE-QUAL LETTER TO ACCOMPANY OFFER. A SPECIAL ADDENDUM TO BE PART OF FINAL CONTRACT. SELLER RESERVES THE RIGHT TO NEGOTIATE REGARDLESS OF SUBMISSION DATE/TIME.
Key facts
- 4,791 sq ft lot
- Built 2002
- Listed 31 days
Property features AI
Exterior
- Parking: On-street parking only
- Utilities: City water connected; City sewer connected; Electric fuel
- Home design: Residential property; Two levels
- Construction: Asphalt roof; Foundation area approximately 938 (unit not specified)
- Exterior features: Lot approximately 0.11 acres (dimensions 40 x 124)
Interior
- Kitchen: Range; Microwave; Refrigerator; Stainless steel appliances
- Bedrooms: 6 bedrooms total; Upper-level bedrooms: four bedrooms located on the upper level (dimensions include 13x10, 13x10, 11x10, 10x10); Main-level bedrooms: one bedroom on the main level (11x10) and one additional bedroom-sized room listed as Bedroom 5 (10x10) on the upper level
- Bathrooms: 2 full bathrooms (one on the main floor, one on the upper level)
- Heating & cooling: Baseboard heating; No central air / no cooling
- Interior features: Separate/formal dining room; Crawl space basement
- Laundry & utility: Washer; Dryer
Neighborhood map
What this means for you Summary
Snapshot
- This is a 6-bed/2.0-bath multifamily listed at $265k.
Deal economics
- At list price, monthly cash flow is $1k ($14k/yr) — positive.
- The deal already cash-flows at list — no discount required.
- Meets the 1% rule at list price ($3k rent vs $265k).
- Recommended offer: $257k (3.0% below list) — sets the bar for market timing.
- Cap rate 11.7% vs local median 3.1% in Minneapolis — top-decile yield for the area; either an underpriced asset or a hidden risk that comps aren't pricing in. Stress-test before assuming the spread holds.
Location & tenants
- Location reads 78/100 on livability (#110 in MN, #2,525 nationally) — a middle-class / working-renter tenant base. Strengths: amenities A+, commute A+, housing A+; Watch: cost of living C-, crime F.
- Minneapolis Public School District (urban): math 35% / reading 46% proficiency, ranked #217 of 301 in MN (top 72%) — families likely to look elsewhere, expect single-tenant / working-renter base with shorter leases.
- Zoned schools: Nellie Stone Johnson Elementary (math 2% / reading 17%, grade F, #829 of 857 statewide, top 98%, 201 students, 96% FRL); Franklin Middle (math 2% / reading 8%, grade F, #255 of 258 statewide, top 100%, 287 students, 89% FRL); Henry High (reading 70%, 858 students, 80% FRL) — zoned schools average 88% FRL vs 58% district-wide (30 pts higher); higher-poverty schools than district average — tighter screening recommended.
- Zoned-school proficiency averages 7% at this address vs 40% district-wide (-33 pts) — the specific schools serving this property underperform the Minneapolis Public School District average; the district grade overstates school quality for this exact location.
- Market conditions: Rents rising fast (+7.3%/yr); 133 active listings in the ZIP; 12 comparable units currently listed for rent nearby; rentals at typical pace (median 26d on market — plan ~3-4 weeks tenant-placement turnaround); 42% of comp listings sitting > 30 days — soft ceiling on asking rent; 4,651 units permitted in Hennepin County in 2024 (2,443 in 5+ unit buildings).
- At $3,468/mo this rent would consume 69% of the median local household income ($60k/yr) (locally 1826% of renters already pay >50% of income on rent) — very limited rent-growth headroom before tenants either downsize or default.
Forward outlook
- Local home prices are declining (-3.0%/yr); year-one equity from $2k of loan paydown is wiped out by about $8k of value loss. Plan a longer hold.
- Hennepin County population projected at +30% by 2050 — long-run rental-demand tailwind backs the buy-and-hold thesis.
- At projected returns (-3.0% appreciation + 7.3% rent growth), your $74k cash investment doubles in ~6 years — after that, you're playing with house money.
Negotiation context
- It's been on market 31 days — a 3% lower offer ($257k) is reasonable based on typical stale-listing flexibility.
- 6 sale attempts since 22y ago with the ask held roughly flat each time — persistent listings suggest the price (not the market) is what's stuck; bring a comps-based counter.
- Current owner paid $170k; list at $265k implies a 56% gain — meaningful room to come down on a strong offer.
Questions for the listing agent
- It's been on market 31 days. Have you received any prior offers? Is the seller open to a 3% concession, seller financing, or rate buy-down credit?
- Is there a deadline driving the sale (1031 exchange, divorce, estate, relocation)? That informs how much negotiation room exists.
- Crime grade is F in this area — have there been break-ins, vandalism, or insurance claims at this property in the last 3 years? What carrier currently insures it and at what premium?
- What's the average days-on-market for RENTAL listings here right now (not sales)? A rising rental-DOM trend means longer vacancies and softer asking-rent achievability than the comps imply.
- What's the recent tenant-quality profile in this submarket — average credit score on applications, eviction rate, late-payment / NSF rate, and stable-employment percentage? A property-management company in the area should have these aggregated.
- How much new apartment / multifamily construction is in the pipeline within 1–3 miles? Heavy new supply (>2% of stock underway) typically softens rents 12–24 months out; light construction supports rent growth.
Investment metrics
- 1% rule
- 1.31% ✓
- Cap rate
- 11.66%
- Cash-on-cash
- 19.16%
- DSCR
- 1.85
- GRM
- 6.4
CMA / ARV
No comps found within radius.
Projected returns pro-forma
-3.0% appreciation · 7.35% rent growth · sell at horizon
- IRR
- 15.4%
- Equity multiple
- 1.65×
- Total profit
- $48,214
- Equity at exit
- $39,497
- IRR
- 26.9%
- Equity multiple
- 3.83×
- Total profit
- $209,743
- Equity at exit
- $22,904
Cash invested: $74,172 (down + closing). Projections, not guarantees.
Landlord ↔ Tenant lean methodology
- Overall (CITY)
- 34 Tenant-Leaning
- State Minnesota
- 46 Balanced · D+2
- County
- — inherits STATE
- City Minneapolis
- 34 Tenant-Leaning · D+50
ZIP-level market 55411
- Home prices YoY
- -8.7%
- Rents YoY
- 7.3%
- Active inventory
- 133
- Price-to-rent
- 12.7×
Monthly cashflow live
- Estimated rent
- $3,468 high interval (Pro) →
- Mortgage (P&I)
- −$1,389
- Tax from tax record
- −$56 /mo · $674/yr
- Insurance
- −$110
- HOA
- −$0
- Vacancy / Maint / Mgmt
- −$728
- Net cashflow
- $1,184
Break-even live
Sensitivity live
| Price | -10% $1,334 | -5% $1,259 | +0% $1,184 | +5% $1,109 | +10% $1,034 |
|---|---|---|---|---|---|
| Rent | -10% $910 | -5% $1,047 | +0% $1,184 | +5% $1,321 | +10% $1,458 |
| Rate | -1.0pp $1,317 | -0.5pp $1,251 | base $1,184 | +0.5pp $1,115 | +1.0pp $1,046 |
2-unit breakdown (identical units grouped — click to expand)
| Units | Beds | Baths | Est. rent |
|---|---|---|---|
| 2× units | 3 | 1 | $3,468 |
| #1 | 3 | 1 | $1,734 |
| #2 | 3 | 1 | $1,734 |
| Total (2 units) | $3,468 | ||
UW: 25.0% down · 7.5% · 30yr · 1.5% tax · 5.0% vac · 8.0% maint · 8.0% mgmt
Financing live
Cash to close
- Down payment
- $66,225
- Closing costs
- $7,947
- Reserves months
- —
- Total cash needed
- —
Loan-product check · same deal, 3 products live
Conventional
25% down · 7.5% · 30yr
- Down + closing
- —
- Monthly P&I
- —
- Monthly cashflow
- —
- DSCR
- —
- Eligible?
- —
Personal DTI + credit; lowest rate.
DSCR
20% down · 8.5% · 30yr
- Down + closing
- —
- Monthly P&I
- —
- Monthly cashflow
- —
- DSCR
- —
- Eligible?
- —
No personal income docs; deal must DSCR.
Hard money
10% down · 12.0% · 12mo
- Down + closing
- —
- Monthly P&I
- —
- Monthly cashflow
- —
- DSCR
- —
- Eligible?
- —
Short-term bridge; refi at stabilization.
Rent comps 12 comps
| Address | Beds | Baths | Sqft | Rent | $/sqft | DOM | Units | Dist |
|---|---|---|---|---|---|---|---|---|
| 3247 N 6th St Minneapolis, MN | 5.0 | 1.5 | 1405 | $2,350 | $1.67 | 26d | 1 | 0.27mi |
| 3247 N 6th St Minneapolis, MN | 5.0 | 1.5 | 1405 | $2,350 | $1.67 | 45d | 1 | 0.27mi |
| 3247 N 6th St Minneapolis, MN | 5.0 | 1.5 | 1405 | $2,350 | $1.67 | 23d | 1 | 0.27mi |
| 2923 Girard Ave N Minneapolis, MN | 5.0 | 2.0 | 1760 | $2,795 | $1.59 | 23d | 1 | 0.40mi |
| 2819 Girard Ave N Minneapolis, MN | 5.0 | 2.0 | 1718 | $2,300 | $1.34 | 45d | 1 | 0.42mi |
| 3238 Humboldt Ave N Minneapolis, MN | 5.0 | 1.0 | 1389 | $2,100 | $1.51 | 45d | 1 | 0.50mi |
| 1113 N 25th Ave Minneapolis, MN | 5.0 | 2.0 | 2295 | $2,695 | $1.17 | 19d | 1 | 0.52mi |
| 2623 Humboldt Ave N Minneapolis, MN | 6.0 | 2.0 | 1900 | $2,795 | $1.47 | 18d | 1 | 0.55mi |
| 3522 Bryant Ave N Minneapolis, MN | 5.0 | 2.0 | 1449 | $2,995 | $2.07 | 45d | 1 | 0.58mi |
| 2110 Lyndale Ave N Minneapolis, MN | 6.0 | 1.5 | 1320 | $2,695 | $2.04 | 1d | 1 | 0.72mi |
| 1414 Golden Valley Rd Unit 2 Minneapolis, MN | 5.0 | 2.0 | 2000 | $2,595 | $1.30 | 45d | 1 | 0.96mi |
| 1625 Marshall St NE Minneapolis, MN | 5.0 | 3.0 | 1900 | $3,495 | $1.84 | 23d | 1 | 0.98mi |
Listing history 19 events
-
2026-04-26status Pending
-
2026-04-10price $264,900
-
2026-03-26$269,900 Active
-
2026-03-23historical $269,900
-
2025-12-16soldstatus $170,000
-
2008-08-06soldstatus $49,350 247-char remark
Show marketing remark (247 chars)
6 BEDROOMS! SECT 8 APPROVED GREAT RENTAL OPPORTUNITY. CORPORATE OWNED & SOLD AS-IS. PRE-QUAL LETTER TO ACCOMPANY OFFER. A SPECIAL ADDENDUM TO BE PART OF FINAL CONTRACT. SELLER RESERVES THE RIGHT TO NEGOTIATE REGARDLESS OF SUBMISSION DATE/TIME.
-
2008-08-04historical 247-char remark
Show marketing remark (247 chars)
6 BEDROOMS! SECT 8 APPROVED GREAT RENTAL OPPORTUNITY. CORPORATE OWNED & SOLD AS-IS. PRE-QUAL LETTER TO ACCOMPANY OFFER. A SPECIAL ADDENDUM TO BE PART OF FINAL CONTRACT. SELLER RESERVES THE RIGHT TO NEGOTIATE REGARDLESS OF SUBMISSION DATE/TIME.
-
2008-08-04$60,000 247-char remark
Show marketing remark (247 chars)
6 BEDROOMS! SECT 8 APPROVED GREAT RENTAL OPPORTUNITY. CORPORATE OWNED & SOLD AS-IS. PRE-QUAL LETTER TO ACCOMPANY OFFER. A SPECIAL ADDENDUM TO BE PART OF FINAL CONTRACT. SELLER RESERVES THE RIGHT TO NEGOTIATE REGARDLESS OF SUBMISSION DATE/TIME.
-
2008-06-13historical
-
2007-12-26$60,000
-
2007-12-23historical
-
2007-10-16$122,900
-
2007-10-15historical
-
2007-02-16$126,500
-
2006-04-19soldstatus $300,000
-
2005-03-01soldstatus $293,000
-
2004-12-28historical
-
2004-02-03$274,900
-
2002-07-15soldstatus $66,000
ⓘ Source: listings_history table (triggers on properties + properties_extension) + one-shot
backfill from property_details.listing_events for pre-trigger history.
Tax reassessment forecast MN · Partial reset (capped growth)
- Current annual tax
- $674 · $56/mo
- Projected year-2 tax
- $1,820 · $152/mo
- Expected delta
- +$1,147/yr (+$96/mo · 170.2%)
ⓘ Screening estimate from a state-policy table — verify with the county assessor before closing.
Climate risk First Street
- Flood 1/10 Low FEMA zone X (unshaded) · 0% chance over 30 yrs
- Wildfire 1/10 Low
- Heat 2/10 Low 7 d/yr ≥99°F today · 14 d/yr by 30 yrs out
- Wind 2/10 Low
- Air quality 2/10 Low 1 unhealthy d/yr today · 1 by 30 yrs out
Nearby sold comps map
Loading sold comps map…
Walkable amenities ~0.75 mi
Loading nearby amenities…
Taxation est. · year 1
- Rental income
- $41,616
- − Mortgage interest
- −$14,839
- − Property taxes
- −$674
- − Insurance
- −$1,324
- − Repairs & maintenance
- −$3,329
- − Management
- −$3,329
- − Depreciation
- −$7,706
- Taxable income
- $10,415
- Est. tax owed @ 24.0%
- −$2,500
- After-tax cash flow
- $11,709/yr
For passive investors: Depreciation is non-cash, so a rental often shows a tax loss while cash-flowing — sheltering income. Rental losses are passive: they offset passive income freely, and up to $25,000/yr can offset ordinary (W-2) income if you actively participate and your MAGI is under $100k (phasing out to $0 by $150k); unused losses carry forward. On sale, claimed depreciation is recaptured at up to 25%, and gains may owe capital-gains tax (a 1031 exchange can defer both). Figures are a year-1 estimate at your 24.0% rate — not tax advice; consult a CPA.
Schools (NCES district)
- District
- Minneapolis Public School District
- NCES district ID
- 2721240
- Math proficiency
- 35% ▼ -7.00%
- Reading proficiency
- 46% ▼ -1.00%
- Median HH income
- $50,521
- Composite
- 34.92/100
- National rank
- #5067
- State rank
- #217 of 301 in MN
Livability — Minneapolis
- Score
- 78/100
- State rank
- #110
- US rank
- #2525
Category grades
Schools grade is shown separately in the Schools card above.
Census & demographics
- Census place
- Minneapolis, MN
- County
- Hennepin County · 1,150,272 people
- City population
- 417,555
- Metro
- Minneapolis-St. Paul-Bloomington, MN-WI
- Population (ZIP)
- 27,741
- Household income
- $60,225
- Rent vs Own
- Severe rent burden
- 1826.0
Population outlook (Hennepin County) Hauer SSP2
- Today (2025)
- 1,405,227 people
- By 2030
- 1,492,650 · +6.2%
- By 2040
- 1,660,157 · +18.1%
- By 2050
- 1,823,498 · +29.8%
- By 2075
- 2,221,283 · +58.1%
- By 2100
- 2,509,976 · +78.6%
Race, ethnicity, and origin ACS 2023
- Neighborhood character
- Diverse neighborhood (Simpson 0.68)
- Race & ethnicity
- Black 49% White 23% Two or more races 11% Hispanic / Latino 11% Asian 9%
- Hispanic origin (detail)
- Mexican 7% Puerto Rican 1%
- Common ancestry
- Portuguese 3% Lithuanian 2% Italian 1%
- Foreign-born
- 19% · Canada, Guatemala
- Languages at home
- 68% English-only · Other Asian/Pacific 8% Spanish 8%
Political lean MEDSL · Hennepin
- 2024 margin
- Solid D (+42.6) · D 70.2% · R 27.5% · Other 2.3%
- 2008→2024 swing
- +14.0pp toward D · 2008: 28.6pp · 2024: 42.6pp
- All cycles
- 2024: D+42.6 2020: D+43.2 2016: D+35.3 2012: D+27.1 2008: D+28.6
Not yet ingested
- Civics
- —
Market trends
- HPI YoY
- ▼ -33.91%
- Current HPI
- 356.6758
- Rent YoY
- ▲ 7.35%
- Metro
- Minneapolis-St. Paul-Bloomington, MN-WI
- State GDP YoY
- ▲ 2.41%
- F500 in state
- 34
Industry mix (Fortune 500 HQ in MN)
| Industry | F500 HQs | Revenue |
|---|---|---|
| Healthcare | 2 | $407B |
|
||
| Retail | 2 | $150B |
|
||
| Consumer Goods | 2 | $32B |
|
||
| Industrial Machinery | 2 | $6B |
|
||
| Agriculture | 1 | $40B |
|
||
| Healthcare / Medical Devices | 1 | $32B |
|
||
Price history
+301.4% since first listed19 events — show timeline
- 2026-04-26 Pending — NORTHSTARMLS as Distributed by MLS Grid
- 2026-04-10 Price Changed $264,900 NORTHSTARMLS as Distributed by MLS Grid
- 2026-03-26 Listed $269,900 NORTHSTARMLS as Distributed by MLS Grid
- 2026-03-23 Coming Soon $269,900 NORTHSTARMLS as Distributed by MLS Grid
- 2025-12-16 Sold (Public Records) $170,000 Public Records
- 2008-08-06 Sold (MLS) $49,350 NORTHSTARMLS as Distributed by MLS Grid
- 2008-08-04 Listed $60,000 NORTHSTARMLS as Distributed by MLS Grid
- 2008-08-04 Listing Removed — NORTHSTARMLS as Distributed by MLS Grid
- 2008-06-13 Listing Removed — NORTHSTARMLS as Distributed by MLS Grid
- 2007-12-26 Listed $60,000 NORTHSTARMLS as Distributed by MLS Grid
- 2007-12-23 Listing Removed — NORTHSTARMLS as Distributed by MLS Grid
- 2007-10-16 Listed $122,900 NORTHSTARMLS as Distributed by MLS Grid
- 2007-10-15 Listing Removed — NORTHSTARMLS as Distributed by MLS Grid
- 2007-02-16 Listed $126,500 NORTHSTARMLS as Distributed by MLS Grid
- 2006-04-19 Sold (Public Records) $300,000 Public Records
- 2005-03-01 Sold (Public Records) $293,000 Public Records
- 2004-12-28 Listing Removed — NORTHSTARMLS as Distributed by MLS Grid
- 2004-02-03 Listed $274,900 NORTHSTARMLS as Distributed by MLS Grid
- 2002-07-15 Sold (Public Records) $66,000 Public Records
Property tax history
-4.6%/yrLatest (2025): $674 · -45.3% YoY. Source: county tax records.
Cash-flow waterfall
monthlySold comps — $/sqft
last 12 mo · ≤1 miLoading sold comps…