7943 Forest Blvd Unit I · Woodbury, MN
Flood risk 1/10 · Minimal
- FEMA flood zone
- X (unshaded)
- Chance of flooding over 30 yrs
- 0.0%
- Est. flood insurance / yr
- $507 – $1,088
Fire risk 1/10 · Minimal
- Est. fire insurance / yr
- $888 – $1,650
Heat risk 2/10 · Minimal
- Hot days now (above 100°F)
- 7 days/yr
- Hot days in 30 yrs
- 14 days/yr
Wind risk 2/10 · Minimal
- Chance of severe wind over 30 yrs
- —
Air-quality risk 2/10 · Minimal
- Unhealthy air days now
- 1 days/yr
- Unhealthy air days in 30 yrs
- 1 days/yr
Risk factors via First Street. Map © Google.
Why this score? — see what drove the D- grade
The composite is a weighted blend of 9 inputs, each scored 0–100. Each bar is that input's sub-score; the figure is the points it added to the 100-point composite (weight × sub-score).
- Cash flow +9.3/30.0
- ARV discount +7.5/15.0
- Schools +5.2/10.0
- 1% rule +4.8/10.0
- Livability +4.5/5.0
- Rent growth +3.4/5.0
- DSCR +2.6/10.0
- Condition / age +2.5/5.0
- Appreciation +0.0/10.0
$225,000
🖨 Deal sheet (PDF) 📄 Offer letter ✓ Due diligence
Listing remarks MLS
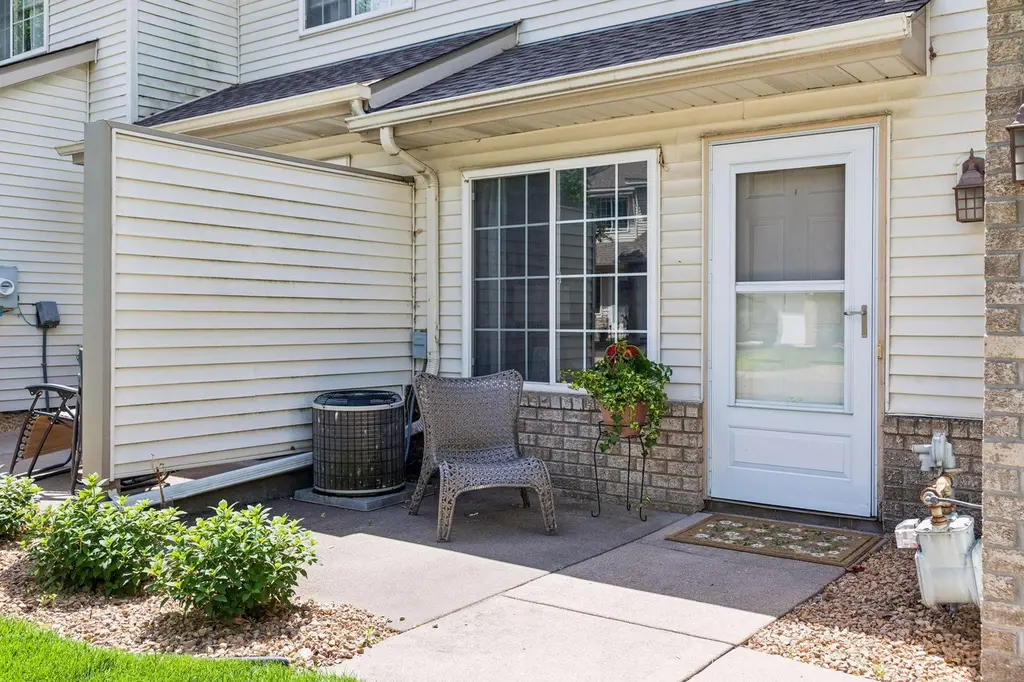
Move right in and enjoy this well cared for, 2-story townhome. Located on a dead-end street so limited traffic makes for a great outdoor space to relax. Spacious kitchen with lots of cabinets and counter space, with an eat in kitchen. Enjoy the cozy gas fireplace in the living room. New Roof-2023. Lots of storage. Ready for you to call this home. Location is convenient to Woodbury shopping, walking trails, and freeway access.
Key facts
- Cozy gas fireplace
- Walk-in closet
- Private patio
Tags
Property features AI
Finance
- HOA & community: HOA managed by Gassen Company, AAMC; Monthly HOA fee of $410; HOA covers hazard insurance, lawn care, grounds maintenance, parking, professional management, and snow removal
Exterior
- Parking: Attached garage with guest parking; Garage approximately 20x9 (1-car)
- Utilities: City water connected; City sewer connected; Natural gas; Electric service with circuit breakers (Xcel Energy)
- Home design: Residential attached property; Two levels
- Construction: Frame construction; Roof replaced within last 8 years; Slab foundation
- Exterior features: Patio; Stone and vinyl exterior; No fencing; City street with curbs on a private maintained, no-outlet/dead-end road
Interior
- Kitchen: Eat-in kitchen with breakfast bar and kitchen/dining area
- Bedrooms: Two bedrooms (upper level); Loft (upper level) — flexible space; Second-floor laundry
- Bathrooms: One full bathroom (upper level); One half bathroom (main floor)
- Heating & cooling: Forced air heating; Central air conditioning
- Interior features: Gas fireplace in the living room; Walk-in closet; No basement
- Laundry & utility: Laundry closet on the upper level
Neighborhood map
What this means for you Summary
Snapshot
- This is a 2-bed/1.5-bath townhouse listed at $225k.
Deal economics
- At list price, monthly cash flow is $-164 ($-2k/yr) — negative.
- To cash-flow at today's rent, offer at most $196k (12.9% below list).
- To meet the 1% rule (rent ≥ 1% of price), the offer needs to be $221k (1.7% below list).
- Recommended offer: $196k (12.9% below list) — sets the bar for cash-flow.
- Cap rate 5.4% vs local median 3.2% in Woodbury — top-decile yield for the area; either an underpriced asset or a hidden risk that comps aren't pricing in. Stress-test before assuming the spread holds.
Location & tenants
- Location reads 89/100 on livability (#6 in MN, #153 nationally) — a professional / high-income tenant draw. Strengths: crime A+, commute A+, employment A+; Watch: cost of living F.
- South Washington County School District (suburban): math 52% / reading 61% proficiency, ranked #40 of 301 in MN (top 13%) — acceptable for families but not a draw, mixed tenant base, ~2y average lease; only 14% free/reduced lunch — higher-income household profile.
- Zoned schools: Nuevas Fronteras Spanish Immersion (math 47% / reading 47%, grade D-, #492 of 857 statewide, top 61%, 499 students, 16% FRL); Woodbury Middle School (math 44% / reading 60%, grade C+, #63 of 258 statewide, top 25%, 1,108 students, 24% FRL); Woodbury High School (math 62% / reading 71%, grade B, #21 of 471 statewide, top 5%, 1,979 students, 21% FRL).
- Market conditions: Rents rising (+3.6%/yr); 149 active listings in the ZIP; 5 comparable units currently listed for rent nearby; rentals leasing fast (median 1d on market — plan ~1-2 weeks tenant-placement turnaround); high-income renter base; 1,405 units permitted in Washington County in 2024 (121 in 5+ unit buildings).
Forward outlook
- Local home prices are declining (-3.0%/yr); year-one equity from $2k of loan paydown is wiped out by about $7k of value loss. Plan a longer hold.
- Washington County population projected at +16% by 2050 — long-run rental-demand tailwind backs the buy-and-hold thesis.
Negotiation context
- Only 9 days on market — expect competitive offers; lowballing is unlikely to land.
- 7 sale attempts since 27y ago with the ask held roughly flat each time — persistent listings suggest the price (not the market) is what's stuck; bring a comps-based counter.
Questions for the listing agent
- What do current leases actually rent for vs. the listed asking? Can we see a recent rent roll and the last 12 months of T-12 income?
- What does the HOA fee cover, when was the last increase, and are there any pending special assessments or reserve-fund shortfalls?
- Is there a deadline driving the sale (1031 exchange, divorce, estate, relocation)? That informs how much negotiation room exists.
- Schools are A-rated — typically a magnet for longer-tenancy family renters. What's the average tenant stay here, and is there a school-zone premium baked into asking?
- The area grade is low — what's the realistic commute time and amenity access for the typical tenant pool here? Any planned neighborhood developments (good or bad) we should know about?
- What's the average days-on-market for RENTAL listings here right now (not sales)? A rising rental-DOM trend means longer vacancies and softer asking-rent achievability than the comps imply.
- What's the recent tenant-quality profile in this submarket — average credit score on applications, eviction rate, late-payment / NSF rate, and stable-employment percentage? A property-management company in the area should have these aggregated.
- How much new for-sale + rental construction is in the pipeline within 1–3 miles? Heavy new supply typically softens prices + rents 12–24 months out; constrained supply supports both.
Investment metrics
- 1% rule
- 0.98% ✗
- Cap rate
- 5.42%
- Cash-on-cash
- -3.12%
- DSCR
- 0.86
- GRM
- 8.5
CMA / ARV
No comps found within radius.
Projected returns pro-forma
-3.0% appreciation · 3.65% rent growth · sell at horizon
- IRR
- -20.5%
- Equity multiple
- 0.28×
- Total profit
- $-45,197
- Equity at exit
- $33,548
- IRR
- -11.7%
- Equity multiple
- 0.27×
- Total profit
- $-45,731
- Equity at exit
- $19,454
Cash invested: $63,000 (down + closing). Projections, not guarantees.
Landlord ↔ Tenant lean methodology
- Overall (STATE)
- 46 Balanced
- State Minnesota
- 46 Balanced · D+2
- County
- — inherits STATE
- City
- — inherits STATE
ZIP-level market 55125
- Rents YoY
- 3.6%
- Active inventory
- 149
- Price-to-rent
- 8.5×
Monthly cashflow live
- Estimated rent
- $2,211 high interval (Pro) →
- Mortgage (P&I)
- −$1,180
- Tax from tax record
- −$227 /mo · $2,722/yr
- Insurance
- −$94
- HOA
- −$410
- Vacancy / Maint / Mgmt
- −$464
- Net cashflow
- $-164
Break-even live
Sensitivity live
| Price | -10% $-37 | -5% $-100 | +0% $-164 | +5% $-228 | +10% $-291 |
|---|---|---|---|---|---|
| Rent | -10% $-339 | -5% $-251 | +0% $-164 | +5% $-77 | +10% $11 |
| Rate | -1.0pp $-51 | -0.5pp $-107 | base $-164 | +0.5pp $-222 | +1.0pp $-282 |
UW: 25.0% down · 7.5% · 30yr · 1.5% tax · 5.0% vac · 8.0% maint · 8.0% mgmt
Financing live
Cash to close
- Down payment
- $56,250
- Closing costs
- $6,750
- Reserves months
- —
- Total cash needed
- —
Loan-product check · same deal, 3 products live
Conventional
25% down · 7.5% · 30yr
- Down + closing
- —
- Monthly P&I
- —
- Monthly cashflow
- —
- DSCR
- —
- Eligible?
- —
Personal DTI + credit; lowest rate.
DSCR
20% down · 8.5% · 30yr
- Down + closing
- —
- Monthly P&I
- —
- Monthly cashflow
- —
- DSCR
- —
- Eligible?
- —
No personal income docs; deal must DSCR.
Hard money
10% down · 12.0% · 12mo
- Down + closing
- —
- Monthly P&I
- —
- Monthly cashflow
- —
- DSCR
- —
- Eligible?
- —
Short-term bridge; refi at stabilization.
Rent comps 5 comps
| Address | Beds | Baths | Sqft | Rent | $/sqft | DOM | Units | Dist |
|---|---|---|---|---|---|---|---|---|
| 8632 Savanna Oaks Bay Unit C Saint Paul, MN | 3.0 | 2.0 | 1300 | $2,500 | $1.92 | 0d | 1 | 0.67mi |
| 2150 Vining Dr Saint Paul, MN | 1.0–3.0 | 1.0–2.5 | 1337 | $2,425 | $1.81 | 0d | 24 | 1.15mi |
| 2497 Copper Cliff Trl Saint Paul, MN | 3.0 | 1.0 | 1150 | $2,095 | $1.82 | 26d | 1 | 1.25mi |
| 4151 Benjamin Dr Saint Paul, MN | 3.0 | 1.0–2.0 | 1073 | $2,718 | $2.53 | 0d | 37 | 1.25mi |
| 2549 Cornelia Trl Saint Paul, MN | 2.0 | 1.5–2.0 | 1240 | $1,788 | $1.44 | 1d | 2 | 1.41mi |
HOA detail
- Monthly dues
- $410 · $4,920/yr
- Likely covers
- gas
Listing history 7 events
-
2026-06-21days on market $225,000 Active 9 DOM
-
2026-06-18days on market $225,000 Active 6 DOM
-
2026-06-17days on market $225,000 Active 5 DOM
-
2026-06-16days on market $225,000 Active 4 DOM
-
2026-06-15days on market $225,000 Active 3 DOM
-
2026-06-13remarks 699-char remark
-
2026-06-13$225,000 Active 1 DOM
ⓘ Source: listings_history table (triggers on properties + properties_extension) + one-shot
backfill from property_details.listing_events for pre-trigger history.
Tax reassessment forecast MN · Partial reset (capped growth)
- Current annual tax
- $2,722 · $227/mo
- Projected year-2 tax
- $2,722 · $227/mo
- Expected delta
- $0/yr ($0/mo · 0.0%)
ⓘ Screening estimate from a state-policy table — verify with the county assessor before closing.
Climate risk First Street
- Flood 1/10 Low FEMA zone X (unshaded) · 0% chance over 30 yrs
- Wildfire 1/10 Low
- Heat 2/10 Low 7 d/yr ≥100°F today · 14 d/yr by 30 yrs out
- Wind 2/10 Low
- Air quality 2/10 Low 1 unhealthy d/yr today · 1 by 30 yrs out
Nearby sold comps map
Loading sold comps map…
Walkable amenities ~0.75 mi
Loading nearby amenities…
Taxation est. · year 1
- Rental income
- $26,529
- − Mortgage interest
- −$12,603
- − Property taxes
- −$2,722
- − Insurance
- −$1,125
- − Repairs & maintenance
- −$2,122
- − Management
- −$2,122
- − HOA
- −$4,920
- − Depreciation
- −$6,545
- Taxable loss
- −$5,631
- Est. tax savings @ 24.0%
- +$1,351
- After-tax cash flow
- $-616/yr
For passive investors: Depreciation is non-cash, so a rental often shows a tax loss while cash-flowing — sheltering income. Rental losses are passive: they offset passive income freely, and up to $25,000/yr can offset ordinary (W-2) income if you actively participate and your MAGI is under $100k (phasing out to $0 by $150k); unused losses carry forward. On sale, claimed depreciation is recaptured at up to 25%, and gains may owe capital-gains tax (a 1031 exchange can defer both). Figures are a year-1 estimate at your 24.0% rate — not tax advice; consult a CPA.
Schools (NCES district)
- District
- South Washington County School District
- NCES district ID
- 2733810
- Math proficiency
- 52% ▼ -13.00%
- Reading proficiency
- 61% ▼ -7.00%
- Median HH income
- $88,285
- Composite
- 51.8/100
- National rank
- #1670
- State rank
- #40 of 301 in MN
Livability — Woodbury
- Score
- 89/100
- State rank
- #6
- US rank
- #153
Category grades
Schools grade is shown separately in the Schools card above.
Census & demographics
- Census place
- Woodbury, MN
- County
- Washington County · 235,613 people
- City population
- 78,305
- Metro
- Minneapolis-St. Paul-Bloomington, MN-WI
- Population (ZIP)
- 44,185
- Household income
- $119,260
- Rent vs Own
- Severe rent burden
- 946.0
Population outlook (Washington County) Hauer SSP2
- Today (2025)
- 278,554 people
- By 2030
- 290,465 · +4.3%
- By 2040
- 310,014 · +11.3%
- By 2050
- 324,118 · +16.4%
- By 2075
- 362,697 · +30.2%
- By 2100
- 381,491 · +37.0%
Race, ethnicity, and origin ACS 2023
- Neighborhood character
- Predominantly White (76%)
- Race & ethnicity
- White 76% Asian 9% Hispanic / Latino 6% Black 6% Two or more races 5%
- Hispanic origin (detail)
- Mexican 4%
- Common ancestry
- Portuguese 11% Romanian 5% Lithuanian 4%
- Foreign-born
- 11% · Canada, China, South Korea
- Languages at home
- 86% English-only · Spanish 5% Other Asian/Pacific 4% Chinese 1%
Political lean MEDSL · Washington
- 2024 margin
- Lean D (+8.9) · D 53.5% · R 44.6% · Other 1.9%
- 2008→2024 swing
- +4.6pp toward D · 2008: 4.3pp · 2024: 8.9pp
- All cycles
- 2024: D+8.9 2020: D+9.2 2016: D+1.9 2012: D+0.8 2008: D+4.3
Not yet ingested
- Civics
- —
Market trends
- HPI YoY
- ▼ -166.03%
- Current HPI
- 241.9098
- Rent YoY
- ▲ 3.65%
- Metro
- Minneapolis-St. Paul-Bloomington, MN-WI
- State GDP YoY
- ▲ 2.41%
- F500 in state
- 34
Industry mix (Fortune 500 HQ in MN)
| Industry | F500 HQs | Revenue |
|---|---|---|
| Healthcare | 2 | $407B |
|
||
| Retail | 2 | $150B |
|
||
| Consumer Goods | 2 | $32B |
|
||
| Industrial Machinery | 2 | $6B |
|
||
| Agriculture | 1 | $40B |
|
||
| Healthcare / Medical Devices | 1 | $32B |
|
||
Price history
+2150.0% since first listed29 events — show timeline
- 2026-06-12 Listed $225,000 NORTHSTARMLS as Distributed by MLS Grid
- 2023-09-19 Sold (Public Records) $229,000 Public Records
- 2023-09-15 Sold (MLS) $229,000 NORTHSTARMLS as Distributed by MLS Grid
- 2023-08-16 Pending — NORTHSTARMLS as Distributed by MLS Grid
- 2023-08-08 Contingent — NORTHSTARMLS as Distributed by MLS Grid
- 2023-08-06 Listed $229,000 NORTHSTARMLS as Distributed by MLS Grid
- 2023-08-05 Coming Soon $229,000 NORTHSTARMLS as Distributed by MLS Grid
- 2017-05-05 Sold (MLS) $154,900 NORTHSTARMLS as Distributed by MLS Grid
- 2017-03-29 Pending — NORTHSTARMLS as Distributed by MLS Grid
- 2017-03-27 Listed $154,900 NORTHSTARMLS as Distributed by MLS Grid
- 2011-12-07 Sold (Public Records) $82,500 Public Records
- 2011-11-30 Sold (MLS) $82,500 NORTHSTARMLS as Distributed by MLS Grid
- 2011-09-12 Listing Removed — NORTHSTARMLS as Distributed by MLS Grid
- 2011-02-14 Listed $84,900 NORTHSTARMLS as Distributed by MLS Grid
- 2005-10-05 Sold (Public Records) $157,400 Public Records
- 2005-08-11 Sold (MLS) $157,400 NORTHSTARMLS as Distributed by MLS Grid
- 2005-08-05 Sold (Public Records) $157,400 Public Records
- 2005-08-02 Listing Removed — NORTHSTARMLS as Distributed by MLS Grid
- 2005-07-15 Listed $154,900 NORTHSTARMLS as Distributed by MLS Grid
- 2001-05-01 Sold (MLS) $130,000 NORTHSTARMLS as Distributed by MLS Grid
- 2001-04-30 Sold (Public Records) $127,000 Public Records
- 2001-02-25 Listing Removed — NORTHSTARMLS as Distributed by MLS Grid
- 2001-01-30 Listed $131,000 NORTHSTARMLS as Distributed by MLS Grid
- 1999-07-28 Sold (Public Records) $103,000 Public Records
- 1999-06-29 Sold (MLS) $102,900 NORTHSTARMLS as Distributed by MLS Grid
- 1999-04-13 Listing Removed — NORTHSTARMLS as Distributed by MLS Grid
- 1999-03-26 Listed $99,900 NORTHSTARMLS as Distributed by MLS Grid
- 1998-06-01 Sold (Public Records) $90,400 Public Records
- 1997-02-14 Sold (Public Records) $10,000 Public Records
Property tax history
+4.9%/yrLatest (2025): $2,722 · +7.2% YoY. Source: county tax records.
Cash-flow waterfall
monthlySold comps — $/sqft
last 12 mo · ≤1 miLoading sold comps…