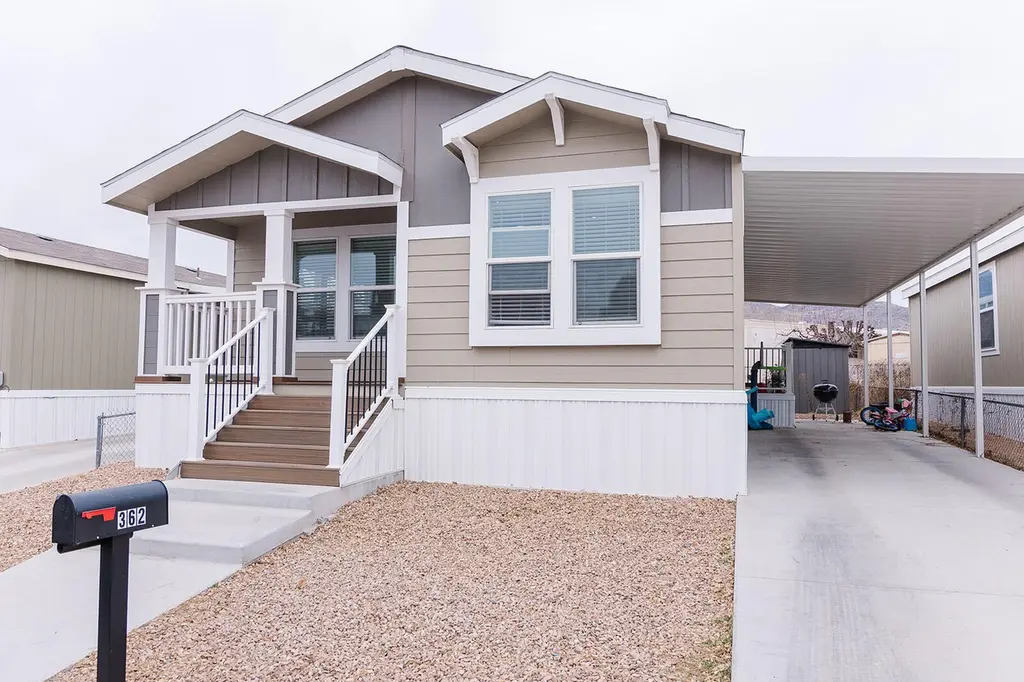
362 E Antelope Cir SE · Albuquerque, NM
Flood risk 1/10 · Minimal
- FEMA flood zone
- X (unshaded)
- Chance of flooding over 30 yrs
- 0.0%
- Est. flood insurance / yr
- $507 – $1,088
Fire risk 3/10 · Minor
- Est. fire insurance / yr
- $706 – $1,312
Heat risk 4/10 · Minor
- Hot days now (above 91°F)
- 3 days/yr
- Hot days in 30 yrs
- 8 days/yr
Wind risk 1/10 · Minimal
- Chance of severe wind over 30 yrs
- —
Air-quality risk 1/10 · Minimal
- Unhealthy air days now
- 0 days/yr
- Unhealthy air days in 30 yrs
- 0 days/yr
Risk factors via First Street. Map © Google.
Why this score? — see what drove the C+ grade
The composite is a weighted blend of 9 inputs, each scored 0–100. Each bar is that input's sub-score; the figure is the points it added to the 100-point composite (weight × sub-score).
- Cash flow +28.2/30.0
- DSCR +10.0/10.0
- 1% rule +7.8/10.0
- Schools +5.3/10.0
- Condition / age +4.0/5.0
- Livability +3.6/5.0
- Rent growth +2.0/5.0
- ARV discount +0.0/15.0
- Appreciation +0.0/10.0
$145,000
🖨 Deal sheet 📄 Offer letter ✓ Due diligence
Listing remarks MLS
This newer 3-bedroom, 2-bath home built in 2023 is located on a spacious, quiet lot in a peaceful mobile home park near the foothills. Offering a comfortable layout with well sized bedrooms and modern finishes, the home features stainless steel appliances and abundant lighting throughout, creating a bright and inviting atmosphere. Enjoy private streets for walking or biking, plus the convenience of parking right next to your home. Community amenities include three centers with activity rooms, coffee lounges, billiards, kitchens, tennis and basketball courts, three heated pools, playgrounds, on-site shopping, car wash, daycare, and 24-hour security. Come make this home yours today.
Key facts
- Heated pools
- Activity rooms
- Community amenities
Tags
Neighborhood map
What this means for you Summary
Snapshot
- This is a 3-bed/2.0-bath manufactured listed at $145k. Condition is rated good.
Deal economics
- At list price, monthly cash flow is $462 ($6k/yr) — positive.
- The deal already cash-flows at list — no discount required.
- Meets the 1% rule at list price ($2k rent vs $145k).
- Recommended offer: $132k (9.0% below list) — sets the bar for market timing.
- Cap rate 10.1% vs local median 3.7% in Albuquerque — top-decile yield for the area; either an underpriced asset or a hidden risk that comps aren't pricing in. Stress-test before assuming the spread holds.
Location & tenants
- Location reads 72/100 on livability (#13 in NM) — a middle-class / working-renter tenant base. Strengths: amenities A+, commute A+, cost of living A+; Watch: schools D-, crime F.
- Albuquerque Public Schools (urban): math 51% / reading 75% proficiency, ranked #3 of 29 in NM (top 10%) — acceptable for families but not a draw, mixed tenant base, ~2y average lease; 60% free/reduced lunch — lower-income household profile, screen leases tightly.
- Market conditions: Rents soft (-2.1%/yr); 202 active listings in the ZIP; 33 comparable units currently listed for rent nearby; rentals at typical pace (median 24d on market — plan ~3-4 weeks tenant-placement turnaround); 1,316 units permitted in Bernalillo County in 2024 (546 in 5+ unit buildings).
- This rent runs 35% of the median local income ($64k/yr) — at the standard rent-burdened threshold; future hikes will face affordability resistance.
Forward outlook
- Local home prices are declining (-3.0%/yr); year-one equity from $1k of loan paydown is wiped out by about $4k of value loss. Plan a longer hold.
Negotiation context
- It's been on market 119 days — a 9% lower offer ($132k) is reasonable based on typical stale-listing flexibility.
Questions for the listing agent
- It's been on market 119 days. Have you received any prior offers? Is the seller open to a 9% concession, seller financing, or rate buy-down credit?
- Why hasn't it sold? Are there any deal-killer items the seller is aware of (foundation, flood, title, zoning, code violations)?
- Is there a deadline driving the sale (1031 exchange, divorce, estate, relocation)? That informs how much negotiation room exists.
- Schools are D-rated, which usually means shorter tenancies and higher turnover. Who's the typical renter profile here, and what's been the actual vacancy rate?
- Crime grade is F in this area — have there been break-ins, vandalism, or insurance claims at this property in the last 3 years? What carrier currently insures it and at what premium?
- What's the average days-on-market for RENTAL listings here right now (not sales)? A rising rental-DOM trend means longer vacancies and softer asking-rent achievability than the comps imply.
- What's the recent tenant-quality profile in this submarket — average credit score on applications, eviction rate, late-payment / NSF rate, and stable-employment percentage? A property-management company in the area should have these aggregated.
- How much new for-sale + rental construction is in the pipeline within 1–3 miles? Heavy new supply typically softens prices + rents 12–24 months out; constrained supply supports both.
Investment metrics
- 1% rule
- 1.28% ✓
- Cap rate
- 10.12%
- Cash-on-cash
- 13.66%
- DSCR
- 1.61
- GRM
- 6.5
CMA / ARV
- ARV (median comp)
- $120,296
- List price
- $145,000
- Delta
- 20.54%
- Verdict
- OVERPRICED
- Comps
- 5 within 1.0 mi
Show comp detail 4 sales within ~0.75 mi
| Address | Dist | Beds/Ba | Sqft | Sold | Price | $/sf | Match |
|---|---|---|---|---|---|---|---|
| 366 Antelope Cir SE | 0.01mi | 3/2.0 | 1,325 (0%) | 4mo | $115,000 | $87 | 97 |
| 581 Doe Ln SE | 0.21mi | 3/2.0 | 1,440 (+9%) | 9mo | $129,500 | $90 | 68 |
| 612 Trading Post Trl SE | 0.22mi | 3/2.0 | 1,196 (-10%) | 7mo | $120,000 | $100 | 67 |
| 624 Trading Post Trl SE | 0.25mi | 3/2.0 | 1,280 (-3%) | 23mo | $84,900 | $66 | 64 |
Match score weights: distance 35% · size 25% · config 20% · recency 20%. Top-matched comps best support the ARV.
Projected returns pro-forma
-3.0% appreciation · 0.0% rent growth · sell at horizon
- IRR
- 0.4%
- Equity multiple
- 1.01×
- Total profit
- $528
- Equity at exit
- $21,620
- IRR
- 6.7%
- Equity multiple
- 1.43×
- Total profit
- $17,477
- Equity at exit
- $12,537
Cash invested: $40,600 (down + closing). Projections, not guarantees.
Landlord ↔ Tenant lean methodology
- Overall (STATE)
- 55 Moderately Landlord-Leaning
- State New Mexico
- 55 Moderately Landlord-Leaning · D+3
- County
- — inherits STATE
- City
- — inherits STATE
ZIP-level market 87123
- Rents YoY
- -2.1%
- Active inventory
- 202
- Price-to-rent
- 6.5×
Monthly cashflow live
- Estimated rent
- $1,853 high interval (Pro) →
- Mortgage (P&I)
- −$760
- Tax est. 1.5%
- −$181 /mo · $2,175/yr
- Insurance
- −$60
- HOA
- −$0
- Vacancy / Maint / Mgmt
- −$389
- Net cashflow
- $462
Break-even live
UW: 25.0% down · 7.5% · 30yr · 1.5% tax · 5.0% vac · 8.0% maint · 8.0% mgmt
Financing live
Cash to close
- Down payment
- $36,250
- Closing costs
- $4,350
- Reserves months
- —
- Total cash needed
- —
Loan-product check · same deal, 3 products live
Conventional
25% down · 7.5% · 30yr
- Down + closing
- —
- Monthly P&I
- —
- Monthly cashflow
- —
- DSCR
- —
- Eligible?
- —
Personal DTI + credit; lowest rate.
DSCR
20% down · 8.5% · 30yr
- Down + closing
- —
- Monthly P&I
- —
- Monthly cashflow
- —
- DSCR
- —
- Eligible?
- —
No personal income docs; deal must DSCR.
Hard money
10% down · 12.0% · 12mo
- Down + closing
- —
- Monthly P&I
- —
- Monthly cashflow
- —
- DSCR
- —
- Eligible?
- —
Short-term bridge; refi at stabilization.
Rent comps 33 comps
| Address | Beds | Baths | Sqft | Rent | $/sqft | DOM | Units | Dist |
|---|---|---|---|---|---|---|---|---|
| 328 Via Vista St SE Albuquerque, NM | 3.0 | 2.0 | 1460 | $2,075 | $1.42 | 2d | 1 | 0.23mi |
| 301 Western Skies Dr SE Albuquerque, NM | 1.0–3.0 | 1.0–2.0 | 806 | $1,511 | $1.87 | 3d | 17 | 0.30mi |
| 419 Sawtooth St SE Albuquerque, NM | 3.0 | 2.0 | 1785 | $1,950 | $1.09 | 3d | 1 | 0.36mi |
| 221 Shirley St NE Albuquerque, NM | 3.0 | 1.5 | 1250 | $1,750 | $1.40 | 3d | 1 | 0.37mi |
| 11208 Deer Lodge Pl SE Albuquerque, NM | 3.0 | 2.0 | 1408 | $1,950 | $1.38 | 43d | 1 | 0.39mi |
| 12021 Skyline Rd NE Albuquerque, NM | 1.0–3.0 | 1.0–2.0 | 875 | $1,592 | $1.82 | 3d | 17 | 0.40mi |
| 11104 Vistazo Pl SE Albuquerque, NM | 3.0 | 2.0 | 1353 | $1,950 | $1.44 | 23d | 1 | 0.45mi |
| 408 Rainbow Ct SE Albuquerque, NM | 2.0 | 1.0 | 950 | $1,200 | $1.26 | 23d | 1 | 0.54mi |
| 915 Tony Sanchez Dr SE Albuquerque, NM | 3.0 | 2.0 | 1180 | $2,295 | $1.94 | 3d | 1 | 0.60mi |
| 11606 Herman Roser Ave SE Albuquerque, NM | 3.0 | 2.0 | 1820 | $2,295 | $1.26 | 43d | 1 | 0.64mi |
| 521 Nathan St SE Albuquerque, NM | 3.0 | 2.0 | 1060 | $1,895 | $1.79 | 19d | 1 | 0.66mi |
| 517 Ida Pl NE Albuquerque, NM | 3.0 | 1.5 | 1058 | $2,000 | $1.89 | 21d | 1 | 0.69mi |
| 12004 Zia Rd NE Albuquerque, NM | 2.0–3.0 | 1.5–2.0 | 1323 | $2,145 | $1.62 | 2d | 7 | 0.71mi |
| 1105 Tony Sanchez Dr SE Albuquerque, NM | 3.0 | 2.0 | 1700 | $1,975 | $1.16 | 43d | 1 | 0.75mi |
| 12032 Copper Ave NE Albuquerque, NM | 2.0 | 2.5 | 1090 | $1,900 | $1.74 | 3d | 1 | 0.78mi |
| 628 Marquis Ct NE Albuquerque, NM | 2.0 | 2.0 | 1099 | $2,800 | $2.55 | 43d | 1 | 0.86mi |
| 701 Stephen Moody St SE Albuquerque, NM | 1.0–2.0 | 1.0–2.0 | 814 | $1,715 | $2.11 | 3d | 10 | 0.88mi |
| 13150 Wenonah Ave SE Albuquerque, NM | 1.0–2.0 | 1.0–2.0 | 789 | $1,633 | $2.07 | 3d | 16 | 0.89mi |
| 12624 Copper Ave NE Apt 3 Albuquerque, NM | 2.0 | 2.0 | 900 | $995 | $1.11 | 43d | 1 | 0.90mi |
| 10843 Fort Point Ln NE Albuquerque, NM | 3.0 | 2.5 | 1768 | $2,195 | $1.24 | 23d | 1 | 0.94mi |
| 829 Hackberry Trl SE Albuquerque, NM | 3.0 | 2.0 | 1516 | $1,950 | $1.29 | 43d | 1 | 0.99mi |
| 10404 Griffith Park Dr NE Albuquerque, NM | 3.0 | 2.0 | 1287 | $2,100 | $1.63 | 3d | 1 | 1.01mi |
| 12412 Grand Ave NE Albuquerque, NM | 3.0 | 2.0 | 1022 | $1,850 | $1.81 | 44d | 1 | 1.03mi |
| 12509 Nambe Ave NE Albuquerque, NM | 3.0 | 1.5 | 1272 | $1,800 | $1.42 | 23d | 1 | 1.07mi |
| 1668 Bull Lea Dr SE Albuquerque, NM | 3.0 | 2.5 | 1609 | $2,249 | $1.40 | 23d | 1 | 1.10mi |
| 1667 Domino Dr SE Albuquerque, NM | 3.0 | 2.5 | 1868 | $2,250 | $1.20 | 19d | 1 | 1.11mi |
| 187 Vista Point Ct NE Albuquerque, NM | 2.0 | 1.5 | 1262 | $1,975 | $1.56 | 23d | 1 | 1.12mi |
| 13412 Turquoise Ave NE Albuquerque, NM | 3.0 | 2.0 | 1425 | $1,900 | $1.33 | 23d | 1 | 1.12mi |
| 557 Tramway Blvd NE Albuquerque, NM | 1.0–3.0 | 1.0–2.0 | 891 | $1,405 | $1.58 | 3d | 9 | 1.17mi |
| 717 Grace St NE Albuquerque, NM | 3.0 | 1.5 | 1040 | $1,875 | $1.80 | 23d | 1 | 1.17mi |
| 13615 Shaffer Ct SE Albuquerque, NM | 3.0 | 3.0 | 1341 | $2,700 | $2.01 | 3d | 1 | 1.18mi |
| 12201 Lomas Blvd NE Albuquerque, NM | 1.0–2.0 | 1.0 | 800 | $1,250 | $1.56 | 43d | 6 | 1.33mi |
| 905 La Charles Dr NE Albuquerque, NM | 3.0 | 2.0 | 1473 | $2,650 | $1.80 | 43d | 1 | 1.48mi |
Listing history 11 events
-
2026-06-10days on market $145,000 Active 119 DOM
-
2026-06-09days on market $145,000 Active 118 DOM
-
2026-06-08days on market $145,000 Active 117 DOM
-
2026-06-07days on market $145,000 Active 116 DOM
-
2026-06-05days on market $145,000 Active 113 DOM
-
2026-06-03days on market $145,000 Active 112 DOM
-
2026-06-02days on market $145,000 Active 111 DOM
-
2026-06-01days on market $145,000 Active 110 DOM
-
2026-05-31days on market $145,000 Active 109 DOM
-
2026-03-23price $145,000 689-char remark
Show marketing remark (689 chars)
This newer 3-bedroom, 2-bath home built in 2023 is located on a spacious, quiet lot in a peaceful mobile home park near the foothills. Offering a comfortable layout with well sized bedrooms and modern finishes, the home features stainless steel appliances and abundant lighting throughout, creating a bright and inviting atmosphere. Enjoy private streets for walking or biking, plus the convenience of parking right next to your home. Community amenities include three centers with activity rooms, coffee lounges, billiards, kitchens, tennis and basketball courts, three heated pools, playgrounds, on-site shopping, car wash, daycare, and 24-hour security. Come make this home yours today.
-
2026-02-10$155,000 Active 689-char remark
Show marketing remark (689 chars)
This newer 3-bedroom, 2-bath home built in 2023 is located on a spacious, quiet lot in a peaceful mobile home park near the foothills. Offering a comfortable layout with well sized bedrooms and modern finishes, the home features stainless steel appliances and abundant lighting throughout, creating a bright and inviting atmosphere. Enjoy private streets for walking or biking, plus the convenience of parking right next to your home. Community amenities include three centers with activity rooms, coffee lounges, billiards, kitchens, tennis and basketball courts, three heated pools, playgrounds, on-site shopping, car wash, daycare, and 24-hour security. Come make this home yours today.
ⓘ Source: listings_history table (triggers on properties + properties_extension) + one-shot
backfill from property_details.listing_events for pre-trigger history.
Climate risk First Street
- Flood 1/10 Low FEMA zone X (unshaded) · 0% chance over 30 yrs
- Wildfire 3/10 Moderate
- Heat 4/10 Moderate 3 d/yr ≥91°F today · 8 d/yr by 30 yrs out
- Wind 1/10 Low
- Air quality 1/10 Low 0 unhealthy d/yr today · 0 by 30 yrs out
Nearby sold comps map
Loading sold comps map…
Walkable amenities ~0.75 mi
Loading nearby amenities…
Taxation est. · year 1
- Rental income
- $22,240
- − Mortgage interest
- −$8,122
- − Property taxes
- −$2,175
- − Insurance
- −$725
- − Repairs & maintenance
- −$1,779
- − Management
- −$1,779
- − Depreciation
- −$4,218
- Taxable income
- $3,441
- Est. tax owed @ 24.0%
- −$826
- After-tax cash flow
- $4,719/yr
For passive investors: Depreciation is non-cash, so a rental often shows a tax loss while cash-flowing — sheltering income. Rental losses are passive: they offset passive income freely, and up to $25,000/yr can offset ordinary (W-2) income if you actively participate and your MAGI is under $100k (phasing out to $0 by $150k); unused losses carry forward. On sale, claimed depreciation is recaptured at up to 25%, and gains may owe capital-gains tax (a 1031 exchange can defer both). Figures are a year-1 estimate at your 24.0% rate — not tax advice; consult a CPA.
Condition & rehab AI · 12 photos
This 2023 manufactured home is in excellent condition with modern finishes and a spacious layout. It's move-in ready with minimal maintenance required.
Value-add opportunities
- Both Paint exterior — Fresh paint can enhance curb appeal and value
- Both Replace carpet with hardwood — Hardwood floors are more durable and add value
- Both Install smart home devices — Smart home devices can increase convenience and property value
Renovation cost estimate screening
Value-add ROI direction
- Both Paint exterior — Fresh paint can enhance curb appeal and value ↑
- Both Replace carpet with hardwood — Hardwood floors are more durable and add value ↑
- Both Install smart home devices — Smart home devices can increase convenience and property value ↑
ⓘ Cost ranges are severity-bucket heuristics (US national rule-of-thumb). Get contractor quotes + a written scope before underwriting a rehab budget.
Schools (NCES district)
- District
- Albuquerque Public Schools
- NCES district ID
- 3500060
- Math proficiency
- 51% ▲ 30.00%
- Reading proficiency
- 75% ▲ 45.00%
- Median HH income
- $48,151
- Composite
- 53.29/100
- National rank
- #1487
- State rank
- #3 of 29 in NM
Livability — Albuquerque
- Score
- 72/100
- State rank
- #13
- US rank
- #6219
Category grades
Schools grade is shown separately in the Schools card above.
Census & demographics
- Census place
- Albuquerque, NM
- County
- Bernalillo County · 647,165 people
- City population
- 647,165
- Metro
- Albuquerque, NM
- Population (ZIP)
- 42,252
- Household income
- $64,359
- Rent vs Own
- Severe rent burden
- 1657.0
Population outlook (Bernalillo County) Hauer SSP2
- Today (2025)
- 704,528 people
- By 2030
- 711,723 · +1.0%
- By 2040
- 714,522 · +1.4%
- By 2050
- 709,274 · +0.7%
- By 2075
- 680,015 · -3.5%
- By 2100
- 619,879 · -12.0%
Race, ethnicity, and origin ACS 2023
- Neighborhood character
- Diverse neighborhood (Simpson 0.64)
- Race & ethnicity
- Hispanic / Latino 44% White 40% Two or more races 18% Native American 6% Asian 5% Black 2%
- Hispanic origin (detail)
- Mexican 28%
- Common ancestry
- Italian 2% Romanian 2% Lithuanian 1%
- Foreign-born
- 12% · Canada, Vietnam
- Languages at home
- 71% English-only · Spanish 22% Vietnamese 2%
Political lean MEDSL · Bernalillo
- 2024 margin
- Strong D (+21.0) · D 59.2% · R 38.2% · Other 2.6%
- 2008→2024 swing
- -0.3pp no change · 2008: 21.4pp · 2024: 21.0pp
- All cycles
- 2024: D+21.0 2020: D+24.4 2016: D+17.8 2012: D+16.2 2008: D+21.4
Not yet ingested
- Civics
- —
Market trends
- HPI YoY
- ▼ -231.76%
- Current HPI
- 233.3553
- Rent YoY
- ▼ -2.10%
- Metro
- Albuquerque, NM
- State GDP YoY
- —
- F500 in state
- 0
Price history
-6.5% since first listed2 events — show timeline
- 2026-03-23 Price Changed $145,000 Southwest MLS
- 2026-02-10 Listed $155,000 Southwest MLS
Cash-flow waterfall
monthlySold comps — $/sqft
last 12 mo · ≤1 miLoading sold comps…