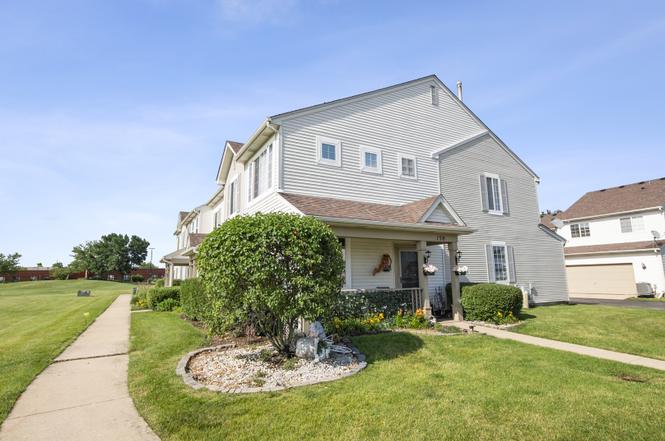
138 Azalea Cir #138 · Romeoville, IL
Flood risk 1/10 · Minimal
- FEMA flood zone
- X (unshaded)
- Chance of flooding over 30 yrs
- 0.0%
- Est. flood insurance / yr
- $507 – $1,088
Fire risk 1/10 · Minimal
- Est. fire insurance / yr
- $804 – $1,492
Heat risk 3/10 · Minor
- Hot days now (above 103°F)
- 7 days/yr
- Hot days in 30 yrs
- 15 days/yr
Wind risk 2/10 · Minimal
- Chance of severe wind over 30 yrs
- 1.0%
Air-quality risk 2/10 · Minimal
- Unhealthy air days now
- 1 days/yr
- Unhealthy air days in 30 yrs
- 2 days/yr
Risk factors via First Street. Map © Google.
Why this score? — see what drove the D- grade
The composite is a weighted blend of 9 inputs, each scored 0–100. Each bar is that input's sub-score; the figure is the points it added to the 100-point composite (weight × sub-score).
- Cash flow +11.8/30.0
- ARV discount +6.9/15.0
- 1% rule +4.6/10.0
- Rent growth +4.3/5.0
- Livability +3.7/5.0
- DSCR +3.5/10.0
- Condition / age +2.5/5.0
- Schools +2.3/10.0
- Appreciation +0.0/10.0
$285,000
🖨 Deal sheet 📄 Offer letter ✓ Due diligence
Listing remarks MLS
This beautiful, end unit 3 bedroom, 2 1/2 bath townhouse is nestled on a prime lot overlooking a scenic park! This home boasts an open floor plan & features: A nice front porch to greet you; Sun-filled living room with gleaming wood laminate flooring; Spacious kitchen with oak cabinets; Master suite that offers a sitting area, walk-in closet & private bath; Desirable 2nd floor laundry; 2 car attached garage. This wonderful country club community offers, parks, ponds, clubhouse & pools! Multiple offers received. Highest & best requested by Sunday, July 9 at 6pm.
Key facts
- $269 HOA
- 2 garage spots
- Community pool
Tags
Property features AI
Finance
- Other: Community park nearby; School bus service and interstate access
- HOA & community: Monthly association fee of $269; Association amenities include pool, party room, park, clubhouse, exterior maintenance, lawn care, snow removal; Manager off-site; Pets allowed (cats and dogs; weight TBD)
Exterior
- Parking: Attached garage owned with 2 garage spaces and garage door opener; Asphalt parking; Two total parking spaces
- Utilities: Public water; Public sewer; Electric with circuit breakers
- Home design: Attached single, end-unit townhome; Two-story townhouse; Entry level: 1st floor
- Construction: Built approximately 26–30 years ago; Vinyl siding; Asphalt roof; Concrete perimeter foundation
- Exterior features: Front porch; Unit backs to a park
Interior
- Kitchen: Updated kitchen with solid surface counter; Eating area with breakfast bar and table space; Range, Microwave, Dishwasher, Refrigerator; Stainless steel appliances
- Bedrooms: Three bedrooms (all on the second floor); Master bedroom with full bath; Additional sitting room and walk-in closet on second floor
- Flooring: Vinyl flooring throughout listed rooms
- Bathrooms: Two full bathrooms and one half bathroom
- Heating & cooling: Forced air heating (natural gas); Central air conditioning
- Interior features: Seven total rooms; Ceiling fan(s); TV cable ready
- Laundry & utility: Upper-level laundry area with washer hookup; In-unit washer and dryer
Neighborhood map
What this means for you Summary
Snapshot
- This is a 3-bed/2.5-bath townhouse listed at $285k.
Deal economics
- At list price, monthly cash flow is $-80 ($-959/yr) — negative.
- To cash-flow at today's rent, offer at most $273k (4.1% below list).
- To meet the 1% rule (rent ≥ 1% of price), the offer needs to be $273k (4.1% below list).
- Recommended offer: $273k (4.1% below list) — sets the bar for 1% rule.
- Cap rate 6.0% vs local median 4.5% in Romeoville — top-decile yield for the area; either an underpriced asset or a hidden risk that comps aren't pricing in. Stress-test before assuming the spread holds.
Location & tenants
- Location reads 74/100 on livability (#266 in IL, #4,960 nationally) — a middle-class / working-renter tenant base. Strengths: employment A+, housing A+, crime A; Watch: commute D, amenities F, health & safety F.
- Valley View CUSD 365U (suburban): math 21% / reading 28% proficiency, ranked #289 of 620 in IL (top 47%) — low school quality limits family demand, transient renter base, plan for 1-2y turnover.
- Zoned schools: Kenneth L Hermansen Elementary (math 17% / reading 17%, grade F, #1,141 of 2,056 statewide, top 59%, 449 students, 0% FRL); A Vito Martinez Middle School (math 21% / reading 34%, grade F, #295 of 665 statewide, top 45%, 638 students, 0% FRL); Romeoville High School (math 21% / reading 29%, grade F, #247 of 693 statewide, top 36%, 1,922 students, 0% FRL) — zoned schools average 0% FRL vs 51% district-wide (51 pts lower); this property's tenant base skews higher-income than the district average.
- Market conditions: Rents rising fast (+7.2%/yr); 65 active listings in the ZIP; 19 comparable units currently listed for rent nearby; rentals leasing fast (median 1d on market — plan ~1-2 weeks tenant-placement turnaround); solid renter incomes; 2,028 units permitted in Will County in 2024 (530 in 5+ unit buildings).
- This rent runs 31% of the median local income ($106k/yr) — at the standard rent-burdened threshold; future hikes will face affordability resistance.
Forward outlook
- Local home prices are declining (-3.0%/yr); year-one equity from $2k of loan paydown is wiped out by about $9k of value loss. Plan a longer hold.
- Will County population projected to shrink 4% by 2050 — rents likely to lag national; underwrite the cash flow, not the appreciation.
Negotiation context
- Only 1 days on market — expect competitive offers; lowballing is unlikely to land.
- 4 sale attempts since 18y ago with the ask held roughly flat each time — persistent listings suggest the price (not the market) is what's stuck; bring a comps-based counter.
- Current owner paid $230k; 24% above their basis — modest negotiation headroom, anchor on the comps not their cost.
Questions for the listing agent
- What do current leases actually rent for vs. the listed asking? Can we see a recent rent roll and the last 12 months of T-12 income?
- What does the HOA fee cover, when was the last increase, and are there any pending special assessments or reserve-fund shortfalls?
- Is there a deadline driving the sale (1031 exchange, divorce, estate, relocation)? That informs how much negotiation room exists.
- Schools are D-rated, which usually means shorter tenancies and higher turnover. Who's the typical renter profile here, and what's been the actual vacancy rate?
- The area grade is low — what's the realistic commute time and amenity access for the typical tenant pool here? Any planned neighborhood developments (good or bad) we should know about?
- What's the average days-on-market for RENTAL listings here right now (not sales)? A rising rental-DOM trend means longer vacancies and softer asking-rent achievability than the comps imply.
- What's the recent tenant-quality profile in this submarket — average credit score on applications, eviction rate, late-payment / NSF rate, and stable-employment percentage? A property-management company in the area should have these aggregated.
- How much new for-sale + rental construction is in the pipeline within 1–3 miles? Heavy new supply typically softens prices + rents 12–24 months out; constrained supply supports both.
Investment metrics
- 1% rule
- 0.96% ✗
- Cap rate
- 5.96%
- Cash-on-cash
- -1.20%
- DSCR
- 0.95
- GRM
- 8.7
CMA / ARV
- ARV (on-the-fly)
- $281,520
- Comps found
- 12
Show comp detail 12 sales within ~0.75 mi
| Address | Dist | Beds/Ba | Sqft | Sold | Price | $/sf | Match |
|---|---|---|---|---|---|---|---|
| 179 Azalea Cir #179 | 0.06mi | 3/2.5 | 1,564 (0%) | 2mo | $255,000 | $163 | 96 |
| 142 Azalea Cir | 0.06mi | 3/2.5 | 1,454 (-7%) | 4mo | $265,500 | $183 | 82 |
| 109 Yarrow Ct #109 | 0.31mi | 3/2.5 | 1,564 (0%) | 6mo | $255,000 | $163 | 81 |
| 153 Yarrow Ct | 0.29mi | 3/2.5 | 1,771 (+13%) | 1mo | $255,000 | $144 | 64 |
| 75 Strawflower Ct #75 | 0.32mi | 2/2.5 (-1) | 1,679 (+7%) | 6mo | $237,000 | $141 | 63 |
| 1375 Alder Creek Ct | 0.47mi | 3/2.5 | 1,711 (+9%) | 6mo | $307,500 | $180 | 57 |
| 271 S Alder Creek Dr | 0.58mi | 3/2.5 | 1,711 (+9%) | 4mo | $300,000 | $175 | 54 |
| 21423 Frost Ct | 0.62mi | 3/2.5 | 1,398 (-11%) | 2mo | $285,000 | $204 | 52 |
| 14064 Denton Ct | 0.62mi | 3/2.5 | 1,398 (-11%) | 4mo | $275,500 | $197 | 50 |
| 359 Reston Cir | 0.74mi | 4/2.5 (+1) | 1,700 (+9%) | 1mo | $320,125 | $188 | 46 |
| 14032 Danbury Dr | 0.66mi | 2/2.5 (-1) | 1,350 (-14%) | 2mo | $279,000 | $207 | 40 |
| 14017 Emerald Ct | 0.75mi | 4/2.5 (+1) | 1,768 (+13%) | 5mo | $280,000 | $158 | 34 |
Match score weights: distance 35% · size 25% · config 20% · recency 20%. Top-matched comps best support the ARV.
Projected returns pro-forma
-3.0% appreciation · 7.16% rent growth · sell at horizon
- IRR
- -13.0%
- Equity multiple
- 0.51×
- Total profit
- $-39,150
- Equity at exit
- $42,494
- IRR
- 2.0%
- Equity multiple
- 1.17×
- Total profit
- $13,474
- Equity at exit
- $24,642
Cash invested: $79,800 (down + closing). Projections, not guarantees.
Landlord ↔ Tenant lean methodology
- Overall (STATE)
- 43 Moderately Tenant-Leaning
- State Illinois
- 43 Moderately Tenant-Leaning · D+7
- County
- — inherits STATE
- City
- — inherits STATE
ZIP-level market 60446
- Rents YoY
- 7.2%
- Active inventory
- 65
- Price-to-rent
- 8.7×
Monthly cashflow live
- Estimated rent
- $2,732 high interval (Pro) →
- Mortgage (P&I)
- −$1,495
- Tax est. 1.5%
- −$356 /mo · $4,275/yr
- Insurance
- −$119
- HOA
- −$269
- Vacancy / Maint / Mgmt
- −$574
- Net cashflow
- $-80
Break-even live
UW: 25.0% down · 7.5% · 30yr · 1.5% tax · 5.0% vac · 8.0% maint · 8.0% mgmt
Financing live
Cash to close
- Down payment
- $71,250
- Closing costs
- $8,550
- Reserves months
- —
- Total cash needed
- —
Loan-product check · same deal, 3 products live
Conventional
25% down · 7.5% · 30yr
- Down + closing
- —
- Monthly P&I
- —
- Monthly cashflow
- —
- DSCR
- —
- Eligible?
- —
Personal DTI + credit; lowest rate.
DSCR
20% down · 8.5% · 30yr
- Down + closing
- —
- Monthly P&I
- —
- Monthly cashflow
- —
- DSCR
- —
- Eligible?
- —
No personal income docs; deal must DSCR.
Hard money
10% down · 12.0% · 12mo
- Down + closing
- —
- Monthly P&I
- —
- Monthly cashflow
- —
- DSCR
- —
- Eligible?
- —
Short-term bridge; refi at stabilization.
Rent comps 19 comps
| Address | Beds | Baths | Sqft | Rent | $/sqft | DOM | Units | Dist |
|---|---|---|---|---|---|---|---|---|
| 160 S Highpoint Dr Romeoville, IL | 1.0–2.0 | 1.0–2.0 | 900 | $2,471 | $2.75 | 1d | 17 | 0.33mi |
| 21439 W Georgetown Dr Plainfield, IL | 3.0 | 1.5 | 1600 | $2,646 | $1.65 | 1d | 1 | 0.55mi |
| 21509 W Georgetown Dr Plainfield, IL | 3.0 | 1.5 | 1452 | $2,400 | $1.65 | 7d | 1 | 0.58mi |
| 21423 Frost Ct Plainfield, IL | 3.0 | 2.5 | 1398 | $2,450 | $1.75 | 1d | 1 | 0.60mi |
| 21523 Franklin Cir Unit 21523 Plainfield, IL | 3.0 | 2.5 | 1382 | $2,650 | $1.92 | 43d | 1 | 0.73mi |
| 315 Richmond Dr Romeoville, IL | 3.0 | 2.5 | 1668 | $2,700 | $1.62 | 1d | 1 | 0.77mi |
| 14252 S Hemingway Cir Plainfield, IL | 4.0 | 2.5 | 2031 | $2,950 | $1.45 | 1d | 1 | 0.78mi |
| 13922 S Bristlecone Dr Apt B Plainfield, IL | 2.0 | 2.0 | 1162 | $2,200 | $1.89 | 24d | 1 | 0.86mi |
| 1882 N Wentworth Cir Romeoville, IL | 2.0 | 1.5 | 1402 | $2,700 | $1.93 | 10d | 1 | 1.07mi |
| 152 Wedgeport Ct Romeoville, IL | 3.0 | 2.5 | 2044 | $1,500 | $0.73 | 6d | 1 | 1.15mi |
| 501 S Weber Rd Romeoville, IL | 1.0–3.0 | 1.0–2.0 | 1228 | $3,048 | $2.48 | 1d | 9 | 1.16mi |
| 501 S Weber Rd Romeoville, IL | 1.0–3.0 | 1.0–2.0 | 1228 | $3,420 | $2.79 | 24d | 18 | 1.16mi |
| 1716 William Dr Romeoville, IL | 3.0 | 3.5 | 1700 | $3,800 | $2.24 | 1d | 1 | 1.23mi |
| 579 S Scott Ln Romeoville, IL | 3.0 | 2.5 | 1564 | $2,950 | $1.89 | 1d | 1 | 1.25mi |
| 14232 S Newberg Ct Plainfield, IL | 3.0 | 2.5 | 1684 | $3,100 | $1.84 | 1d | 1 | 1.35mi |
| 13520 S Buckthorn Ln Plainfield, IL | 2.0 | 2.0 | 1510 | $2,500 | $1.66 | 43d | 1 | 1.39mi |
| 700 S Weber Rd Romeoville, IL | 3.0 | 1.0–2.0 | 977 | $4,110 | $4.20 | 1d | 1 | 1.44mi |
| 14163 S Napa Cir Plainfield, IL | 3.0 | 2.5 | 1668 | $2,650 | $1.59 | 10d | 1 | 1.47mi |
| 21854 W Kentwood Dr Plainfield, IL | 3.0 | 2.5 | 1808 | $3,000 | $1.66 | 16d | 1 | 1.49mi |
HOA detail
- Monthly dues
- $269 · $3,228/yr
- Likely covers
- pool
Listing history 2 events
-
2026-06-18remarks 699-char remark
-
2026-06-18$285,000 Active 1 DOM
ⓘ Source: listings_history table (triggers on properties + properties_extension) + one-shot
backfill from property_details.listing_events for pre-trigger history.
Climate risk First Street
- Flood 1/10 Low FEMA zone X (unshaded) · 0% chance over 30 yrs
- Wildfire 1/10 Low
- Heat 3/10 Moderate 7 d/yr ≥103°F today · 15 d/yr by 30 yrs out
- Wind 2/10 Low 100% chance of damaging wind over 30 yrs
- Air quality 2/10 Low 1 unhealthy d/yr today · 2 by 30 yrs out
Nearby sold comps map
Loading sold comps map…
Walkable amenities ~0.75 mi
Loading nearby amenities…
Taxation est. · year 1
- Rental income
- $32,790
- − Mortgage interest
- −$15,964
- − Property taxes
- −$4,275
- − Insurance
- −$1,425
- − Repairs & maintenance
- −$2,623
- − Management
- −$2,623
- − HOA
- −$3,228
- − Depreciation
- −$8,291
- Taxable loss
- −$5,640
- Est. tax savings @ 24.0%
- +$1,354
- After-tax cash flow
- $395/yr
For passive investors: Depreciation is non-cash, so a rental often shows a tax loss while cash-flowing — sheltering income. Rental losses are passive: they offset passive income freely, and up to $25,000/yr can offset ordinary (W-2) income if you actively participate and your MAGI is under $100k (phasing out to $0 by $150k); unused losses carry forward. On sale, claimed depreciation is recaptured at up to 25%, and gains may owe capital-gains tax (a 1031 exchange can defer both). Figures are a year-1 estimate at your 24.0% rate — not tax advice; consult a CPA.
Schools (NCES district)
- District
- Valley View CUSD 365U
- NCES district ID
- 1740070
- Math proficiency
- 21% ▼ -15.00%
- Reading proficiency
- 28% ▼ -10.00%
- Median HH income
- $69,424
- Composite
- 23.48/100
- National rank
- #7875
- State rank
- #289 of 620 in IL
Livability — Romeoville
- Score
- 74/100
- State rank
- #266
- US rank
- #4960
Category grades
Schools grade is shown separately in the Schools card above.
Census & demographics
- Census place
- Romeoville, IL
- County
- Will County · 412,448 people
- City population
- 41,672
- Metro
- Chicago-Naperville-Elgin, IL-IN-WI
- Population (ZIP)
- 41,672
- Household income
- $106,258
- Rent vs Own
- Severe rent burden
- 699.0
Population outlook (Will County) Hauer SSP2
- Today (2025)
- 705,368 people
- By 2030
- 708,154 · +0.4%
- By 2040
- 702,692 · -0.4%
- By 2050
- 680,249 · -3.6%
- By 2075
- 611,990 · -13.2%
- By 2100
- 516,215 · -26.8%
Race, ethnicity, and origin ACS 2023
- Neighborhood character
- Diverse neighborhood (Simpson 0.67)
- Race & ethnicity
- White 44% Hispanic / Latino 35% Two or more races 16% Black 12% Asian 6%
- Hispanic origin (detail)
- Mexican 32% Puerto Rican 1%
- Common ancestry
- Romanian 9% Italian 1% Lithuanian 1%
- Foreign-born
- 20% · Canada
- Languages at home
- 62% English-only · Spanish 26% Russian/Polish/Slavic 4% Other Indo-European 2%
Political lean MEDSL · Will
- 2024 margin
- Toss-up / Even · D 50.1% · R 48.5% · Other 1.4%
- 2008→2024 swing
- -11.6pp toward R · 2008: 13.2pp · 2024: 1.6pp
- All cycles
- 2024: D+1.6 2020: D+8.3 2016: D+5.7 2012: D+3.7 2008: D+13.2
Not yet ingested
- Civics
- —
Market trends
- HPI YoY
- ▼ -234.09%
- Current HPI
- 217.5048
- Rent YoY
- ▲ 7.16%
- Metro
- Chicago-Naperville-Elgin, IL-IN-WI
- State GDP YoY
- ▲ 1.59%
- F500 in state
- 60
Industry mix (Fortune 500 HQ in IL)
| Industry | F500 HQs | Revenue |
|---|---|---|
| Insurance | 4 | $201B |
|
||
| Consumer Goods | 4 | $87B |
|
||
| Industrial Machinery | 3 | $64B |
|
||
| Healthcare | 2 | $55B |
|
||
| Retail / Pharmacy | 1 | $148B |
|
||
| Agriculture / Food | 1 | $86B |
|
||
Price history
+63.0% since first listed10 events — show timeline
- 2026-06-18 Listed $285,000 MRED as Distributed by MLS Grid
- 2023-08-15 Sold (MLS) $230,000 MRED as Distributed by MLS Grid
- 2023-07-10 Contingent — MRED as Distributed by MLS Grid
- 2023-07-05 Listed $219,900 MRED as Distributed by MLS Grid
- 2011-08-05 Listing Removed — MRED as Distributed by MLS Grid
- 2011-06-01 Price Changed — MRED as Distributed by MLS Grid
- 2010-09-20 Listed — MRED as Distributed by MLS Grid
- 2008-05-23 Sold (MLS) $170,000 MRED as Distributed by MLS Grid
- 2008-04-25 Listing Removed — MRED as Distributed by MLS Grid
- 2008-04-13 Listed $174,900 MRED as Distributed by MLS Grid
Cash-flow waterfall
monthlySold comps — $/sqft
last 12 mo · ≤1 miLoading sold comps…