402 5th Avenue Sw SW · Decatur, AL
Flood risk No data
- FEMA flood zone
- —
- Chance of flooding over 30 yrs
- %
- Est. flood insurance / yr
- —
Fire risk No data
- Est. fire insurance / yr
- —
Heat risk No data
- Hot days now (above °F)
- days/yr
- Hot days in 30 yrs
- days/yr
Wind risk No data
- Chance of severe wind over 30 yrs
- %
Air-quality risk No data
- Unhealthy air days now
- days/yr
- Unhealthy air days in 30 yrs
- days/yr
Risk factors via First Street. Map © Google.
Why this score? — see what drove the C+ grade
The composite is a weighted blend of 9 inputs, each scored 0–100. Each bar is that input's sub-score; the figure is the points it added to the 100-point composite (weight × sub-score).
- Cash flow +21.6/30.0
- ARV discount +15.0/15.0
- DSCR +6.9/10.0
- 1% rule +5.7/10.0
- Rent growth +3.7/5.0
- Livability +3.6/5.0
- Schools +2.6/10.0
- Condition / age +2.5/5.0
- Appreciation +0.0/10.0
$125,000
🖨 Deal sheet 📄 Offer letter ✓ Due diligence
Listing remarks
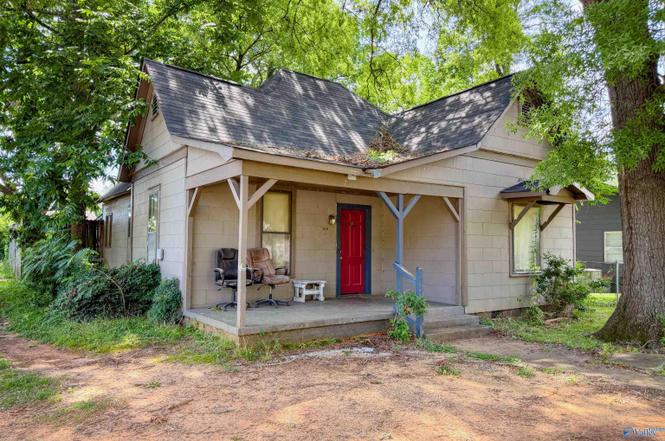
Opportunity awaits. .. This home is ideal for investors, rehabbers, or buyers seeking a project with potential. This adorable bungalow greets you with a comfortable covered front porch, hard wood floors, a wood-burning fireplace, and a wonderfully spacious floor plan with large bedrooms and bath. The exterior features a large, fenced backyard. Sold "AS-IS, WHERE-IS. " Listing photos have been retouched and decluttered for marketing purposes.
Key facts
- Covered front porch
- Fenced backyard
- 0.3 acre lot
Tags
Neighborhood map
What this means for you Summary
Snapshot
- This is a 3-bed/1.0-bath single-family listed at $125k.
Deal economics
- At list price, monthly cash flow is $189 ($2k/yr) — positive.
- The deal already cash-flows at list — no discount required.
- Meets the 1% rule at list price ($1k rent vs $125k).
- Cap rate 8.1% vs local median 4.0% in Decatur — top-decile yield for the area; either an underpriced asset or a hidden risk that comps aren't pricing in. Stress-test before assuming the spread holds.
Location & tenants
- Location reads 72/100 on livability (#28 in AL) — a middle-class / working-renter tenant base. Strengths: cost of living A+, housing A+, health & safety A+; Watch: schools C-, employment D+, crime F.
- Decatur City (urban): math 22% / reading 40% proficiency, ranked #66 of 129 in AL (top 51%) — families likely to look elsewhere, expect single-tenant / working-renter base with shorter leases.
- Market conditions: Rents rising fast (+4.7%/yr); 223 active listings in the ZIP; 16 comparable units currently listed for rent nearby; rentals lingering (median 44d on market — plan ~5-8 weeks vacancy on turnover, expect pricing pressure); 62% of comp listings sitting > 30 days — soft ceiling on asking rent; 231 units permitted in Morgan County in 2024 (0 in 5+ unit buildings).
- This rent runs 31% of the median local income ($51k/yr) — at the standard rent-burdened threshold; future hikes will face affordability resistance.
Forward outlook
- Local home prices are declining (-3.0%/yr); year-one equity from $864 of loan paydown is wiped out by about $4k of value loss. Plan a longer hold.
- Morgan County population projected at -11% by 2050 — secular population decline; favor cash flow + early exit over multi-decade hold.
Negotiation context
- Only 1 days on market — expect competitive offers; lowballing is unlikely to land.
Risks & watch-outs
- Watch-outs: built in 1944 — expect roof / HVAC / electrical / plumbing capex.
Questions for the listing agent
- Built in 1944 — when were the roof, HVAC, electrical panel, plumbing, and water heater last replaced?
- Is there a deadline driving the sale (1031 exchange, divorce, estate, relocation)? That informs how much negotiation room exists.
- Crime grade is F in this area — have there been break-ins, vandalism, or insurance claims at this property in the last 3 years? What carrier currently insures it and at what premium?
- What's the average days-on-market for RENTAL listings here right now (not sales)? A rising rental-DOM trend means longer vacancies and softer asking-rent achievability than the comps imply.
- What's the recent tenant-quality profile in this submarket — average credit score on applications, eviction rate, late-payment / NSF rate, and stable-employment percentage? A property-management company in the area should have these aggregated.
- How much new for-sale + rental construction is in the pipeline within 1–3 miles? Heavy new supply typically softens prices + rents 12–24 months out; constrained supply supports both.
Investment metrics
- 1% rule
- 1.07% ✓
- Cap rate
- 8.11%
- Cash-on-cash
- 6.48%
- DSCR
- 1.29
- GRM
- 7.8
CMA / ARV
- ARV (on-the-fly)
- $161,364
- Comps found
- 12
Show comp detail 12 sales within ~0.75 mi
| Address | Dist | Beds/Ba | Sqft | Sold | Price | $/sf | Match |
|---|---|---|---|---|---|---|---|
| 207 7th Ave SW | 0.20mi | 3/1.0 | 1,404 (+4%) | 8mo | $120,200 | $86 | 78 |
| 609 7th Ave SW | 0.25mi | 4/2.0 (+1) | 1,380 (+2%) | 1mo | $187,000 | $136 | 76 |
| 107 8th Ave NW | 0.32mi | 3/2.0 | 1,344 (-1%) | 8mo | $215,000 | $160 | 74 |
| 310 6th Ave NW | 0.42mi | 3/1.5 | 1,377 (+2%) | 7mo | $164,000 | $119 | 70 |
| 609 7th Ave SW | 0.25mi | 3/1.5 | 1,250 (-8%) | 5mo | $98,000 | $78 | 69 |
| 201 10th Ave NW | 0.47mi | 3/1.5 | 1,320 (-3%) | 12mo | $90,000 | $68 | 62 |
| 414 5th Ave SW | 0.06mi | 4/1.0 (+1) | 1,546 (+14%) | 10mo | $65,000 | $42 | 61 |
| 211 Prospect Dr SE | 0.60mi | 2/1.5 (-1) | 1,330 (-2%) | 3mo | $160,000 | $120 | 59 |
| 216 Cain St | 0.68mi | 3/2.0 | 1,450 (+7%) | 8mo | $239,000 | $165 | 46 |
| 819 3rd Ave SE | 0.71mi | 3/2.0 | 1,232 (-9%) | 3mo | $184,000 | $149 | 45 |
| 207 Cain St NE | 0.65mi | 2/2.0 (-1) | 1,234 (-9%) | 1mo | $80,000 | $65 | 45 |
| 606 14th Ave | 0.65mi | 3/2.0 | 1,500 (+11%) | 5mo | $50,000 | $33 | 44 |
Match score weights: distance 35% · size 25% · config 20% · recency 20%. Top-matched comps best support the ARV.
Projected returns pro-forma
-3.0% appreciation · 4.67% rent growth · sell at horizon
- IRR
- -4.4%
- Equity multiple
- 0.83×
- Total profit
- $-5,913
- Equity at exit
- $18,638
- IRR
- 7.1%
- Equity multiple
- 1.57×
- Total profit
- $20,110
- Equity at exit
- $10,808
Cash invested: $35,000 (down + closing). Projections, not guarantees.
Landlord ↔ Tenant lean methodology
- Overall (STATE)
- 90 Strongly Landlord-Friendly
- State Alabama
- 90 Strongly Landlord-Friendly · R+15
- County
- — inherits STATE
- City
- — inherits STATE
ZIP-level market 35601
- Home prices YoY
- -26.5%
- Rents YoY
- 4.7%
- Active inventory
- 223
- Price-to-rent
- 7.8×
Monthly cashflow live
- Estimated rent
- $1,333 high interval (Pro) →
- Mortgage (P&I)
- −$656
- Tax est. 1.5%
- −$156 /mo · $1,875/yr
- Insurance
- −$52
- HOA
- −$0
- Vacancy / Maint / Mgmt
- −$280
- Net cashflow
- $189
Break-even live
UW: 25.0% down · 7.5% · 30yr · 1.5% tax · 5.0% vac · 8.0% maint · 8.0% mgmt
Financing live
Cash to close
- Down payment
- $31,250
- Closing costs
- $3,750
- Reserves months
- —
- Total cash needed
- —
Loan-product check · same deal, 3 products live
Conventional
25% down · 7.5% · 30yr
- Down + closing
- —
- Monthly P&I
- —
- Monthly cashflow
- —
- DSCR
- —
- Eligible?
- —
Personal DTI + credit; lowest rate.
DSCR
20% down · 8.5% · 30yr
- Down + closing
- —
- Monthly P&I
- —
- Monthly cashflow
- —
- DSCR
- —
- Eligible?
- —
No personal income docs; deal must DSCR.
Hard money
10% down · 12.0% · 12mo
- Down + closing
- —
- Monthly P&I
- —
- Monthly cashflow
- —
- DSCR
- —
- Eligible?
- —
Short-term bridge; refi at stabilization.
Rent comps 16 comps
| Address | Beds | Baths | Sqft | Rent | $/sqft | DOM | Units | Dist |
|---|---|---|---|---|---|---|---|---|
| 609 7th Ave SW Decatur, AL | 4.0 | 2.0 | 1380 | $1,425 | $1.03 | 44d | 1 | 0.23mi |
| 225 5th Ave NW Decatur, AL | 3.0 | 2.0 | 1496 | $1,300 | $0.87 | 44d | 1 | 0.37mi |
| 220 8th Ave NW Decatur, AL | 3.0 | 1.0 | 973 | $1,125 | $1.16 | 44d | 1 | 0.40mi |
| 315 Hillside Rd SW Decatur, AL | 3.0 | 1.5 | 1344 | $1,400 | $1.04 | 44d | 1 | 0.78mi |
| 516 Ferry St NE Decatur, AL | 2.0 | 1.0 | 900 | $1,150 | $1.28 | 23d | 1 | 0.81mi |
| 14 Walnut St NE Decatur, AL | 3.0 | 2.5 | 1430 | $1,700 | $1.19 | 44d | 1 | 0.82mi |
| 603 Prospect Dr SE Decatur, AL | 3.0 | 1.0 | 1362 | $1,795 | $1.32 | 44d | 1 | 0.86mi |
| 818 Grant St SE Decatur, AL | 2.0 | 1.0 | 910 | $1,300 | $1.43 | 44d | 1 | 0.98mi |
| 1504 Faye St SW Decatur, AL | 3.0 | 2.0 | 1200 | $1,450 | $1.21 | 44d | 1 | 1.02mi |
| 213 Wilson St NE Unit 2 Decatur, AL | 2.0 | 1.0 | 975 | $875 | $0.90 | 23d | 1 | 1.02mi |
| 213 Wilson St NE Unit 4 Decatur, AL | 2.0 | 1.0 | 975 | $700 | $0.72 | 23d | 1 | 1.02mi |
| 1050 Harborview Dr NE Decatur, AL | 1.0–2.0 | 1.0–2.0 | 790 | $1,305 | $1.65 | 14d | 7 | 1.10mi |
| 604 Alma St NW Decatur, AL | 3.0 | 2.0 | 1350 | $1,325 | $0.98 | 21d | 1 | 1.10mi |
| 1018 Grant St SE Unit 1018-4 Decatur, AL | 2.0 | 1.0 | 890 | $775 | $0.87 | 44d | 1 | 1.12mi |
| 1018 Grant St SE Unit 1026-4 Decatur, AL | 2.0 | 1.0 | 890 | $800 | $0.90 | 44d | 1 | 1.13mi |
| 102 Elm Ct NE Decatur, AL | 3.0 | 1.0 | 1216 | $1,450 | $1.19 | 23d | 1 | 1.35mi |
Listing history 2 events
-
2026-06-19remarks 445-char remark
-
2026-06-19$125,000 Active 1 DOM
ⓘ Source: listings_history table (triggers on properties + properties_extension) + one-shot
backfill from property_details.listing_events for pre-trigger history.
Nearby sold comps map
Loading sold comps map…
Walkable amenities ~0.75 mi
Loading nearby amenities…
Taxation est. · year 1
- Rental income
- $15,994
- − Mortgage interest
- −$7,002
- − Property taxes
- −$1,875
- − Insurance
- −$625
- − Repairs & maintenance
- −$1,280
- − Management
- −$1,280
- − Depreciation
- −$3,636
- Taxable income
- $297
- Est. tax owed @ 24.0%
- −$71
- After-tax cash flow
- $2,198/yr
For passive investors: Depreciation is non-cash, so a rental often shows a tax loss while cash-flowing — sheltering income. Rental losses are passive: they offset passive income freely, and up to $25,000/yr can offset ordinary (W-2) income if you actively participate and your MAGI is under $100k (phasing out to $0 by $150k); unused losses carry forward. On sale, claimed depreciation is recaptured at up to 25%, and gains may owe capital-gains tax (a 1031 exchange can defer both). Figures are a year-1 estimate at your 24.0% rate — not tax advice; consult a CPA.
Schools (NCES district)
- District
- Decatur City
- NCES district ID
- 0101170
- Math proficiency
- 22% ▼ -27.00%
- Reading proficiency
- 40% ▼ -1.00%
- Median HH income
- $42,170
- Composite
- 26.21/100
- National rank
- #7261
- State rank
- #66 of 129 in AL
Livability — Decatur
- Score
- 72/100
- State rank
- #28
- US rank
- #5989
Category grades
Schools grade is shown separately in the Schools card above.
Census & demographics
- Census place
- Decatur, AL
- County
- Morgan County · 67,628 people
- City population
- 67,628
- Metro
- Decatur, AL
- Population (ZIP)
- 35,449
- Household income
- $51,429
- Rent vs Own
- Severe rent burden
- 1386.0
Population outlook (Morgan County) Hauer SSP2
- Today (2025)
- 118,775 people
- By 2030
- 116,979 · -1.5%
- By 2040
- 111,800 · -5.9%
- By 2050
- 105,181 · -11.4%
- By 2075
- 87,736 · -26.1%
- By 2100
- 67,624 · -43.1%
Race, ethnicity, and origin ACS 2023
- Neighborhood character
- Diverse neighborhood (Simpson 0.66)
- Race & ethnicity
- White 47% Hispanic / Latino 24% Black 24% Two or more races 10% Native American 2%
- Hispanic origin (detail)
- Mexican 15% Puerto Rican 2%
- Common ancestry
- Slovak 1% Italian 1% Lithuanian 1%
- Foreign-born
- 10% · Canada
- Languages at home
- 81% English-only · Spanish 18%
Political lean MEDSL · Morgan
- 2024 margin
- Solid R (+52.6) · D 23.2% · R 75.8%
- 2008→2024 swing
- -8.8pp toward R · 2008: -43.8pp · 2024: -52.6pp
- All cycles
- 2024: R+52.6 2020: R+49.2 2016: R+52.4 2012: R+44.5 2008: R+43.8
Not yet ingested
- Civics
- —
Market trends
- HPI YoY
- ▼ -89.26%
- Current HPI
- 247.8437
- Rent YoY
- ▲ 4.67%
- Metro
- Decatur, AL
- State GDP YoY
- ▲ 2.94%
- F500 in state
- 4
Industry mix (Fortune 500 HQ in AL)
| Industry | F500 HQs | Revenue |
|---|---|---|
| Financial Services | 1 | $8B |
|
||
| Healthcare | 1 | $5B |
|
||
Cash-flow waterfall
monthlySold comps — $/sqft
last 12 mo · ≤1 miLoading sold comps…