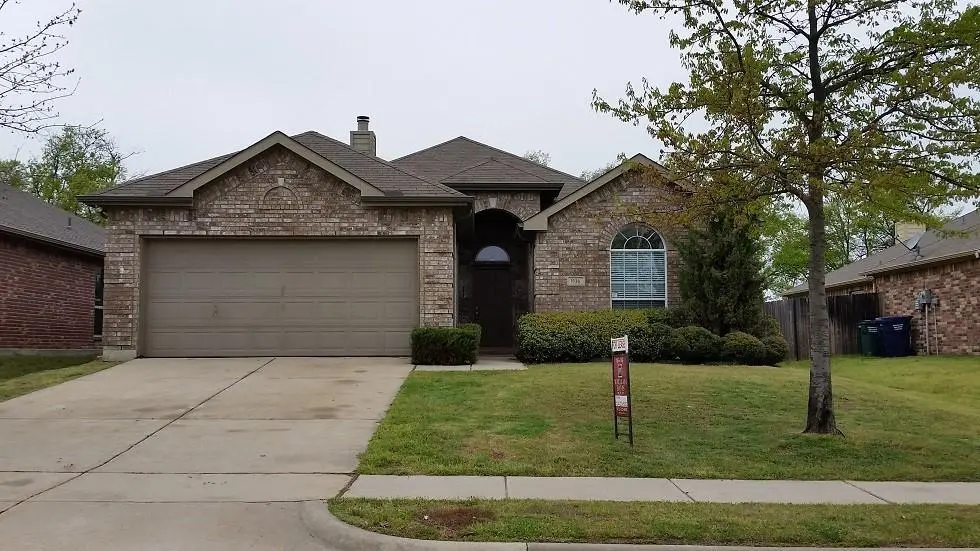
806 Bens Dr · Anna, TX
Flood risk 1/10 · Minimal
- FEMA flood zone
- X (unshaded)
- Chance of flooding over 30 yrs
- 0.0%
- Est. flood insurance / yr
- $507 – $1,088
Fire risk 6/10 · Moderate
- Est. fire insurance / yr
- $1,222 – $2,270
Heat risk 7/10 · Major
- Hot days now (above 110°F)
- 7 days/yr
- Hot days in 30 yrs
- 23 days/yr
Wind risk 5/10 · Moderate
- Chance of severe wind over 30 yrs
- 26.0%
Air-quality risk 3/10 · Minor
- Unhealthy air days now
- 3 days/yr
- Unhealthy air days in 30 yrs
- 3 days/yr
Risk factors via First Street. Map © Google.
Why this score? — see what drove the D grade
The composite is a weighted blend of 9 inputs, each scored 0–100. Each bar is that input's sub-score; the figure is the points it added to the 100-point composite (weight × sub-score).
- ARV discount +14.9/15.0
- Cash flow +8.0/30.0
- Schools +3.8/10.0
- Livability +3.8/5.0
- 1% rule +3.2/10.0
- Condition / age +2.5/5.0
- DSCR +2.0/10.0
- Rent growth +2.0/5.0
- Appreciation +0.0/10.0
$269,900
🖨 Deal sheet 📄 Offer letter ✓ Due diligence
Listing remarks MLS
Gorgeous 1 story well maintained home with 4 bedrooms, 2 bathrooms, with overside private back yard. The house has nice color with high ceiling. The floor is hardwood in the living room, tile in kitchen and baths and carpets in the bedrooms
Key facts
- Hardwood floor
- Tile in kitchen
- Private back yard
Tags
Neighborhood map
What this means for you Summary
Snapshot
- This is a 4-bed/2.0-bath single-family listed at $270k.
Deal economics
- At list price, monthly cash flow is $-278 ($-3k/yr) — negative.
- To cash-flow at today's rent, offer at most $221k (18.2% below list).
- To meet the 1% rule (rent ≥ 1% of price), the offer needs to be $222k (17.7% below list).
- Recommended offer: $221k (18.2% below list) — sets the bar for cash-flow.
- Cap rate 5.1% vs local median 3.6% in Anna — top-decile yield for the area; either an underpriced asset or a hidden risk that comps aren't pricing in. Stress-test before assuming the spread holds.
Location & tenants
- Location reads 75/100 on livability (#127 in TX, #3,880 nationally) — a middle-class / working-renter tenant base. Strengths: employment A+, housing A+, crime A; Watch: amenities F, commute F.
- Anna ISD (rural): math 44% / reading 41% proficiency, ranked #271 of 826 in TX (top 33%) — families likely to look elsewhere, expect single-tenant / working-renter base with shorter leases.
- Market conditions: Rents soft (-1.9%/yr); 1199 active listings in the ZIP; 40 comparable units currently listed for rent nearby; rentals at typical pace (median 25d on market — plan ~3-4 weeks tenant-placement turnaround); 48% of comp listings sitting > 30 days — soft ceiling on asking rent; solid renter incomes; 19,194 units permitted in Collin County in 2024 (3,988 in 5+ unit buildings).
Forward outlook
- Local home prices are declining (-3.0%/yr); year-one equity from $2k of loan paydown is wiped out by about $8k of value loss. Plan a longer hold.
- Collin County population projected at +60% by 2050 — long-run rental-demand tailwind backs the buy-and-hold thesis.
Negotiation context
- It's been on market 115 days — a 9% lower offer ($246k) is reasonable based on typical stale-listing flexibility.
- 9 sale attempts since 21y ago; this cycle's ask has dropped $20k (7%) from the opening price — seller is motivated, your offer sets the floor, not the list.
Risks & watch-outs
- Climate carrying-cost: moderate wind risk, 26% chance of damaging wind over 30y; major wildfire risk; extreme-heat days projected 7→23/yr by 2055 (HVAC capex compounding) — expect insurance premiums to compound above CPI over the hold.
Questions for the listing agent
- What do current leases actually rent for vs. the listed asking? Can we see a recent rent roll and the last 12 months of T-12 income?
- It's been on market 115 days. Have you received any prior offers? Is the seller open to a 18% concession, seller financing, or rate buy-down credit?
- What does the HOA fee cover, when was the last increase, and are there any pending special assessments or reserve-fund shortfalls?
- Why hasn't it sold? Are there any deal-killer items the seller is aware of (foundation, flood, title, zoning, code violations)?
- Is there a deadline driving the sale (1031 exchange, divorce, estate, relocation)? That informs how much negotiation room exists.
- Schools are B-rated — typically a magnet for longer-tenancy family renters. What's the average tenant stay here, and is there a school-zone premium baked into asking?
- The area grade is low — what's the realistic commute time and amenity access for the typical tenant pool here? Any planned neighborhood developments (good or bad) we should know about?
- What's the average days-on-market for RENTAL listings here right now (not sales)? A rising rental-DOM trend means longer vacancies and softer asking-rent achievability than the comps imply.
- What's the recent tenant-quality profile in this submarket — average credit score on applications, eviction rate, late-payment / NSF rate, and stable-employment percentage? A property-management company in the area should have these aggregated.
- How much new for-sale + rental construction is in the pipeline within 1–3 miles? Heavy new supply typically softens prices + rents 12–24 months out; constrained supply supports both.
Investment metrics
- 1% rule
- 0.82% ✗
- Cap rate
- 5.06%
- Cash-on-cash
- -4.42%
- DSCR
- 0.80
- GRM
- 10.1
CMA / ARV
- ARV (median comp)
- $322,691
- List price
- $269,900
- Delta
- -16.36%
- Verdict
- UNDERPRICED
- Comps
- 20 within 1.0 mi
Show comp detail 12 sales within ~0.75 mi
| Address | Dist | Beds/Ba | Sqft | Sold | Price | $/sf | Match |
|---|---|---|---|---|---|---|---|
| 417 Waterton Dr | 0.37mi | 3/2.0 (-1) | 1,602 (+0%) | 3mo | $315,000 | $197 | 75 |
| 709 Westwood Ct | 0.22mi | 4/2.0 | 1,730 (+8%) | 3mo | $284,900 | $165 | 73 |
| 408 Buffalo Bill Dr | 0.35mi | 3/2.0 (-1) | 1,660 (+4%) | 2mo | $269,990 | $163 | 70 |
| 212 Bonsai Dr | 0.44mi | 3/2.0 (-1) | 1,652 (+4%) | 3mo | $289,000 | $175 | 66 |
| 125 Pagoda Dr | 0.48mi | 3/2.0 (-1) | 1,659 (+4%) | 2mo | $300,000 | $181 | 64 |
| 1516 Avery Pointe Dr | 0.65mi | 4/2.0 | 1,726 (+8%) | 1mo | $295,000 | $171 | 55 |
| 209 Kelvington Dr | 0.64mi | 3/2.0 (-1) | 1,503 (-6%) | 3mo | $325,000 | $216 | 53 |
| 1132 Foxtail Dr | 0.73mi | 3/2.0 (-1) | 1,689 (+6%) | 0mo | $295,000 | $175 | 51 |
| 911 Live Oak Dr | 0.58mi | 3/2.0 (-1) | 1,388 (-13%) | 3mo | $239,900 | $173 | 44 |
| 1205 Ash St | 0.60mi | 3/2.0 (-1) | 1,388 (-13%) | 2mo | $279,900 | $202 | 44 |
| 910 Fulbourne Dr | 0.68mi | 3/2.0 (-1) | 1,760 (+10%) | 4mo | $315,000 | $179 | 43 |
| 1618 Pin Oak Trl | 0.65mi | 3/2.0 (-1) | 1,369 (-14%) | 3mo | $215,000 | $157 | 39 |
Match score weights: distance 35% · size 25% · config 20% · recency 20%. Top-matched comps best support the ARV.
Projected returns pro-forma
-3.0% appreciation · 0.0% rent growth · sell at horizon
- IRR
- -27.5%
- Equity multiple
- 0.10×
- Total profit
- $-67,836
- Equity at exit
- $40,243
- IRR
- -43.9%
- Equity multiple
- -0.41×
- Total profit
- $-106,496
- Equity at exit
- $23,336
Cash invested: $75,572 (down + closing). Projections, not guarantees.
Landlord ↔ Tenant lean methodology
- Overall (STATE)
- 87 Strongly Landlord-Friendly
- State Texas
- 87 Strongly Landlord-Friendly · R+5
- County
- — inherits STATE
- City
- — inherits STATE
ZIP-level market 75409
- Home prices YoY
- -20.1%
- Rents YoY
- -1.9%
- Active inventory
- 1199
- Price-to-rent
- 10.1×
Monthly cashflow live
- Estimated rent
- $2,221 high interval (Pro) →
- Mortgage (P&I)
- −$1,415
- Tax from tax record
- −$476 /mo · $5,712/yr
- Insurance
- −$112
- HOA
- −$29
- Vacancy / Maint / Mgmt
- −$466
- Net cashflow
- $-278
Break-even live
UW: 25.0% down · 7.5% · 30yr · 1.5% tax · 5.0% vac · 8.0% maint · 8.0% mgmt
Financing live
Cash to close
- Down payment
- $67,475
- Closing costs
- $8,097
- Reserves months
- —
- Total cash needed
- —
Loan-product check · same deal, 3 products live
Conventional
25% down · 7.5% · 30yr
- Down + closing
- —
- Monthly P&I
- —
- Monthly cashflow
- —
- DSCR
- —
- Eligible?
- —
Personal DTI + credit; lowest rate.
DSCR
20% down · 8.5% · 30yr
- Down + closing
- —
- Monthly P&I
- —
- Monthly cashflow
- —
- DSCR
- —
- Eligible?
- —
No personal income docs; deal must DSCR.
Hard money
10% down · 12.0% · 12mo
- Down + closing
- —
- Monthly P&I
- —
- Monthly cashflow
- —
- DSCR
- —
- Eligible?
- —
Short-term bridge; refi at stabilization.
Rent comps 40 comps
| Address | Beds | Baths | Sqft | Rent | $/sqft | DOM | Units | Dist |
|---|---|---|---|---|---|---|---|---|
| 809 Bens Dr Anna, TX | 4.0 | 2.5 | 1803 | $1,925 | $1.07 | 6d | 1 | 0.01mi |
| 818 Hazels Way Anna, TX | 3.0 | 2.0 | 1402 | $1,750 | $1.25 | 24d | 1 | 0.10mi |
| 826 Hazels Way Anna, TX | 4.0 | 2.5 | 2084 | $2,400 | $1.15 | 43d | 1 | 0.10mi |
| 704 Westgate Ct Anna, TX | 3.0 | 2.0 | 1580 | $1,998 | $1.26 | 18d | 1 | 0.11mi |
| 1100 Oliver Dr Anna, TX | 4.0 | 2.5 | 1740 | $2,075 | $1.19 | 43d | 1 | 0.13mi |
| 921 Isabel Dr Anna, TX | 3.0 | 2.5 | 1869 | $2,370 | $1.27 | 43d | 1 | 0.14mi |
| 904 Isabel Dr Anna, TX | 4.0 | 2.5 | 2046 | $2,475 | $1.21 | 43d | 1 | 0.15mi |
| 1116 Oliver Dr Anna, TX | 4.0 | 2.5 | 1609 | $2,035 | $1.26 | 43d | 1 | 0.15mi |
| 729 Bamboo Dr Anna, TX | 3.0 | 2.0 | 1659 | $1,825 | $1.10 | 43d | 1 | 0.20mi |
| 721 Bamboo Dr Anna, TX | 3.0 | 2.0 | 1490 | $1,795 | $1.20 | 2d | 1 | 0.21mi |
| 716 Alder Dr Anna, TX | 3.0 | 2.0 | 1896 | $1,995 | $1.05 | 43d | 1 | 0.28mi |
| 1220 S Powell Pkwy Anna, TX | 2.0–4.0 | 2.0 | 1135 | $2,022 | $1.78 | 1d | 34 | 0.34mi |
| 308 Dogwood Dr Anna, TX | 3.0 | 2.0 | 1390 | $1,950 | $1.40 | 43d | 1 | 0.35mi |
| 717 Mahogany Dr Anna, TX | 3.0 | 2.0 | 1659 | $1,750 | $1.05 | 43d | 1 | 0.35mi |
| 1302 Deerfield Dr Anna, TX | 4.0 | 2.0 | 1835 | $2,200 | $1.20 | 18d | 1 | 0.48mi |
| 213 Cedar Canyon Dr Anna, TX | 4.0 | 2.5 | 2234 | $2,295 | $1.03 | 43d | 1 | 0.54mi |
| 421 S Interurban St Anna, TX | 3.0 | 2.0 | 1344 | $1,850 | $1.38 | 43d | 1 | 0.54mi |
| 174 Cunningham Blvd Anna, TX | 3.0 | 1.0 | 1106 | $1,650 | $1.49 | 22d | 1 | 0.58mi |
| 1313 Forest Haven Dr Anna, TX | 4.0 | 2.5 | 2154 | $2,750 | $1.28 | 5d | 1 | 0.59mi |
| 907 Live Oak Dr Anna, TX | 3.0 | 2.0 | 1789 | $1,850 | $1.03 | 43d | 1 | 0.60mi |
| 817 Live Oak Dr Anna, TX | 3.0 | 2.0 | 1294 | $1,695 | $1.31 | 1d | 1 | 0.60mi |
| 817 Live Oak Dr Anna, TX | 3.0 | 2.0 | 1294 | $1,695 | $1.31 | 7d | 1 | 0.60mi |
| 112 Birdbrook Dr Anna, TX | 3.0 | 2.0 | 1700 | $1,850 | $1.09 | 43d | 1 | 0.60mi |
| 405 Laurenbrooke Dr Anna, TX | 4.0 | 2.0 | 1726 | $2,300 | $1.33 | 43d | 1 | 0.61mi |
| 1132 Honeywell Dr Anna, TX | 3.0 | 2.0 | 1576 | $1,850 | $1.17 | 3d | 1 | 0.62mi |
| 1601 Black Oak Ct Anna, TX | 3.0 | 2.0 | 1369 | $1,700 | $1.24 | 43d | 1 | 0.62mi |
| 1519 River Crossing Dr Anna, TX | 3.0 | 2.0 | 1281 | $1,800 | $1.41 | 43d | 1 | 0.62mi |
| 300 Kelvington Dr Anna, TX | 4.0 | 2.0 | 2045 | $2,195 | $1.07 | 18d | 1 | 0.67mi |
| 1626 White Oak Rd Anna, TX | 3.0 | 2.0 | 2000 | $1,900 | $0.95 | 12d | 1 | 0.68mi |
| 1614 River Crossing Dr Anna, TX | 3.0 | 2.0 | 1302 | $1,686 | $1.29 | 7d | 1 | 0.69mi |
| 1601 Elm St Anna, TX | 3.0 | 2.0 | 1388 | $1,850 | $1.33 | 24d | 1 | 0.69mi |
| 1618 Sherwood Dr Anna, TX | 4.0 | 3.0 | 1963 | $2,300 | $1.17 | 43d | 1 | 0.73mi |
| 1605 Fields View Dr Anna, TX | 4.0 | 2.5 | 2111 | $2,195 | $1.04 | 20d | 1 | 0.75mi |
| 1809 River Crossing Dr Anna, TX | 3.0 | 2.0 | 1522 | $1,900 | $1.25 | 18d | 1 | 0.76mi |
| 906 Post Oak Trl Anna, TX | 4.0 | 2.0 | 1736 | $1,895 | $1.09 | 43d | 1 | 0.77mi |
| 512 Eastbrook Dr Anna, TX | 4.0 | 2.0 | 2056 | $3,200 | $1.56 | 24d | 1 | 0.78mi |
| 305 Tartane Dr Anna, TX | 3.0 | 2.0 | 1774 | $2,150 | $1.21 | 7d | 1 | 0.79mi |
| 521 Eastbrook Dr Anna, TX | 3.0 | 2.0 | 1664 | $1,950 | $1.17 | 43d | 1 | 0.80mi |
| 1113 Sheldon Dr Anna, TX | 4.0 | 3.0 | 2095 | $2,380 | $1.14 | 24d | 1 | 0.80mi |
| 1703 Stonefield Dr Anna, TX | 3.0 | 2.0 | 1516 | $1,995 | $1.32 | 5d | 1 | 0.81mi |
HOA detail
- Monthly dues
- $29 · $348/yr
Listing history 37 events
-
2026-06-18days on market $269,900 Active 115 DOM
-
2026-06-17days on market $269,900 Active 114 DOM
-
2026-06-16days on market $269,900 Active 113 DOM
-
2026-06-15days on market $269,900 Active 112 DOM
-
2026-06-13days on market $269,900 Active 110 DOM
-
2026-06-13days on market $269,900 Active 109 DOM
-
2026-06-09days on market $269,900 Active 106 DOM
-
2026-06-08days on market $269,900 Active 105 DOM
-
2026-06-07days on market $269,900 Active 104 DOM
-
2026-06-04days on market $269,900 Active 101 DOM
-
2026-06-03days on market $269,900 Active 100 DOM
-
2026-06-02days on market $269,900 Active 99 DOM
-
2026-06-01days on market $269,900 Active 98 DOM
-
2026-05-31days on market $269,900 Active 97 DOM
-
2026-04-20price $274,900 243-char remark
Show marketing remark (243 chars)
Gorgeous 1 story well maintained home with 4 bedrooms, 2 bathrooms, with overside private back yard. The house has nice color with high ceiling. The floor is hardwood in the living room, tile in kitchen and baths and carpets in the bedrooms
-
2026-04-13price $279,900 243-char remark
Show marketing remark (243 chars)
Gorgeous 1 story well maintained home with 4 bedrooms, 2 bathrooms, with overside private back yard. The house has nice color with high ceiling. The floor is hardwood in the living room, tile in kitchen and baths and carpets in the bedrooms
-
2026-02-02$289,900 Active 243-char remark
Show marketing remark (243 chars)
Gorgeous 1 story well maintained home with 4 bedrooms, 2 bathrooms, with overside private back yard. The house has nice color with high ceiling. The floor is hardwood in the living room, tile in kitchen and baths and carpets in the bedrooms
-
2025-12-31historical
-
2025-11-02$289,900 Active
-
2025-10-01historical $1,895
-
2025-09-30historical
-
2025-09-11price $293,900
-
2025-08-26price $1,895
-
2025-08-16$1,995
-
2025-07-22price $294,900
-
2025-07-08$299,900 Active
-
2025-07-08historical $1,995
-
2025-06-13$1,995
-
2024-06-07historical $2,100
-
2024-05-17$2,100
-
2024-05-10historical $2,000
-
2024-04-30$2,000
-
2014-01-29historical
-
2013-04-09$125,000 Active
-
2006-02-24soldstatus
-
2006-02-05historical
-
2005-09-08$157,332
ⓘ Source: listings_history table (triggers on properties + properties_extension) + one-shot
backfill from property_details.listing_events for pre-trigger history.
Tax reassessment forecast TX · Resets to sale price
- Current annual tax
- $5,712 · $476/mo
- Projected year-2 tax
- $5,712 · $476/mo
- Expected delta
- $0/yr ($0/mo · 0.0%)
ⓘ Screening estimate from a state-policy table — verify with the county assessor before closing.
Climate risk First Street
- Flood 1/10 Low FEMA zone X (unshaded) · 0% chance over 30 yrs
- Wildfire 6/10 Major
- Heat 7/10 Severe 7 d/yr ≥110°F today · 23 d/yr by 30 yrs out
- Wind 5/10 Major 26% chance of damaging wind over 30 yrs
- Air quality 3/10 Moderate 3 unhealthy d/yr today · 3 by 30 yrs out
Nearby sold comps map
Loading sold comps map…
Walkable amenities ~0.75 mi
Loading nearby amenities…
Taxation est. · year 1
- Rental income
- $26,651
- − Mortgage interest
- −$15,119
- − Property taxes
- −$5,712
- − Insurance
- −$1,350
- − Repairs & maintenance
- −$2,132
- − Management
- −$2,132
- − HOA
- −$348
- − Depreciation
- −$7,852
- Taxable loss
- −$7,993
- Est. tax savings @ 24.0%
- +$1,918
- After-tax cash flow
- $-1,422/yr
For passive investors: Depreciation is non-cash, so a rental often shows a tax loss while cash-flowing — sheltering income. Rental losses are passive: they offset passive income freely, and up to $25,000/yr can offset ordinary (W-2) income if you actively participate and your MAGI is under $100k (phasing out to $0 by $150k); unused losses carry forward. On sale, claimed depreciation is recaptured at up to 25%, and gains may owe capital-gains tax (a 1031 exchange can defer both). Figures are a year-1 estimate at your 24.0% rate — not tax advice; consult a CPA.
Schools (NCES district)
- District
- Anna ISD
- NCES district ID
- 4808340
- Math proficiency
- 44% ▼ -9.00%
- Reading proficiency
- 41% ▼ -4.00%
- Median HH income
- $67,456
- Composite
- 38.26/100
- National rank
- #4241
- State rank
- #271 of 826 in TX
Livability — Anna
- Score
- 75/100
- State rank
- #127
- US rank
- #3880
Category grades
Schools grade is shown separately in the Schools card above.
Census & demographics
- Census place
- Anna, TX
- County
- Collin County · 1,159,394 people
- City population
- 27,131
- Metro
- Dallas-Fort Worth-Arlington, TX
- Population (ZIP)
- 27,131
- Household income
- $104,814
- Rent vs Own
- Severe rent burden
- 454.0
Population outlook (Collin County) Hauer SSP2
- Today (2025)
- 1,210,074 people
- By 2030
- 1,358,201 · +12.2%
- By 2040
- 1,654,061 · +36.7%
- By 2050
- 1,937,359 · +60.1%
- By 2075
- 2,567,039 · +112.1%
- By 2100
- 2,952,048 · +144.0%
Race, ethnicity, and origin ACS 2023
- Neighborhood character
- Diverse neighborhood (Simpson 0.56)
- Race & ethnicity
- White 61% Hispanic / Latino 20% Black 15% Two or more races 6% Asian 1%
- Hispanic origin (detail)
- Mexican 16% Puerto Rican 1%
- Common ancestry
- Italian 3% Lithuanian 2% Slovak 1%
- Foreign-born
- 10% · Canada
- Languages at home
- 79% English-only · Spanish 18% French/Haitian/Cajun 2%
Political lean MEDSL · Collin
- 2024 margin
- R (+11.1) · D 43.1% · R 54.3% · Other 2.6%
- 2008→2024 swing
- +14.4pp toward D · 2008: -25.6pp · 2024: -11.1pp
- All cycles
- 2024: R+11.1 2020: R+4.3 2016: R+17.0 2012: R+31.6 2008: R+25.6
Not yet ingested
- Civics
- —
Market trends
- HPI YoY
- ▼ -58.99%
- Current HPI
- 235.0945
- Rent YoY
- ▼ -1.92%
- Metro
- Dallas-Fort Worth-Arlington, TX
- State GDP YoY
- ▲ 3.95%
- F500 in state
- 110
Industry mix (Fortune 500 HQ in TX)
| Industry | F500 HQs | Revenue |
|---|---|---|
| Energy | 16 | $1,198B |
|
||
| Technology | 5 | $198B |
|
||
| Engineering / Construction | 4 | $72B |
|
||
| Energy Services | 3 | $60B |
|
||
| Utilities | 3 | $41B |
|
||
| Healthcare | 2 | $330B |
|
||
Price history
+74.7% since first listed23 events — show timeline
- 2026-04-20 Price Changed $274,900 NTREIS
- 2026-04-13 Price Changed $279,900 NTREIS
- 2026-02-02 Listed $289,900 NTREIS
- 2025-12-31 Listing Removed — NTREIS
- 2025-11-02 Listed $289,900 NTREIS
- 2025-10-01 Rental Removed $1,895 NTREIS
- 2025-09-30 Listing Removed — NTREIS
- 2025-09-11 Price Changed $293,900 NTREIS
- 2025-08-26 Price Changed $1,895 NTREIS
- 2025-08-16 Listed for Rent $1,995 NTREIS
- 2025-07-22 Price Changed $294,900 NTREIS
- 2025-07-08 Listed $299,900 NTREIS
- 2025-07-08 Rental Removed $1,995 NTREIS
- 2025-06-13 Listed for Rent $1,995 NTREIS
- 2024-06-07 Rental Removed $2,100 NTREIS
- 2024-05-17 Listed for Rent $2,100 NTREIS
- 2024-05-10 Rental Removed $2,000 NTREIS
- 2024-04-30 Listed for Rent $2,000 NTREIS
- 2014-01-29 Listing Removed — NTREIS
- 2013-04-09 Listed $125,000 NTREIS
- 2006-02-24 Sold (MLS) — NTREIS
- 2006-02-05 Listing Removed — NTREIS
- 2005-09-08 Listed $157,332 NTREIS
Property tax history
+4.2%/yrLatest (2025): $5,712 · -7.2% YoY. Source: county tax records.
Cash-flow waterfall
monthlySold comps — $/sqft
last 12 mo · ≤1 miLoading sold comps…