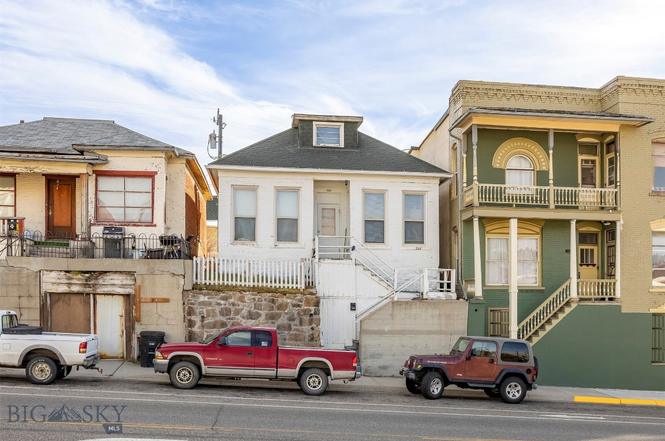
522 W Park St · Butte-Silver Bow (balance), MT
Flood risk 1/10 · Minimal
- FEMA flood zone
- X (unshaded)
- Chance of flooding over 30 yrs
- 0.0%
- Est. flood insurance / yr
- $473 – $860
Fire risk 5/10 · Moderate
- Est. fire insurance / yr
- $918 – $1,706
Heat risk 1/10 · Minimal
- Hot days now (above 86°F)
- 6 days/yr
- Hot days in 30 yrs
- 14 days/yr
Wind risk 1/10 · Minimal
- Chance of severe wind over 30 yrs
- —
Air-quality risk 9/10 · Severe
- Unhealthy air days now
- 19 days/yr
- Unhealthy air days in 30 yrs
- 26 days/yr
Risk factors via First Street. Map © Google.
Why this score? — see what drove the D grade
The composite is a weighted blend of 9 inputs, each scored 0–100. Each bar is that input's sub-score; the figure is the points it added to the 100-point composite (weight × sub-score).
- Cash flow +14.4/30.0
- ARV discount +7.7/15.0
- Rent growth +5.0/5.0
- DSCR +4.4/10.0
- 1% rule +3.4/10.0
- Schools +3.1/10.0
- Livability +2.5/5.0
- Condition / age +2.5/5.0
- Appreciation +0.0/10.0
$160,000
🖨 Deal sheet (PDF) 📄 Offer letter ✓ Due diligence
Listing remarks MLS
Remarks: Darling 2 bedroom and 1 bath just blocks from MT Tech! Home is very well taken care of and ready for new owners. Priced for quick sale.
Key facts
- Off street parking
- Living room
- Dining area
Tags
Property features AI
Exterior
- Parking: Attached garage (1 car)
- Utilities: Public water; Public sewer; Sewer and water available
- Home design: Single-family residence; Two levels
- Exterior features: Public water and sewer available; Lot zoned R3
Interior
- Bathrooms: One full bathroom
- Heating & cooling: Floor furnace heating; No central or room cooling
- Interior features: Floor furnace heating
Neighborhood map
What this means for you Summary
Snapshot
- This is a 2-bed/1.0-bath single-family listed at $160k.
Deal economics
- At list price, monthly cash flow is $33 ($393/yr) — positive.
- The deal already cash-flows at list — no discount required.
- To meet the 1% rule (rent ≥ 1% of price), the offer needs to be $134k (16.0% below list).
- Recommended offer: $134k (16.0% below list) — sets the bar for 1% rule.
- Cap rate 6.5% vs local median 2.9% in Butte-Silver Bow (balance) — top-decile yield for the area; either an underpriced asset or a hidden risk that comps aren't pricing in. Stress-test before assuming the spread holds.
Location & tenants
- Location reads: area grade D — affects rentability + tenant quality, not the cash-flow math above.
- Butte H S (town): math 24% / reading 50% proficiency, ranked #73 of 116 in MT (top 63%) — families likely to look elsewhere, expect single-tenant / working-renter base with shorter leases.
- Zoned schools: West Elementary School (math 32% / reading 40%, grade F, #194 of 293 statewide, top 66%, 473 students, 0% FRL); East Middle School (math 26% / reading 44%, grade F, #85 of 146 statewide, top 59%, 660 students, 0% FRL); Butte High School (math 24% / reading 50%, grade F, #48 of 132 statewide, top 37%, 1,317 students, 0% FRL).
- Market conditions: Rents rising fast (+10.4%/yr); 324 active listings in the ZIP; 109 units permitted in Silver Bow County in 2024 (25 in 5+ unit buildings).
Forward outlook
- Local home prices are declining (-3.0%/yr); year-one equity from $1k of loan paydown is wiped out by about $5k of value loss. Plan a longer hold.
- Silver Bow County population projected at +8% by 2050 — modest demand growth; plan on rents tracking national, not racing it.
Negotiation context
- It's been on market 219 days — a 12% lower offer ($141k) is reasonable based on typical stale-listing flexibility.
- 3 sale attempts since 12y ago; this cycle's ask has dropped $47k (23%) from the opening price — seller is motivated, your offer sets the floor, not the list.
Risks & watch-outs
- Watch-outs: built in 1880 — expect roof / HVAC / electrical / plumbing capex.
- Climate carrying-cost: moderate wildfire risk — expect insurance premiums to compound above CPI over the hold.
Questions for the listing agent
- It's been on market 219 days. Have you received any prior offers? Is the seller open to a 16% concession, seller financing, or rate buy-down credit?
- Built in 1880 — when were the roof, HVAC, electrical panel, plumbing, and water heater last replaced?
- Why hasn't it sold? Are there any deal-killer items the seller is aware of (foundation, flood, title, zoning, code violations)?
- Is there a deadline driving the sale (1031 exchange, divorce, estate, relocation)? That informs how much negotiation room exists.
- The area grade is low — what's the realistic commute time and amenity access for the typical tenant pool here? Any planned neighborhood developments (good or bad) we should know about?
- What's the average days-on-market for RENTAL listings here right now (not sales)? A rising rental-DOM trend means longer vacancies and softer asking-rent achievability than the comps imply.
- What's the recent tenant-quality profile in this submarket — average credit score on applications, eviction rate, late-payment / NSF rate, and stable-employment percentage? A property-management company in the area should have these aggregated.
- How much new for-sale + rental construction is in the pipeline within 1–3 miles? Heavy new supply typically softens prices + rents 12–24 months out; constrained supply supports both.
Investment metrics
- 1% rule
- 0.84% ✗
- Cap rate
- 6.54%
- Cash-on-cash
- 0.88%
- DSCR
- 1.04
- GRM
- 9.9
CMA / ARV
- ARV (on-the-fly)
- $160,818
- Comps found
- 12
Show comp detail 12 sales within ~0.75 mi
| Address | Dist | Beds/Ba | Sqft | Sold | Price | $/sf | Match |
|---|---|---|---|---|---|---|---|
| 717 W Quartz St | 0.22mi | 2/1.0 | 1,162 (+6%) | 11mo | $185,000 | $159 | 70 |
| 1215 N Excelsior Ave | 0.72mi | 2/1.0 | 1,087 (-1%) | 2mo | $227,100 | $209 | 64 |
| 407 W Quartz St | 0.22mi | 1/1.0 (-1) | 1,000 (-9%) | 10mo | $118,500 | $119 | 62 |
| 814 Caledonia St | 0.31mi | 2/1.0 | 1,243 (+14%) | 3mo | $165,000 | $133 | 60 |
| 797 Hornet St | 0.61mi | 2/1.0 | 1,120 (+2%) | 11mo | $165,000 | $147 | 58 |
| 221 N Idaho St | 0.26mi | 2/1.5 | 1,200 (+10%) | 16mo | $269,000 | $224 | 56 |
| 729 N Main Street St | 0.68mi | 2/1.0 | 1,126 (+3%) | 12mo | $85,000 | $75 | 54 |
| 57 W Platinum St | 0.52mi | 1/1.0 (-1) | 1,144 (+5%) | 15mo | $155,000 | $135 | 51 |
| 311 W Quartz St | 0.26mi | 2/1.0 | 1,250 (+14%) | 18mo | $149,900 | $120 | 49 |
| 837 Zarelda St | 0.69mi | 3/1.0 (+1) | 1,157 (+6%) | 6mo | $150,000 | $130 | 48 |
| 601 S Idaho St | 0.42mi | 2/1.0 | 931 (-15%) | 12mo | $210,000 | $226 | 46 |
| 1147 W Woolman St | 0.59mi | 2/2.0 | 1,254 (+15%) | 12mo | $295,000 | $235 | 34 |
Match score weights: distance 35% · size 25% · config 20% · recency 20%. Top-matched comps best support the ARV.
Projected returns pro-forma
-3.0% appreciation · 8.0% rent growth · sell at horizon
- IRR
- -9.8%
- Equity multiple
- 0.63×
- Total profit
- $-16,764
- Equity at exit
- $23,857
- IRR
- 5.1%
- Equity multiple
- 1.45×
- Total profit
- $20,303
- Equity at exit
- $13,834
Cash invested: $44,800 (down + closing). Projections, not guarantees.
Landlord ↔ Tenant lean methodology
- Overall (STATE)
- 82 Strongly Landlord-Friendly
- State Montana
- 82 Strongly Landlord-Friendly · R+11
- County
- — inherits STATE
- City
- — inherits STATE
ZIP-level market 59701
- Home prices YoY
- -30.7%
- Rents YoY
- 10.4%
- Active inventory
- 324
- Price-to-rent
- 9.9×
Monthly cashflow live
- Estimated rent
- $1,344 medium interval (Pro) →
- Mortgage (P&I)
- −$839
- Tax from tax record
- −$123 /mo · $1,476/yr
- Insurance
- −$67
- HOA
- −$0
- Vacancy / Maint / Mgmt
- −$282
- Net cashflow
- $33
Break-even live
Sensitivity live
| Price | -10% $123 | -5% $78 | +0% $33 | +5% $-12 | +10% $-58 |
|---|---|---|---|---|---|
| Rent | -10% $-73 | -5% $-20 | +0% $33 | +5% $86 | +10% $139 |
| Rate | -1.0pp $113 | -0.5pp $73 | base $33 | +0.5pp $-9 | +1.0pp $-51 |
UW: 25.0% down · 7.5% · 30yr · 1.5% tax · 5.0% vac · 8.0% maint · 8.0% mgmt
Financing live
Cash to close
- Down payment
- $40,000
- Closing costs
- $4,800
- Reserves months
- —
- Total cash needed
- —
Loan-product check · same deal, 3 products live
Conventional
25% down · 7.5% · 30yr
- Down + closing
- —
- Monthly P&I
- —
- Monthly cashflow
- —
- DSCR
- —
- Eligible?
- —
Personal DTI + credit; lowest rate.
DSCR
20% down · 8.5% · 30yr
- Down + closing
- —
- Monthly P&I
- —
- Monthly cashflow
- —
- DSCR
- —
- Eligible?
- —
No personal income docs; deal must DSCR.
Hard money
10% down · 12.0% · 12mo
- Down + closing
- —
- Monthly P&I
- —
- Monthly cashflow
- —
- DSCR
- —
- Eligible?
- —
Short-term bridge; refi at stabilization.
Listing history 29 events
-
2026-06-21days on market $160,000 Active 219 DOM
-
2026-06-19days on market $160,000 Active 217 DOM
-
2026-06-18days on market $160,000 Active 216 DOM
-
2026-06-17days on market $160,000 Active 215 DOM
-
2026-06-16days on market $160,000 Active 214 DOM
-
2026-06-15days on market $160,000 Active 213 DOM
-
2026-06-14days on market $160,000 Active 211 DOM
-
2026-06-12days on market $160,000 Active 210 DOM
-
2026-06-09days on market $160,000 Active 207 DOM
-
2026-06-08days on market $160,000 Active 206 DOM
-
2026-06-07days on market $160,000 Active 205 DOM
-
2026-06-05days on market $160,000 Active 202 DOM
-
2026-06-03days on market $160,000 Active 201 DOM
-
2026-06-02days on market $160,000 Active 200 DOM
-
2026-06-01days on market $160,000 Active 199 DOM
-
2026-05-31days on market $160,000 Active 198 DOM
-
2026-05-30days on market $160,000 Active 197 DOM
-
2026-04-16historical Active Under Contract
-
2026-04-13price $185,000
-
2026-03-18price $200,000
-
2025-11-13$207,000 Active
-
2017-03-22soldstatus 144-char remark
Show marketing remark (144 chars)
Remarks: Darling 2 bedroom and 1 bath just blocks from MT Tech! Home is very well taken care of and ready for new owners. Priced for quick sale.
-
2017-01-09$69,500 144-char remark
Show marketing remark (144 chars)
Remarks: Darling 2 bedroom and 1 bath just blocks from MT Tech! Home is very well taken care of and ready for new owners. Priced for quick sale.
-
2014-08-25soldstatus 61-char remark
Show marketing remark (61 chars)
Remarks: Near Montana Tech University and ST. James Hospital.
-
2014-04-23$52,500 61-char remark
Show marketing remark (61 chars)
Remarks: Near Montana Tech University and ST. James Hospital.
-
2007-06-27soldstatus
-
2007-03-12soldstatus
-
1996-05-03soldstatus
-
1995-02-09soldstatus
ⓘ Source: listings_history table (triggers on properties + properties_extension) + one-shot
backfill from property_details.listing_events for pre-trigger history.
Tax reassessment forecast MT · Resets to sale price
- Current annual tax
- $1,476 · $123/mo
- Projected year-2 tax
- $1,476 · $123/mo
- Expected delta
- $0/yr ($0/mo · 0.0%)
ⓘ Screening estimate from a state-policy table — verify with the county assessor before closing.
Climate risk First Street
- Flood 1/10 Low FEMA zone X (unshaded) · 0% chance over 30 yrs
- Wildfire 5/10 Major
- Heat 1/10 Low 6 d/yr ≥86°F today · 14 d/yr by 30 yrs out
- Wind 1/10 Low
- Air quality 9/10 Extreme 19 unhealthy d/yr today · 26 by 30 yrs out
Nearby sold comps map
Loading sold comps map…
Walkable amenities ~0.75 mi
Loading nearby amenities…
Taxation est. · year 1
- Rental income
- $16,125
- − Mortgage interest
- −$8,962
- − Property taxes
- −$1,476
- − Insurance
- −$800
- − Repairs & maintenance
- −$1,290
- − Management
- −$1,290
- − Depreciation
- −$4,655
- Taxable loss
- −$2,349
- Est. tax savings @ 24.0%
- +$564
- After-tax cash flow
- $957/yr
For passive investors: Depreciation is non-cash, so a rental often shows a tax loss while cash-flowing — sheltering income. Rental losses are passive: they offset passive income freely, and up to $25,000/yr can offset ordinary (W-2) income if you actively participate and your MAGI is under $100k (phasing out to $0 by $150k); unused losses carry forward. On sale, claimed depreciation is recaptured at up to 25%, and gains may owe capital-gains tax (a 1031 exchange can defer both). Figures are a year-1 estimate at your 24.0% rate — not tax advice; consult a CPA.
Schools (NCES district)
- District
- Butte H S
- NCES district ID
- 3005310
- Math proficiency
- 24% ▼ -7.00%
- Reading proficiency
- 50% ▲ 1.00%
- Median HH income
- $37,852
- Composite
- 30.74/100
- National rank
- #6162
- State rank
- #73 of 116 in MT
Livability — Butte-Silver Bow (balance)
No livability data for this city. (Only ~50 U.S. cities are tracked.)
Census & demographics
- Census place
- Butte-Silver Bow (balance), MT
- County
- Silver Bow County · 34,232 people
- City population
- 35,306
- Metro
- Butte-Silver Bow, MT
- Population (ZIP)
- 34,232
- Household income
- $60,437
- Rent vs Own
- Severe rent burden
- 1060.0
Population outlook (Silver Bow County) Hauer SSP2
- Today (2025)
- 35,745 people
- By 2030
- 36,359 · +1.7%
- By 2040
- 37,490 · +4.9%
- By 2050
- 38,593 · +8.0%
- By 2075
- 43,773 · +22.5%
- By 2100
- 48,513 · +35.7%
Race, ethnicity, and origin ACS 2023
- Neighborhood character
- Predominantly White (89%)
- Race & ethnicity
- White 89% Two or more races 6% Hispanic / Latino 5% Native American 2%
- Common ancestry
- Portuguese 5% Lithuanian 3% Slovak 2%
- Foreign-born
- 1%
- Languages at home
- 97% English-only · Korean 1% Arabic 1%
Political lean MEDSL · Silver Bow
- 2024 margin
- Lean D (+7.0) · D 51.5% · R 44.5% · Other 4.0%
- 2008→2024 swing
- -33.4pp toward R · 2008: 40.4pp · 2024: 7.0pp
- All cycles
- 2024: D+7.0 2020: D+14.1 2016: D+14.2 2012: D+32.5 2008: D+40.4
Not yet ingested
- Civics
- —
Market trends
- HPI YoY
- ▼ -119.08%
- Current HPI
- 268.4972
- Rent YoY
- ▲ 10.44%
- Metro
- Butte-Silver Bow, MT
- State GDP YoY
- ▲ 3.41%
- F500 in state
- 2
Industry mix (Fortune 500 HQ in MT)
| Industry | F500 HQs | Revenue |
|---|---|---|
| Technology / Analytics | 1 | $2B |
|
||
Price history
+252.4% since first listed12 events — show timeline
- 2026-04-16 Contingent — BSCMLS
- 2026-04-13 Price Changed $185,000 BSCMLS
- 2026-03-18 Price Changed $200,000 BSCMLS
- 2025-11-13 Listed $207,000 BSCMLS
- 2017-03-22 Sold (MLS) — MRMLS
- 2017-01-09 Listed $69,500 MRMLS
- 2014-08-25 Sold (MLS) — MRMLS
- 2014-04-23 Listed $52,500 MRMLS
- 2007-06-27 Sold (Public Records) — Public Records
- 2007-03-12 Sold (Public Records) — Public Records
- 1996-05-03 Sold (Public Records) — Public Records
- 1995-02-09 Sold (Public Records) — Public Records
Property tax history
+3.4%/yrLatest (2025): $1,476 · -1.1% YoY. Source: county tax records.
Cash-flow waterfall
monthlySold comps — $/sqft
last 12 mo · ≤1 miLoading sold comps…