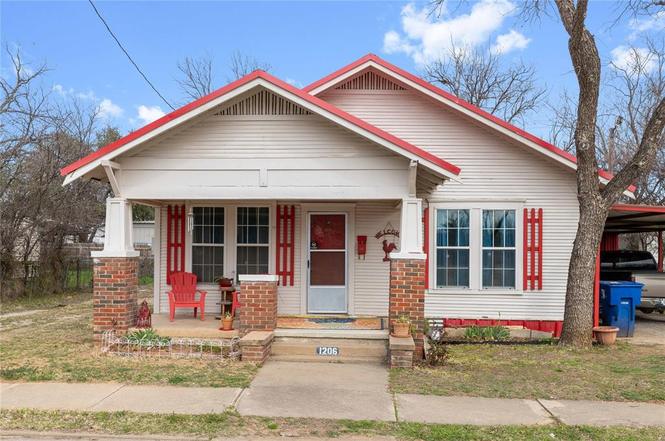
1206 8th St · Brownwood, TX
Flood risk 1/10 · Minimal
- FEMA flood zone
- X (unshaded)
- Chance of flooding over 30 yrs
- 0.0%
- Est. flood insurance / yr
- $507 – $1,088
Fire risk 6/10 · Moderate
- Est. fire insurance / yr
- $1,222 – $2,270
Heat risk 7/10 · Major
- Hot days now (above 107°F)
- 7 days/yr
- Hot days in 30 yrs
- 23 days/yr
Wind risk 6/10 · Moderate
- Chance of severe wind over 30 yrs
- 27.0%
Air-quality risk 1/10 · Minimal
- Unhealthy air days now
- 0 days/yr
- Unhealthy air days in 30 yrs
- 0 days/yr
Risk factors via First Street. Map © Google.
Why this score? — see what drove the B- grade
The composite is a weighted blend of 9 inputs, each scored 0–100. Each bar is that input's sub-score; the figure is the points it added to the 100-point composite (weight × sub-score).
- Cash flow +25.1/30.0
- ARV discount +13.9/15.0
- DSCR +8.2/10.0
- 1% rule +6.4/10.0
- Schools +3.6/10.0
- Livability +3.2/5.0
- Rent growth +2.5/5.0
- Condition / age +2.5/5.0
- Appreciation +0.0/10.0
$99,999
🖨 Deal sheet (PDF) 📄 Offer letter ✓ Due diligence
Listing remarks
This charming gem is perfect as a starter home or a forever home. With its Craftsman style, welcoming front porch, high ceilings, hardwood floors, and spacious rooms, it’s easy to imagine making it your own. Recent updates include a remodeled bathroom with a large shower, fresh interior and exterior paint, and a metal roof added within the last six years. Original hardwood floors and lovely French doors add to its warm, inviting character. Plus, a 14'x6' metal storage building attached to the covered carport offers plenty of storage or workspace. This one’s a must-see!
Key facts
- Metal roof
- Remodeled bathroom
- Large shower
Tags
Property features AI
Finance
- Other: Property is treated as a single residential parcel; Municipal Utility District: No
- Financial info: Listing terms include Cash, Conventional, FHA-203(k)
- HOA & community: No homeowners association
Exterior
- Parking: 1 covered parking space; 1 carport space; Alley access to parking
- Utilities: Electricity connected; City water; City sewer; Natural gas available; Cable available
- Home design: Single-family residence; Residential property; One-story; Subdivision: Sweet Addition
- Construction: Wood construction; Metal roof; Pillar/post/pier foundation; Year built: Unknown
- Exterior features: Alley access; Asphalt and curbed streets; City water and city sewer available; Cable available; Natural gas available
Interior
- Kitchen: Built-in cabinets; Dual sinks; Solid surface (non-natural) countertops; Walk-in pantry; Gas range/oven; Plumbed for gas in kitchen; Refrigerator included
- Bedrooms: 2 bedrooms (both on the main level); Primary bedroom on main level — approx. 16 x 13; Second bedroom on main level — approx. 13 x 13
- Flooring: Carpet; Hardwood; Luxury vinyl plank
- Bathrooms: 1 full bathroom on the main level with built-in cabinets, Corian-type countertops, and a separate shower
- Heating & cooling: Wall furnace heating; Window unit cooling
- Interior features: Cable TV available; High-speed internet available; Pantry; One living area; One dining area; 6 total rooms; Levels: One
- Laundry & utility: Washer and dryer included; Electric dryer hookup; Gas water heater
Neighborhood map
What this means for you Summary
Snapshot
- This is a 2-bed/1.0-bath single-family listed at $100k.
Deal economics
- At list price, monthly cash flow is $221 ($3k/yr) — positive.
- The deal already cash-flows at list — no discount required.
- Meets the 1% rule at list price ($1k rent vs $100k).
- Recommended offer: $94k (6.0% below list) — sets the bar for market timing.
- Cap rate 8.9% vs local median 3.8% in Brownwood — top-decile yield for the area; either an underpriced asset or a hidden risk that comps aren't pricing in. Stress-test before assuming the spread holds.
Location & tenants
- Location reads 64/100 on livability (#781 in TX) — a middle-class / working-renter tenant base. Strengths: cost of living A+, housing A+; Watch: crime D+, health & safety D+, amenities F.
- Brownwood ISD (town): math 45% / reading 41% proficiency, ranked #344 of 826 in TX (top 42%) — families likely to look elsewhere, expect single-tenant / working-renter base with shorter leases.
- Zoned schools: Coggin El (math 45% / reading 34%, grade F, #1,545 of 4,322 statewide, top 38%, 708 students, 79% FRL); Brownwood Middle (math 39% / reading 41%, grade F, #646 of 1,662 statewide, top 40%, 485 students, 64% FRL) — zoned schools average 72% FRL vs 54% district-wide (18 pts higher); higher-poverty schools than district average — tighter screening recommended.
- Market conditions: 51 active listings in the ZIP; 3 comparable units currently listed for rent nearby; rentals lingering (median 46d on market — plan ~5-8 weeks vacancy on turnover, expect pricing pressure); 100% of comp listings sitting > 30 days — soft ceiling on asking rent; 142 units permitted in Brown County in 2024 (0 in 5+ unit buildings).
Forward outlook
- Local home prices are declining (-3.0%/yr); year-one equity from $691 of loan paydown is wiped out by about $3k of value loss. Plan a longer hold.
Negotiation context
- It's been on market 72 days — a 6% lower offer ($94k) is reasonable based on typical stale-listing flexibility.
Risks & watch-outs
- Climate carrying-cost: major wind risk, 27% chance of damaging wind over 30y; major wildfire risk; extreme-heat days projected 7→23/yr by 2055 (HVAC capex compounding) — expect insurance premiums to compound above CPI over the hold.
Questions for the listing agent
- It's been on market 72 days. Have you received any prior offers? Is the seller open to a 6% concession, seller financing, or rate buy-down credit?
- Why hasn't it sold? Are there any deal-killer items the seller is aware of (foundation, flood, title, zoning, code violations)?
- Is there a deadline driving the sale (1031 exchange, divorce, estate, relocation)? That informs how much negotiation room exists.
- Schools are F-rated, which usually means shorter tenancies and higher turnover. Who's the typical renter profile here, and what's been the actual vacancy rate?
- Crime grade is D in this area — have there been break-ins, vandalism, or insurance claims at this property in the last 3 years? What carrier currently insures it and at what premium?
- What's the average days-on-market for RENTAL listings here right now (not sales)? A rising rental-DOM trend means longer vacancies and softer asking-rent achievability than the comps imply.
- What's the recent tenant-quality profile in this submarket — average credit score on applications, eviction rate, late-payment / NSF rate, and stable-employment percentage? A property-management company in the area should have these aggregated.
- How much new for-sale + rental construction is in the pipeline within 1–3 miles? Heavy new supply typically softens prices + rents 12–24 months out; constrained supply supports both.
Investment metrics
- 1% rule
- 1.14% ✓
- Cap rate
- 8.95%
- Cash-on-cash
- 9.49%
- DSCR
- 1.42
- GRM
- 7.3
CMA / ARV
- ARV (on-the-fly)
- $116,480
- Comps found
- 12
Show comp detail 12 sales within ~0.75 mi
| Address | Dist | Beds/Ba | Sqft | Sold | Price | $/sf | Match |
|---|---|---|---|---|---|---|---|
| 1611 3rd St | 0.39mi | 2/1.0 | 1,146 (+2%) | 7mo | $139,000 | $121 | 72 |
| 1620 Avenue D | 0.23mi | 2/1.0 | 1,036 (-8%) | 10mo | $105,000 | $101 | 69 |
| 1510 4th St | 0.30mi | 2/1.0 | 1,196 (+7%) | 8mo | $139,000 | $116 | 68 |
| 1808 8th St | 0.39mi | 3/1.0 (+1) | 1,130 (+1%) | 10mo | $118,000 | $104 | 67 |
| 2204 Avenue C | 0.20mi | 2/1.0 | 1,230 (+10%) | 8mo | $63,000 | $51 | 67 |
| 1209 Irma St | 0.56mi | 2/1.0 | 1,174 (+5%) | 3mo | $92,900 | $79 | 63 |
| 1215 Avenue J | 0.63mi | 2/1.0 | 1,160 (+4%) | 8mo | $54,999 | $47 | 58 |
| 2204 Berkley St | 0.74mi | 3/1.0 (+1) | 1,128 (+1%) | 6mo | $134,900 | $120 | 55 |
| 1217 Avenue D | 0.51mi | 2/1.0 | 1,226 (+10%) | 9mo | $52,000 | $42 | 53 |
| 405 4th St | 0.49mi | 2/1.0 | 972 (-13%) | 3mo | $43,200 | $44 | 52 |
| 2103 9th St | 0.64mi | 3/2.0 (+1) | 1,062 (-5%) | 2mo | $185,000 | $174 | 51 |
| 504 5th St | 0.45mi | 3/2.0 (+1) | 1,200 (+7%) | 9mo | $259,000 | $216 | 51 |
Match score weights: distance 35% · size 25% · config 20% · recency 20%. Top-matched comps best support the ARV.
Projected returns pro-forma
-3.0% appreciation · 3.0% rent growth · sell at horizon
- IRR
- -2.0%
- Equity multiple
- 0.93×
- Total profit
- $-2,096
- Equity at exit
- $14,910
- IRR
- 7.7%
- Equity multiple
- 1.58×
- Total profit
- $16,374
- Equity at exit
- $8,646
Cash invested: $28,000 (down + closing). Projections, not guarantees.
Landlord ↔ Tenant lean methodology
- Overall (STATE)
- 87 Strongly Landlord-Friendly
- State Texas
- 87 Strongly Landlord-Friendly · R+5
- County
- — inherits STATE
- City
- — inherits STATE
ZIP-level market 76802
- Home prices YoY
- -23.6%
- Active inventory
- 51
- Price-to-rent
- 7.3×
Monthly cashflow live
- Estimated rent
- $1,143 medium interval (Pro) →
- Mortgage (P&I)
- −$524
- Tax from tax record
- −$116 /mo · $1,389/yr
- Insurance
- −$42
- HOA
- −$0
- Vacancy / Maint / Mgmt
- −$240
- Net cashflow
- $221
Break-even live
Sensitivity live
| Price | -10% $278 | -5% $250 | +0% $221 | +5% $193 | +10% $165 |
|---|---|---|---|---|---|
| Rent | -10% $131 | -5% $176 | +0% $221 | +5% $266 | +10% $312 |
| Rate | -1.0pp $272 | -0.5pp $247 | base $221 | +0.5pp $195 | +1.0pp $169 |
UW: 25.0% down · 7.5% · 30yr · 1.5% tax · 5.0% vac · 8.0% maint · 8.0% mgmt
Financing live
Cash to close
- Down payment
- $25,000
- Closing costs
- $3,000
- Reserves months
- —
- Total cash needed
- —
Loan-product check · same deal, 3 products live
Conventional
25% down · 7.5% · 30yr
- Down + closing
- —
- Monthly P&I
- —
- Monthly cashflow
- —
- DSCR
- —
- Eligible?
- —
Personal DTI + credit; lowest rate.
DSCR
20% down · 8.5% · 30yr
- Down + closing
- —
- Monthly P&I
- —
- Monthly cashflow
- —
- DSCR
- —
- Eligible?
- —
No personal income docs; deal must DSCR.
Hard money
10% down · 12.0% · 12mo
- Down + closing
- —
- Monthly P&I
- —
- Monthly cashflow
- —
- DSCR
- —
- Eligible?
- —
Short-term bridge; refi at stabilization.
Rent comps 3 comps
| Address | Beds | Baths | Sqft | Rent | $/sqft | DOM | Units | Dist |
|---|---|---|---|---|---|---|---|---|
| 2001 Brady Ave Unit Booker 703 Brownwood, TX | 2.0 | 1.0 | 1247 | $1,045 | $0.84 | 45d | 1 | 0.28mi |
| 2001 Brady Ave Unit 1705 Austin-A Brownwood, TX | 2.0 | 1.0 | 1070 | $1,095 | $1.02 | 45d | 1 | 0.28mi |
| 2411 13th St Brownwood, TX | 3.0 | 2.0 | 1466 | $1,800 | $1.23 | 45d | 1 | 1.04mi |
Listing history 7 events
-
2026-05-10status Pending
-
2026-05-02historical Active Option Contract
-
2026-03-31price $99,999
-
2026-03-20price $114,999
-
2026-02-26$119,999 Active
-
2007-01-22soldstatus
-
2001-05-09soldstatus
ⓘ Source: listings_history table (triggers on properties + properties_extension) + one-shot
backfill from property_details.listing_events for pre-trigger history.
Tax reassessment forecast TX · Resets to sale price
- Current annual tax
- $1,389 · $116/mo
- Projected year-2 tax
- $1,830 · $152/mo
- Expected delta
- +$441/yr (+$37/mo · 31.8%)
ⓘ Screening estimate from a state-policy table — verify with the county assessor before closing.
Climate risk First Street
- Flood 1/10 Low FEMA zone X (unshaded) · 0% chance over 30 yrs
- Wildfire 6/10 Major
- Heat 7/10 Severe 7 d/yr ≥107°F today · 23 d/yr by 30 yrs out
- Wind 6/10 Major 27% chance of damaging wind over 30 yrs
- Air quality 1/10 Low 0 unhealthy d/yr today · 0 by 30 yrs out
Nearby sold comps map
Loading sold comps map…
Walkable amenities ~0.75 mi
Loading nearby amenities…
Taxation est. · year 1
- Rental income
- $13,719
- − Mortgage interest
- −$5,601
- − Property taxes
- −$1,389
- − Insurance
- −$500
- − Repairs & maintenance
- −$1,097
- − Management
- −$1,097
- − Depreciation
- −$2,909
- Taxable income
- $1,124
- Est. tax owed @ 24.0%
- −$270
- After-tax cash flow
- $2,386/yr
For passive investors: Depreciation is non-cash, so a rental often shows a tax loss while cash-flowing — sheltering income. Rental losses are passive: they offset passive income freely, and up to $25,000/yr can offset ordinary (W-2) income if you actively participate and your MAGI is under $100k (phasing out to $0 by $150k); unused losses carry forward. On sale, claimed depreciation is recaptured at up to 25%, and gains may owe capital-gains tax (a 1031 exchange can defer both). Figures are a year-1 estimate at your 24.0% rate — not tax advice; consult a CPA.
Schools (NCES district)
- District
- Brownwood ISD
- NCES district ID
- 4811700
- Math proficiency
- 45% ▲ 4.00%
- Reading proficiency
- 41% ▲ 1.00%
- Median HH income
- $37,395
- Composite
- 35.8/100
- National rank
- #4833
- State rank
- #344 of 826 in TX
Livability — Brownwood
- Score
- 64/100
- State rank
- #781
- US rank
- #14230
Category grades
Schools grade is shown separately in the Schools card above.
Census & demographics
- Census place
- Brownwood, TX
- Population (ZIP)
- 5,317
Population outlook (Brown County) Hauer SSP2
- Today (2025)
- 38,381 people
- By 2030
- 38,288 · -0.2%
- By 2040
- 38,120 · -0.7%
- By 2050
- 38,227 · -0.4%
- By 2075
- 39,362 · +2.6%
- By 2100
- 39,171 · +2.1%
Race, ethnicity, and origin ACS 2023
- Neighborhood character
- Predominantly White (76%)
- Race & ethnicity
- White 76% Hispanic / Latino 17% Two or more races 15% Asian 2% Black 1%
- Hispanic origin (detail)
- Mexican 15%
- Common ancestry
- Italian 8% Serbian 6% Iranian 2%
- Foreign-born
- 4% · Canada
- Languages at home
- 87% English-only · Spanish 11% Other Asian/Pacific 1% Other Indo-European 1%
Political lean MEDSL · Brown
- 2024 margin
- Solid R (+73.9) · D 12.7% · R 86.6%
- 2008→2024 swing
- -12.5pp toward R · 2008: -61.5pp · 2024: -73.9pp
- All cycles
- 2024: R+73.9 2020: R+72.6 2016: R+74.5 2012: R+71.7 2008: R+61.5
Not yet ingested
- Civics
- —
Market trends
- HPI YoY
- ▼ -58.34%
- Current HPI
- 189.3611
- Rent YoY
- —
- Metro
- —
- State GDP YoY
- ▲ 3.95%
- F500 in state
- 110
Industry mix (Fortune 500 HQ in TX)
| Industry | F500 HQs | Revenue |
|---|---|---|
| Energy | 16 | $1,198B |
|
||
| Technology | 5 | $198B |
|
||
| Engineering / Construction | 4 | $72B |
|
||
| Energy Services | 3 | $60B |
|
||
| Utilities | 3 | $41B |
|
||
| Healthcare | 2 | $330B |
|
||
Price history
-16.7% since first listed7 events — show timeline
- 2026-05-10 Pending — NTREIS
- 2026-05-02 Contingent — NTREIS
- 2026-03-31 Price Changed $99,999 NTREIS
- 2026-03-20 Price Changed $114,999 NTREIS
- 2026-02-26 Listed $119,999 NTREIS
- 2007-01-22 Sold (Public Records) — Public Records
- 2001-05-09 Sold (Public Records) — Public Records
Property tax history
+3.5%/yrLatest (2025): $1,389 · +6.2% YoY. Source: county tax records.
Cash-flow waterfall
monthlySold comps — $/sqft
last 12 mo · ≤1 miLoading sold comps…