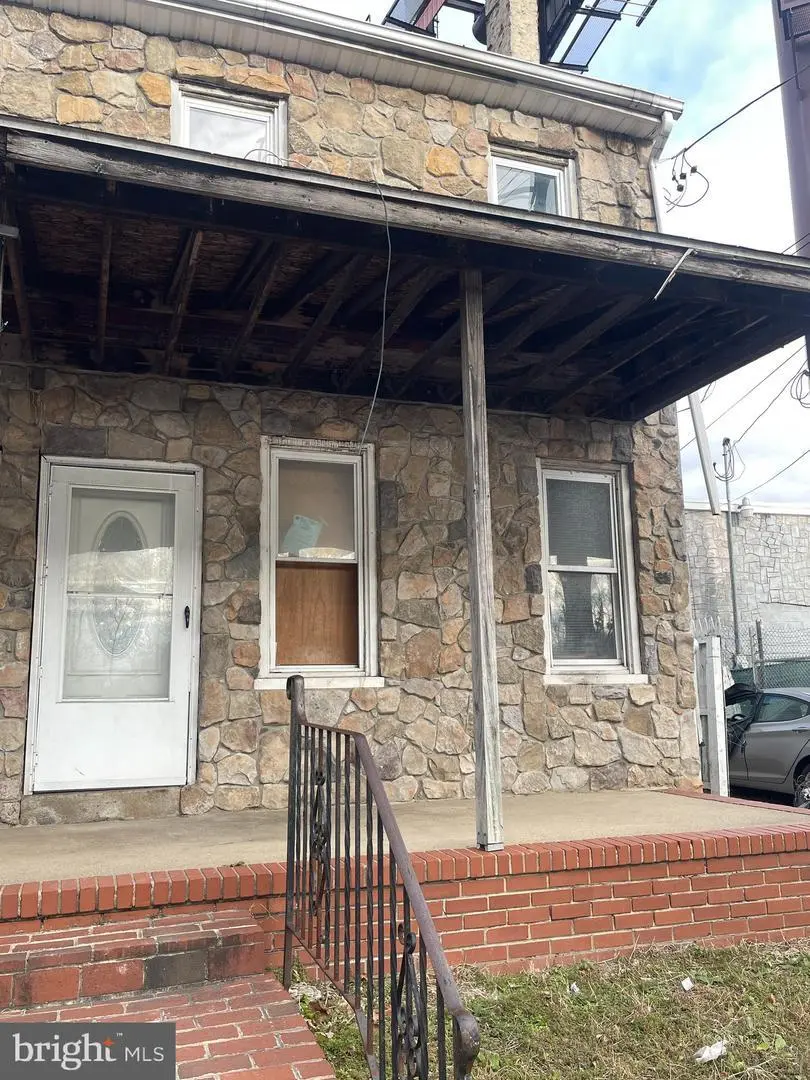
409 Flower St · Chester, PA
Flood risk 1/10 · Minimal
- FEMA flood zone
- X (unshaded)
- Chance of flooding over 30 yrs
- 0.0%
- Est. flood insurance / yr
- $473 – $860
Fire risk 1/10 · Minimal
- Est. fire insurance / yr
- $511 – $949
Heat risk 7/10 · Major
- Hot days now (above 105°F)
- 7 days/yr
- Hot days in 30 yrs
- 15 days/yr
Wind risk 6/10 · Moderate
- Chance of severe wind over 30 yrs
- 27.0%
Air-quality risk 4/10 · Minor
- Unhealthy air days now
- 4 days/yr
- Unhealthy air days in 30 yrs
- 7 days/yr
Risk factors via First Street. Map © Google.
Why this score? — see what drove the B+ grade
The composite is a weighted blend of 9 inputs, each scored 0–100. Each bar is that input's sub-score; the figure is the points it added to the 100-point composite (weight × sub-score).
- Cash flow +30.0/30.0
- ARV discount +15.0/15.0
- 1% rule +10.0/10.0
- DSCR +10.0/10.0
- Rent growth +4.2/5.0
- Livability +3.7/5.0
- Condition / age +2.5/5.0
- Schools +0.8/10.0
- Appreciation +0.0/10.0
$99,500
🖨 Deal sheet (PDF) 📄 Offer letter ✓ Due diligence
Listing remarks MLS
Twin home offering four bedrooms and one bath with a covered front porch.
Key facts
- Built 1900
- Listed 45 days
Property features AI
Finance
- Other: Finished above-grade area reported by assessor; Living area source: assessor
- Financial info: Fee simple ownership
Exterior
- Parking: On-street parking
- Utilities: Public water; Public sewer; Municipal trash service
- Home design: Semi-detached property; Brick construction; Building not winterized
- Construction: Brick exterior; Concrete perimeter foundation and slab; Above-grade and below-grade structures
- Exterior features: 20 x 85 lot dimensions; Ground rent paid annually; Water available
Interior
- Bedrooms: 4 bedrooms on the main level
- Bathrooms: 1 full bathroom on the main level; 1 full bathroom total
- Heating & cooling: Oil heating; Other heating type; Other cooling type; Other hot water system
- Interior features: Not furnished; Major rehab needed; Unfinished basement; Basement with concrete perimeter foundation and slab; 2+ access exits
Neighborhood map
What this means for you Summary
Snapshot
- This is a 4-bed/1.0-bath townhouse listed at $100k.
Deal economics
- At list price, monthly cash flow is $610 ($7k/yr) — positive.
- The deal already cash-flows at list — no discount required.
- Meets the 1% rule at list price ($2k rent vs $100k).
- Recommended offer: $97k (3.0% below list) — sets the bar for market timing.
- Cap rate 13.6% vs local median 7.5% in Chester — top-decile yield for the area; either an underpriced asset or a hidden risk that comps aren't pricing in. Stress-test before assuming the spread holds.
Location & tenants
- Location reads 73/100 on livability (#540 in PA) — a middle-class / working-renter tenant base. Strengths: amenities A+, commute A+, cost of living A+; Watch: schools F, crime F, employment F.
- Chester-Upland SD (suburban): math 4% / reading 17% proficiency, ranked #533 of 539 in PA (top 99%) — low school quality limits family demand, transient renter base, plan for 1-2y turnover; 81% free/reduced lunch — lower-income household profile, screen leases tightly.
- Market conditions: Rents rising fast (+6.9%/yr); 140 active listings in the ZIP; 12 comparable units currently listed for rent nearby; rentals at typical pace (median 20d on market — plan ~3-4 weeks tenant-placement turnaround); lower-income renter base — watch delinquency; 299 units permitted in Delaware County in 2024 (5 in 5+ unit buildings).
- At $1,724/mo this rent would consume 50% of the median local household income ($41k/yr) (locally 2668% of renters already pay >50% of income on rent) — very limited rent-growth headroom before tenants either downsize or default.
Forward outlook
- Local home prices are declining (-3.0%/yr); year-one equity from $688 of loan paydown is wiped out by about $3k of value loss. Plan a longer hold.
- At projected returns (-3.0% appreciation + 6.9% rent growth), your $28k cash investment doubles in ~5 years — after that, you're playing with house money.
Negotiation context
- It's been on market 46 days — a 3% lower offer ($97k) is reasonable based on typical stale-listing flexibility.
- 2 sale attempts since 5y ago with the ask held roughly flat each time — persistent listings suggest the price (not the market) is what's stuck; bring a comps-based counter.
- Current owner paid $45k; list at $100k implies a 122% gain — meaningful room to come down on a strong offer.
Risks & watch-outs
- Watch-outs: built in 1900 — expect roof / HVAC / electrical / plumbing capex.
- Climate carrying-cost: major wind risk, 27% chance of damaging wind over 30y; extreme-heat days projected 7→15/yr by 2055 (HVAC capex compounding) — expect insurance premiums to compound above CPI over the hold.
Questions for the listing agent
- It's been on market 46 days. Have you received any prior offers? Is the seller open to a 3% concession, seller financing, or rate buy-down credit?
- Built in 1900 — when were the roof, HVAC, electrical panel, plumbing, and water heater last replaced?
- Is there a deadline driving the sale (1031 exchange, divorce, estate, relocation)? That informs how much negotiation room exists.
- Schools are F-rated, which usually means shorter tenancies and higher turnover. Who's the typical renter profile here, and what's been the actual vacancy rate?
- Crime grade is F in this area — have there been break-ins, vandalism, or insurance claims at this property in the last 3 years? What carrier currently insures it and at what premium?
- What's the average days-on-market for RENTAL listings here right now (not sales)? A rising rental-DOM trend means longer vacancies and softer asking-rent achievability than the comps imply.
- What's the recent tenant-quality profile in this submarket — average credit score on applications, eviction rate, late-payment / NSF rate, and stable-employment percentage? A property-management company in the area should have these aggregated.
- How much new for-sale + rental construction is in the pipeline within 1–3 miles? Heavy new supply typically softens prices + rents 12–24 months out; constrained supply supports both.
Investment metrics
- 1% rule
- 1.73% ✓
- Cap rate
- 13.65%
- Cash-on-cash
- 26.26%
- DSCR
- 2.17
- GRM
- 4.8
CMA / ARV
- ARV (median comp)
- $119,852
- List price
- $99,500
- Delta
- -16.98%
- Verdict
- UNDERPRICED
- Comps
- 20 within 1.0 mi
Show comp detail 12 sales within ~0.75 mi
| Address | Dist | Beds/Ba | Sqft | Sold | Price | $/sf | Match |
|---|---|---|---|---|---|---|---|
| 2012 W 6th St | 0.21mi | 3/1.5 (-1) | 1,260 (-2%) | 10mo | $101,000 | $80 | 72 |
| 2314 W 3rd St | 0.38mi | 3/2.0 (-1) | 1,250 (-2%) | 1mo | $159,000 | $127 | 69 |
| 606 Norris St | 0.30mi | 3/1.0 (-1) | 1,188 (-7%) | 2mo | $149,500 | $126 | 68 |
| 715 Engle St | 0.35mi | 3/2.0 (-1) | 1,268 (-1%) | 10mo | $130,000 | $103 | 65 |
| 2610 W 7th St | 0.61mi | 3/1.0 (-1) | 1,280 (0%) | 2mo | $81,000 | $63 | 64 |
| 1340 W 7th St | 0.34mi | 3/1.0 (-1) | 1,392 (+9%) | 0mo | $179,000 | $129 | 64 |
| 803 W Mary St | 0.65mi | 4/1.5 | 1,256 (-2%) | 4mo | $135,000 | $107 | 61 |
| 710 Lamokin St | 0.43mi | 3/2.0 (-1) | 1,376 (+8%) | 1mo | $185,000 | $134 | 58 |
| 708 Ward St | 0.55mi | 3/2.0 (-1) | 1,353 (+6%) | 2mo | $170,000 | $126 | 54 |
| 2611 W 6th St | 0.59mi | 3/1.0 (-1) | 1,172 (-8%) | 1mo | $72,000 | $61 | 52 |
| 2624 Mccarey St | 0.74mi | 3/1.0 (-1) | 1,210 (-6%) | 6mo | $75,000 | $62 | 47 |
| 917 Pennell St | 0.57mi | 3/1.0 (-1) | 1,100 (-14%) | 10mo | $97,000 | $88 | 36 |
Match score weights: distance 35% · size 25% · config 20% · recency 20%. Top-matched comps best support the ARV.
Projected returns pro-forma
-3.0% appreciation · 6.88% rent growth · sell at horizon
- IRR
- 24.6%
- Equity multiple
- 2.07×
- Total profit
- $29,765
- Equity at exit
- $14,836
- IRR
- 34.9%
- Equity multiple
- 4.85×
- Total profit
- $107,276
- Equity at exit
- $8,603
Cash invested: $27,860 (down + closing). Projections, not guarantees.
Landlord ↔ Tenant lean methodology
- Overall (STATE)
- 62 Landlord-Friendly
- State Pennsylvania
- 62 Landlord-Friendly · EVEN
- County
- — inherits STATE
- City
- — inherits STATE
ZIP-level market 19013
- Rents YoY
- 6.9%
- Active inventory
- 140
- Price-to-rent
- 4.8×
Monthly cashflow live
- Estimated rent
- $1,724 high interval (Pro) →
- Mortgage (P&I)
- −$522
- Tax from tax record
- −$189 /mo · $2,274/yr
- Insurance
- −$41
- HOA
- −$0
- Vacancy / Maint / Mgmt
- −$362
- Net cashflow
- $610
Break-even live
Sensitivity live
| Price | -10% $666 | -5% $638 | +0% $610 | +5% $581 | +10% $553 |
|---|---|---|---|---|---|
| Rent | -10% $473 | -5% $542 | +0% $610 | +5% $678 | +10% $746 |
| Rate | -1.0pp $660 | -0.5pp $635 | base $610 | +0.5pp $584 | +1.0pp $558 |
UW: 25.0% down · 7.5% · 30yr · 1.5% tax · 5.0% vac · 8.0% maint · 8.0% mgmt
Financing live
Cash to close
- Down payment
- $24,875
- Closing costs
- $2,985
- Reserves months
- —
- Total cash needed
- —
Loan-product check · same deal, 3 products live
Conventional
25% down · 7.5% · 30yr
- Down + closing
- —
- Monthly P&I
- —
- Monthly cashflow
- —
- DSCR
- —
- Eligible?
- —
Personal DTI + credit; lowest rate.
DSCR
20% down · 8.5% · 30yr
- Down + closing
- —
- Monthly P&I
- —
- Monthly cashflow
- —
- DSCR
- —
- Eligible?
- —
No personal income docs; deal must DSCR.
Hard money
10% down · 12.0% · 12mo
- Down + closing
- —
- Monthly P&I
- —
- Monthly cashflow
- —
- DSCR
- —
- Eligible?
- —
Short-term bridge; refi at stabilization.
Rent comps 12 comps
| Address | Beds | Baths | Sqft | Rent | $/sqft | DOM | Units | Dist |
|---|---|---|---|---|---|---|---|---|
| 925 W 3rd St Chester, PA | 4.0 | 1.0 | 1500 | $1,700 | $1.13 | 19d | 1 | 0.52mi |
| 2104 N Williams Cir Chester, PA | 4.0 | 1.5 | 1540 | $1,895 | $1.23 | 44d | 1 | 0.53mi |
| 2723 W 3rd St Unit 1F Chester, PA | 4.0 | 1.5 | 1800 | $1,425 | $0.79 | 25d | 1 | 0.70mi |
| 2723 W 3rd St Unit 1F Chester, PA | 4.0 | 1.5 | 1800 | $1,425 | $0.79 | 21d | 1 | 0.70mi |
| 2723 W 3rd St Unit 1F Chester, PA | 4.0 | 1.5 | 1800 | $1,425 | $0.79 | 6d | 1 | 0.70mi |
| 2723 W 3rd St Unit 1F Chester, PA | 4.0 | 1.5 | 1800 | $1,500 | $0.83 | 44d | 1 | 0.70mi |
| 2832 W 6th St Unit 306 Chester, PA | 3.0 | 1.0 | 1428 | $1,500 | $1.05 | 5d | 1 | 0.80mi |
| 1425 Highland Ave Chester, PA | 3.0 | 1.0 | 1212 | $7,998 | $6.60 | 0d | 1 | 1.01mi |
| 418 Penn St Chester, PA | 3.0 | 1.0 | 1250 | $1,350 | $1.08 | 44d | 1 | 1.05mi |
| 2717 Bethel Rd Chester, PA | 3.0 | 1.0 | 1785 | $1,350 | $0.76 | 6d | 1 | 1.06mi |
| 1315 Harshaw Rd Brookhaven, PA | 3.0 | 2.5 | 1260 | $2,395 | $1.90 | 0d | 1 | 1.28mi |
| 1224 Elson Rd Brookhaven, PA | 3.0 | 2.0 | 1200 | $1,900 | $1.58 | 18d | 1 | 1.31mi |
Listing history 24 events
-
2026-06-21days on market $99,500 Active 46 DOM
-
2026-06-18days on market $99,500 Active 43 DOM
-
2026-06-17days on market $99,500 Active 42 DOM
-
2026-06-16days on market $99,500 Active 41 DOM
-
2026-06-15days on market $99,500 Active 40 DOM
-
2026-06-13days on market $99,500 Active 38 DOM
-
2026-06-13days on market $99,500 Active 37 DOM
-
2026-06-09days on market $99,500 Active 34 DOM
-
2026-06-08days on market $99,500 Active 33 DOM
-
2026-06-07days on market $99,500 Active 32 DOM
-
2026-06-04days on market $99,500 Active 29 DOM
-
2026-06-03days on market $99,500 Active 28 DOM
-
2026-06-02days on market $99,500 Active 27 DOM
-
2026-06-01days on market $99,500 Active 26 DOM
-
2026-05-31days on market $99,500 Active 25 DOM
-
2026-05-06$99,500 Active 735-char remark
-
2021-12-24soldstatus $44,900 Closed 73-char remark
Show marketing remark (73 chars)
Twin home offering four bedrooms and one bath with a covered front porch.
-
2021-11-12status Pending 73-char remark
Show marketing remark (73 chars)
Twin home offering four bedrooms and one bath with a covered front porch.
-
2021-10-15historical 73-char remark
Show marketing remark (73 chars)
Twin home offering four bedrooms and one bath with a covered front porch.
-
2021-10-07price $44,900 73-char remark
Show marketing remark (73 chars)
Twin home offering four bedrooms and one bath with a covered front porch.
-
2021-09-08price $49,900 73-char remark
Show marketing remark (73 chars)
Twin home offering four bedrooms and one bath with a covered front porch.
-
2021-07-29price $55,900 73-char remark
Show marketing remark (73 chars)
Twin home offering four bedrooms and one bath with a covered front porch.
-
2021-06-25price $62,100 73-char remark
Show marketing remark (73 chars)
Twin home offering four bedrooms and one bath with a covered front porch.
-
2021-05-27$69,000 Active 73-char remark
Show marketing remark (73 chars)
Twin home offering four bedrooms and one bath with a covered front porch.
ⓘ Source: listings_history table (triggers on properties + properties_extension) + one-shot
backfill from property_details.listing_events for pre-trigger history.
Tax reassessment forecast PA · Partial reset (capped growth)
- Current annual tax
- $2,274 · $189/mo
- Projected year-2 tax
- $2,274 · $189/mo
- Expected delta
- $0/yr ($0/mo · 0.0%)
ⓘ Screening estimate from a state-policy table — verify with the county assessor before closing.
Climate risk First Street
- Flood 1/10 Low FEMA zone X (unshaded) · 0% chance over 30 yrs
- Wildfire 1/10 Low
- Heat 7/10 Severe 7 d/yr ≥105°F today · 15 d/yr by 30 yrs out
- Wind 6/10 Major 27% chance of damaging wind over 30 yrs
- Air quality 4/10 Moderate 4 unhealthy d/yr today · 7 by 30 yrs out
Nearby sold comps map
Loading sold comps map…
Walkable amenities ~0.75 mi
Loading nearby amenities…
Taxation est. · year 1
- Rental income
- $20,694
- − Mortgage interest
- −$5,574
- − Property taxes
- −$2,274
- − Insurance
- −$498
- − Repairs & maintenance
- −$1,656
- − Management
- −$1,656
- − Depreciation
- −$2,895
- Taxable income
- $6,144
- Est. tax owed @ 24.0%
- −$1,474
- After-tax cash flow
- $5,841/yr
For passive investors: Depreciation is non-cash, so a rental often shows a tax loss while cash-flowing — sheltering income. Rental losses are passive: they offset passive income freely, and up to $25,000/yr can offset ordinary (W-2) income if you actively participate and your MAGI is under $100k (phasing out to $0 by $150k); unused losses carry forward. On sale, claimed depreciation is recaptured at up to 25%, and gains may owe capital-gains tax (a 1031 exchange can defer both). Figures are a year-1 estimate at your 24.0% rate — not tax advice; consult a CPA.
Schools (NCES district)
- District
- Chester-Upland SD
- NCES district ID
- 4205860
- Math proficiency
- 4% ▼ -3.00%
- Reading proficiency
- 17% ▼ -6.00%
- Median HH income
- $29,790
- Composite
- 8.05/100
- National rank
- #9918
- State rank
- #533 of 539 in PA
Livability — Chester
- Score
- 73/100
- State rank
- #540
- US rank
- #5053
Category grades
Schools grade is shown separately in the Schools card above.
Census & demographics
- Census place
- Chester, PA
- County
- Delaware County · 399,863 people
- City population
- 35,064
- Metro
- Philadelphia-Camden-Wilmington, PA-NJ-DE-MD
- Population (ZIP)
- 35,064
- Household income
- $41,261
- Rent vs Own
- Severe rent burden
- 2668.0
Population outlook (Delaware County) Hauer SSP2
- Today (2025)
- 577,490 people
- By 2030
- 581,243 · +0.6%
- By 2040
- 584,700 · +1.2%
- By 2050
- 586,581 · +1.6%
- By 2075
- 598,706 · +3.7%
- By 2100
- 590,823 · +2.3%
Race, ethnicity, and origin ACS 2023
- Neighborhood character
- Predominantly Black (71%)
- Race & ethnicity
- Black 71% White 14% Hispanic / Latino 9% Two or more races 4%
- Hispanic origin (detail)
- Puerto Rican 6%
- Common ancestry
- Romanian 2%
- Foreign-born
- 4% · Canada
- Languages at home
- 92% English-only · Spanish 6%
Political lean MEDSL · Delaware
- 2024 margin
- Strong D (+23.7) · D 61.4% · R 37.6% · Other 1.0%
- 2008→2024 swing
- +2.3pp toward D · 2008: 21.4pp · 2024: 23.7pp
- All cycles
- 2024: D+23.7 2020: D+26.7 2016: D+22.0 2012: D+21.8 2008: D+21.4
Not yet ingested
- Civics
- —
Market trends
- HPI YoY
- ▼ -149.69%
- Current HPI
- 219.5173
- Rent YoY
- ▲ 6.88%
- Metro
- Philadelphia-Camden-Wilmington, PA-NJ-DE-MD
- State GDP YoY
- ▲ 1.68%
- F500 in state
- 34
Industry mix (Fortune 500 HQ in PA)
| Industry | F500 HQs | Revenue |
|---|---|---|
| Healthcare | 2 | $309B |
|
||
| Insurance | 2 | $27B |
|
||
| Telecommunications / Media | 1 | $124B |
|
||
| Industrial Distribution | 1 | $22B |
|
||
| Financial Services | 1 | $20B |
|
||
| Chemicals / Materials | 1 | $18B |
|
||
Price history
+44.2% since first listed9 events — show timeline
- 2026-05-06 Listed $99,500 BRIGHT MLS
- 2021-12-24 Sold (MLS) $44,900 BRIGHT MLS
- 2021-11-12 Pending — BRIGHT MLS
- 2021-10-15 Listing Removed — BRIGHT MLS
- 2021-10-07 Price Changed $44,900 BRIGHT MLS
- 2021-09-08 Price Changed $49,900 BRIGHT MLS
- 2021-07-29 Price Changed $55,900 BRIGHT MLS
- 2021-06-25 Price Changed $62,100 BRIGHT MLS
- 2021-05-27 Listed $69,000 BRIGHT MLS
Property tax history
+22.3%/yrLatest (2026): $2,274 · +143.3% YoY. Source: county tax records.
Cash-flow waterfall
monthlySold comps — $/sqft
last 12 mo · ≤1 miLoading sold comps…