 🏗️ New Construction
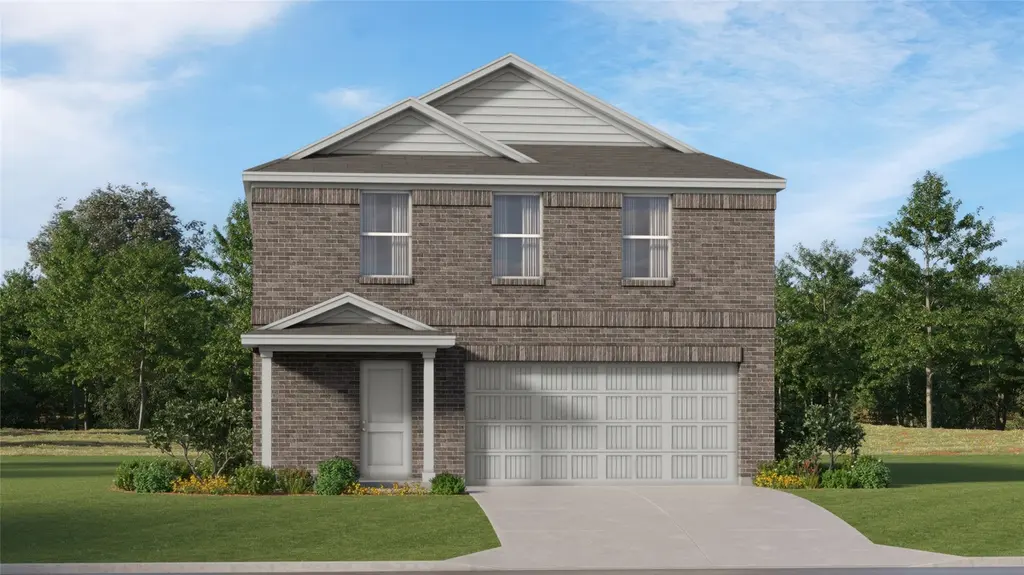
18610 Periwinkle Brook Dr · Houston, TX
Flood risk No data
- FEMA flood zone
- —
- Chance of flooding over 30 yrs
- —
- Est. flood insurance / yr
- —
Fire risk No data
- Est. fire insurance / yr
- —
Heat risk No data
- Hot days now (above threshold)
- —
- Hot days in 30 yrs
- —
Wind risk No data
- Chance of severe wind over 30 yrs
- —
Air-quality risk No data
- Unhealthy air days now
- —
- Unhealthy air days in 30 yrs
- —
Risk factors via First Street. Map © Google.
Why this score? — see what drove the D- grade
The composite is a weighted blend of 9 inputs, each scored 0–100. Each bar is that input's sub-score; the figure is the points it added to the 100-point composite (weight × sub-score).
- Cash flow +9.2/30.0
- ARV discount +7.5/15.0
- Condition / age +4.0/5.0
- 1% rule +3.7/10.0
- Livability +3.7/5.0
- Schools +3.5/10.0
- Rent growth +2.9/5.0
- DSCR +2.6/10.0
- Appreciation +0.0/10.0
$207,990
🖨 Deal sheet 📄 Offer letter ✓ Due diligence
Listing remarks
The Whitetail Floor Plan - The first floor of this two-story home shares a spacious open layout between the kitchen, dining room and family room for easy entertaining. Upstairs are three secondary bedrooms, ideal for residents and overnight guests, surrounding a versatile loft that serves as an additional shared living space. An owner's suite sprawls across the rear of the second floor and enjoys an en-suite bathroom and a walk-in closet. The completion date, prices and features may vary and are subject to change. Please verify with Lennar directly. Photos are for illustrative purposes only.
Key facts
- Walk-in closet
- Open layout
- En-suite bathroom
Tags
Property features AI
Finance
- HOA & community: Association: Community Solutions; Annual association fee
Exterior
- Parking: Attached 2-car garage
- Utilities: Public water; Public sewer
- Home design: Residential property; Under construction (new construction); Slab foundation
- Construction: Built in 2026; Brick and cement siding construction; Composition roof
- Exterior features: Back yard fence
Interior
- Kitchen: Dishwasher; Electric oven; Electric range; Gas oven; Gas range
- Bedrooms: Primary bedroom (Second level, approx. 16 x 12); Bedroom (Second level, approx. 12 x 12); Bedroom (Second level, approx. 12 x 12); Bedroom (Second level, approx. 12 x 10)
- Flooring: Carpet; Vinyl
- Bathrooms: 2 full bathrooms; 1 half bathroom
- Heating & cooling: Central heating (electric and gas); Central air conditioning (electric and gas)
- Interior features: Breakfast bar; Kitchen/family room combo; Kitchen/dining combo; Loft; Primary bathroom with separate shower and tub/shower
- Laundry & utility: Washer hookup; Electric dryer hookup; Gas dryer hookup
Neighborhood map
What this means for you Summary
Snapshot
- This is a 4-bed/2.5-bath single-family listed at $208k. Condition is rated good.
Deal economics
- At list price, monthly cash flow is $-211 ($-3k/yr) — negative.
- The deal already cash-flows at list — no discount required.
- Meets the 1% rule at list price ($2k rent vs $208k).
- Cap rate 5.4% vs local median 3.2% in Houston — top-decile yield for the area; either an underpriced asset or a hidden risk that comps aren't pricing in. Stress-test before assuming the spread holds.
Location & tenants
- Location reads 74/100 on livability (#184 in TX, #4,771 nationally) — a middle-class / working-renter tenant base. Strengths: amenities A+, cost of living A+, housing A+; Watch: crime F.
- Crosby ISD (rural): math 39% / reading 40% proficiency, ranked #369 of 826 in TX (top 45%) — families likely to look elsewhere, expect single-tenant / working-renter base with shorter leases.
- Zoned schools: Crosby Middle (math 36% / reading 37%, grade F, #786 of 1,662 statewide, top 48%, 1,549 students, 60% FRL); Highpoint School East (Crosby) (20 students, 80% FRL) — zoned schools average 70% FRL vs 50% district-wide (20 pts higher); higher-poverty schools than district average — tighter screening recommended.
- Market conditions: Rents rising (+1.5%/yr); 1172 active listings in the ZIP; 2 comparable units currently listed for rent nearby; solid renter incomes; 29,883 units permitted in Harris County in 2024 (8,621 in 5+ unit buildings).
- This rent runs 31% of the median local income ($92k/yr) — at the standard rent-burdened threshold; future hikes will face affordability resistance.
Forward outlook
- Local home prices are declining (-3.0%/yr); year-one equity from $2k of loan paydown is wiped out by about $8k of value loss. Plan a longer hold.
- Harris County population projected at +47% by 2050 — long-run rental-demand tailwind backs the buy-and-hold thesis.
Negotiation context
- Only 14 days on market — expect competitive offers; lowballing is unlikely to land.
- 2 sale attempts; this cycle's ask has dropped $18k (8%) from the opening price — seller is motivated, your offer sets the floor, not the list.
Questions for the listing agent
- What do current leases actually rent for vs. the listed asking? Can we see a recent rent roll and the last 12 months of T-12 income?
- What does the HOA fee cover, when was the last increase, and are there any pending special assessments or reserve-fund shortfalls?
- Is there a deadline driving the sale (1031 exchange, divorce, estate, relocation)? That informs how much negotiation room exists.
- Schools are D-rated, which usually means shorter tenancies and higher turnover. Who's the typical renter profile here, and what's been the actual vacancy rate?
- Crime grade is F in this area — have there been break-ins, vandalism, or insurance claims at this property in the last 3 years? What carrier currently insures it and at what premium?
- The area grade is low — what's the realistic commute time and amenity access for the typical tenant pool here? Any planned neighborhood developments (good or bad) we should know about?
- What's the average days-on-market for RENTAL listings here right now (not sales)? A rising rental-DOM trend means longer vacancies and softer asking-rent achievability than the comps imply.
- What's the recent tenant-quality profile in this submarket — average credit score on applications, eviction rate, late-payment / NSF rate, and stable-employment percentage? A property-management company in the area should have these aggregated.
- How much new for-sale + rental construction is in the pipeline within 1–3 miles? Heavy new supply typically softens prices + rents 12–24 months out; constrained supply supports both.
Investment metrics
- 1% rule
- 0.87% ✗
- Cap rate
- 5.39%
- Cash-on-cash
- -3.24%
- DSCR
- 0.86
- GRM
- 9.6
CMA / ARV
- ARV (on-the-fly)
- $279,343
- Comps found
- 12
Show comp detail 12 sales within ~0.75 mi
| Address | Dist | Beds/Ba | Sqft | Sold | Price | $/sf | Match |
|---|---|---|---|---|---|---|---|
| 18610 Periwinkle Brook Dr | 0.00mi | 4/2.5 | 2,039 (0%) | 1mo | $207,990 | $102 | 99 |
| 1619 Golden Iris Dr | 0.18mi | 4/2.5 | 2,039 (0%) | 1mo | $281,990 | $138 | 91 |
| 1635 Golden Iris Dr | 0.21mi | 4/2.5 | 2,039 (0%) | 1mo | $281,990 | $138 | 90 |
| 18530 Camellia Terrace Dr | 0.09mi | 4/2.5 | 1,968 (-4%) | 1mo | $238,990 | $121 | 89 |
| 1606 Marigold Bend Dr | 0.17mi | 4/2.5 | 2,083 (+2%) | 1mo | $321,990 | $155 | 88 |
| 18502 Camellia Terrace Dr | 0.15mi | 4/2.5 | 1,968 (-4%) | 1mo | $231,990 | $118 | 86 |
| 1530 Gardenia Grove Ln | 0.09mi | 4/2.0 | 1,760 (-14%) | 0mo | $223,990 | $127 | 71 |
| 1734 Indigo Chase Dr | 0.38mi | 4/2.0 | 1,900 (-7%) | 1mo | $235,140 | $124 | 68 |
| 18506 Camellia Terrace Dr | 0.14mi | 4/2.0 | 1,760 (-14%) | 1mo | $205,790 | $117 | 68 |
| 1730 Indigo Chase Dr | 0.37mi | 3/2.0 (-1) | 1,949 (-4%) | 1mo | $309,990 | $159 | 68 |
| 18327 Ginger Glen Ln | 0.43mi | 4/2.0 | 1,859 (-9%) | 1mo | $308,990 | $166 | 63 |
| 1614 Marigold Bend Dr | 0.18mi | 3/2.0 (-1) | 1,749 (-14%) | 1mo | $238,740 | $137 | 60 |
Match score weights: distance 35% · size 25% · config 20% · recency 20%. Top-matched comps best support the ARV.
Projected returns pro-forma
-3.0% appreciation · 1.48% rent growth · sell at horizon
- IRR
- -23.5%
- Equity multiple
- 0.20×
- Total profit
- $-62,191
- Equity at exit
- $41,651
- IRR
- -23.5%
- Equity multiple
- -0.09×
- Total profit
- $-85,336
- Equity at exit
- $24,152
Cash invested: $78,216 (down + closing). Projections, not guarantees.
Landlord ↔ Tenant lean methodology
- Overall (STATE)
- 87 Strongly Landlord-Friendly
- State Texas
- 87 Strongly Landlord-Friendly · R+5
- County
- — inherits STATE
- City
- — inherits STATE
ZIP-level market 77532
- Home prices YoY
- -28.6%
- Rents YoY
- 1.5%
- Active inventory
- 1172
- Price-to-rent
- 7.2×
Monthly cashflow live
- Estimated rent
- $2,420 medium interval (Pro) →
- Mortgage (P&I)
- −$1,465
- Tax est. 1.5%
- −$349 /mo · $4,190/yr
- Insurance
- −$116
- HOA
- −$192
- Vacancy / Maint / Mgmt
- −$508
- Net cashflow
- $-211
Break-even live
UW: 25.0% down · 7.5% · 30yr · 1.5% tax · 5.0% vac · 8.0% maint · 8.0% mgmt
Financing live
Cash to close
- Down payment
- $69,836
- Closing costs
- $8,380
- Reserves months
- —
- Total cash needed
- —
Loan-product check · same deal, 3 products live
Conventional
25% down · 7.5% · 30yr
- Down + closing
- —
- Monthly P&I
- —
- Monthly cashflow
- —
- DSCR
- —
- Eligible?
- —
Personal DTI + credit; lowest rate.
DSCR
20% down · 8.5% · 30yr
- Down + closing
- —
- Monthly P&I
- —
- Monthly cashflow
- —
- DSCR
- —
- Eligible?
- —
No personal income docs; deal must DSCR.
Hard money
10% down · 12.0% · 12mo
- Down + closing
- —
- Monthly P&I
- —
- Monthly cashflow
- —
- DSCR
- —
- Eligible?
- —
Short-term bridge; refi at stabilization.
Rent comps 2 comps
| Address | Beds | Baths | Sqft | Rent | $/sqft | DOM | Units | Dist |
|---|---|---|---|---|---|---|---|---|
| 1519 Gardenia Grove Ln Crosby, TX | 3.0 | 2.0 | 1461 | $1,800 | $1.23 | 24d | 1 | 0.09mi |
| 18707 Antler Trails Ct Crosby, TX | 4.0 | 2.5 | 2547 | $2,361 | $0.93 | 24d | 1 | 0.83mi |
HOA detail
- Monthly dues
- $192 · $2,304/yr
Listing history 7 events
-
2026-04-30status Pending
-
2026-04-28price $207,990
-
2026-04-17price $218,090
-
2026-04-16$225,990 Active
-
2026-04-16historical
-
2026-04-13price $225,990
-
2026-04-13$285,990 Active
ⓘ Source: listings_history table (triggers on properties + properties_extension) + one-shot
backfill from property_details.listing_events for pre-trigger history.
Nearby sold comps map
Loading sold comps map…
Walkable amenities ~0.75 mi
Loading nearby amenities…
Taxation est. · year 1
- Rental income
- $29,036
- − Mortgage interest
- −$15,648
- − Property taxes
- −$4,190
- − Insurance
- −$1,397
- − Repairs & maintenance
- −$2,323
- − Management
- −$2,323
- − HOA
- −$2,304
- − Depreciation
- −$8,126
- Taxable loss
- −$7,274
- Est. tax savings @ 24.0%
- +$1,746
- After-tax cash flow
- $-785/yr
For passive investors: Depreciation is non-cash, so a rental often shows a tax loss while cash-flowing — sheltering income. Rental losses are passive: they offset passive income freely, and up to $25,000/yr can offset ordinary (W-2) income if you actively participate and your MAGI is under $100k (phasing out to $0 by $150k); unused losses carry forward. On sale, claimed depreciation is recaptured at up to 25%, and gains may owe capital-gains tax (a 1031 exchange can defer both). Figures are a year-1 estimate at your 24.0% rate — not tax advice; consult a CPA.
Condition & rehab AI · 12 photos
This home is in good condition with a modern and well-maintained interior and exterior. It is ready for immediate occupancy and has potential for further value increases through minor cosmetic updates.
Value-add opportunities
- Both Painting the exterior and interior — Enhances curb appeal and interior aesthetics
- Both Landscaping improvements — Enhances curb appeal and adds value
- Both Replace curtains — Freshens up the interior and adds value
Renovation cost estimate screening
Value-add ROI direction
- Both Painting the exterior and interior — Enhances curb appeal and interior aesthetics ↑
- Both Landscaping improvements — Enhances curb appeal and adds value ↑
- Both Replace curtains — Freshens up the interior and adds value ↑
ⓘ Cost ranges are severity-bucket heuristics (US national rule-of-thumb). Get contractor quotes + a written scope before underwriting a rehab budget.
Schools (NCES district)
- District
- Crosby ISD
- NCES district ID
- 4815750
- Math proficiency
- 39% ▼ -13.00%
- Reading proficiency
- 40% ▼ -5.00%
- Median HH income
- $61,079
- Composite
- 35.14/100
- National rank
- #5012
- State rank
- #369 of 826 in TX
Livability — Houston
- Score
- 74/100
- State rank
- #184
- US rank
- #4771
Category grades
Schools grade is shown separately in the Schools card above.
Census & demographics
- County
- Harris County · 4,702,590 people
- City population
- 3,226,434
- Metro
- Houston-The Woodlands-Sugar Land, TX
- Population (ZIP)
- 33,780
- Household income
- $92,201
- Rent vs Own
- Severe rent burden
- 382.0
Population outlook (Harris County) Hauer SSP2
- Today (2025)
- 5,571,493 people
- By 2030
- 6,089,821 · +9.3%
- By 2040
- 7,142,806 · +28.2%
- By 2050
- 8,185,864 · +46.9%
- By 2075
- 10,574,329 · +89.8%
- By 2100
- 12,109,958 · +117.4%
Race, ethnicity, and origin ACS 2023
- Neighborhood character
- Diverse neighborhood (Simpson 0.60)
- Race & ethnicity
- White 54% Hispanic / Latino 31% Two or more races 16% Black 9%
- Hispanic origin (detail)
- Mexican 24%
- Common ancestry
- Lithuanian 4% Romanian 3% Italian 2%
- Foreign-born
- 10% · Canada
- Languages at home
- 78% English-only · Spanish 21%
Political lean MEDSL · Harris
- 2024 margin
- Lean D (+5.5) · D 52.0% · R 46.4% · Other 1.6%
- 2008→2024 swing
- +3.9pp toward D · 2008: 1.6pp · 2024: 5.5pp
- All cycles
- 2024: D+5.5 2020: D+13.3 2016: D+12.4 2012: D+0.1 2008: D+1.6
Not yet ingested
- Civics
- —
Market trends
- HPI YoY
- ▼ -105.63%
- Current HPI
- 264.0126
- Rent YoY
- ▲ 1.48%
- Metro
- Houston-The Woodlands-Sugar Land, TX
- State GDP YoY
- ▲ 3.95%
- F500 in state
- 110
Industry mix (Fortune 500 HQ in TX)
| Industry | F500 HQs | Revenue |
|---|---|---|
| Energy | 16 | $1,198B |
|
||
| Technology | 5 | $198B |
|
||
| Engineering / Construction | 4 | $72B |
|
||
| Energy Services | 3 | $60B |
|
||
| Utilities | 3 | $41B |
|
||
| Healthcare | 2 | $330B |
|
||
Price history
-27.3% since first listed7 events — show timeline
- 2026-04-30 Pending — HARMLS
- 2026-04-28 Price Changed $207,990 HARMLS
- 2026-04-17 Price Changed $218,090 HARMLS
- 2026-04-16 Listing Removed — HARMLS
- 2026-04-16 Listed $225,990 HARMLS
- 2026-04-13 Price Changed $225,990 HARMLS
- 2026-04-13 Listed $285,990 HARMLS
Cash-flow waterfall
monthlySold comps — $/sqft
last 12 mo · ≤1 miLoading sold comps…