516 W Martin St · El Reno, OK
Flood risk 1/10 · Minimal
- FEMA flood zone
- X (unshaded)
- Chance of flooding over 30 yrs
- 0.0%
- Est. flood insurance / yr
- $507 – $1,088
Fire risk 1/10 · Minimal
- Est. fire insurance / yr
- $2,463 – $4,575
Heat risk 5/10 · Moderate
- Hot days now (above 107°F)
- 7 days/yr
- Hot days in 30 yrs
- 18 days/yr
Wind risk 2/10 · Minimal
- Chance of severe wind over 30 yrs
- 2.0%
Air-quality risk 2/10 · Minimal
- Unhealthy air days now
- 1 days/yr
- Unhealthy air days in 30 yrs
- 2 days/yr
Risk factors via First Street. Map © Google.
Why this score? — see what drove the D grade
The composite is a weighted blend of 9 inputs, each scored 0–100. Each bar is that input's sub-score; the figure is the points it added to the 100-point composite (weight × sub-score).
- ARV discount +13.1/15.0
- Cash flow +12.0/30.0
- DSCR +3.6/10.0
- Rent growth +3.5/5.0
- Livability +3.4/5.0
- 1% rule +2.8/10.0
- Condition / age +2.5/5.0
- Schools +1.2/10.0
- Appreciation +0.0/10.0
$159,900
🖨 Deal sheet (PDF) 📄 Offer letter ✓ Due diligence
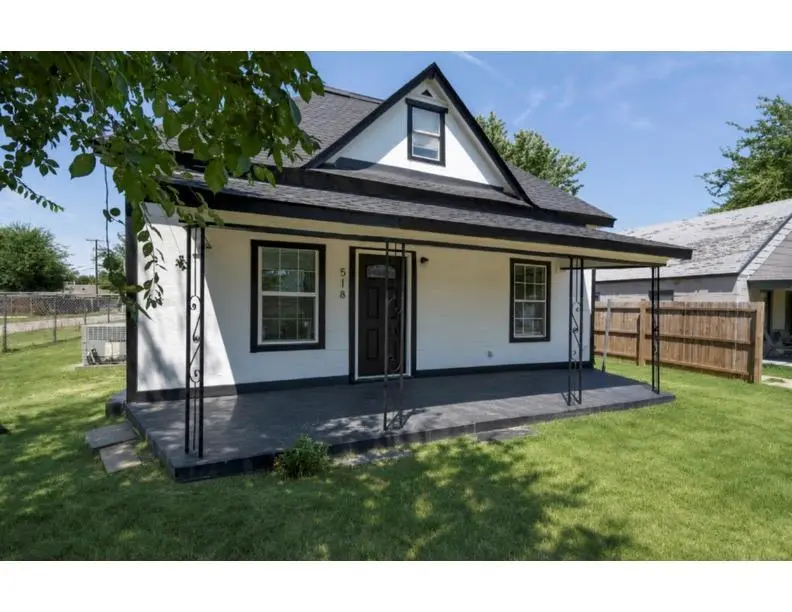
Listing remarks
Fully updated and move-in ready, this home offers a clean modern feel throughout with durable solid-surface LVP flooring and thoughtful upgrades at every turn. The renovated kitchen features refreshed finishes and a functional layout designed for everyday living. The floor plan provides excellent flexibility with two bedrooms located on the main level along with a full bathroom, creating convenient single-level living options. Upstairs, you’ll find a private additional bedroom ideal for guests, a home office, or a quiet retreat. With its updated interior, practical layout, and low-maintenance surfaces, this home delivers comfort and usability without wasted space. Clean, simple, and r
Key facts
- Renovated kitchen
- Functional layout
- 5,998 sq ft lot
Tags
Property features AI
Finance
- Other: Homestead not claimed
- Financial info: Loan qualification possible; Not assumable
- HOA & community: No mandatory association dues
Exterior
- Home design: Two-story single family residence; Residential property; Existing property
- Construction: Built with other construction materials; Composition roof; Conventional foundation
- Exterior features: Covered porch; Workshop; Corner lot
Interior
- Bedrooms: 3 bedrooms
- Bathrooms: 1 full bathroom
- Interior features: One dining area; One living area; No fireplace
Neighborhood map
What this means for you Summary
Snapshot
- This is a 1-bed/1.0-bath single-family listed at $160k.
Deal economics
- At list price, monthly cash flow is $-37 ($-440/yr) — negative.
- To cash-flow at today's rent, offer at most $153k (4.1% below list).
- To meet the 1% rule (rent ≥ 1% of price), the offer needs to be $125k (21.6% below list).
- Recommended offer: $125k (21.6% below list) — sets the bar for 1% rule.
- Cap rate 6.0% vs local median 4.8% in El Reno — meaningfully above typical; check what's discounted (condition, days-on-market, listing class) to confirm the premium yield is real.
Location & tenants
- Location reads 67/100 on livability (#95 in OK) — a middle-class / working-renter tenant base. Strengths: cost of living A+, housing A+, crime B+; Watch: health & safety C-, amenities F, commute F.
- El Reno (town): math 12% / reading 15% proficiency, ranked #232 of 270 in OK (top 86%) — low school quality limits family demand, transient renter base, plan for 1-2y turnover; 68% free/reduced lunch — lower-income household profile, screen leases tightly.
- Zoned schools: Hillcrest Es (325 students, 0% FRL); Etta Dale Jhs (math 7% / reading 13%, grade F, #277 of 345 statewide, top 83%, 444 students, 0% FRL); El Reno Hs (math 16% / reading 19%, grade F, #307 of 447 statewide, top 69%, 980 students, 0% FRL) — zoned schools average 0% FRL vs 68% district-wide (68 pts lower); this property's tenant base skews higher-income than the district average.
- Market conditions: Rents rising fast (+4.2%/yr); 281 active listings in the ZIP; 3 comparable units currently listed for rent nearby; rentals leasing fast (median 4d on market — plan ~1-2 weeks tenant-placement turnaround); 260 units permitted in Canadian County in 2024 (0 in 5+ unit buildings).
Forward outlook
- Local home prices are declining (-3.0%/yr); year-one equity from $1k of loan paydown is wiped out by about $5k of value loss. Plan a longer hold.
- Canadian County population projected at +64% by 2050 — long-run rental-demand tailwind backs the buy-and-hold thesis.
Negotiation context
- It's been on market 35 days — a 3% lower offer ($155k) is reasonable based on typical stale-listing flexibility.
- 3 sale attempts since 3y ago; this cycle's ask has dropped $9k (5%) from the opening price — seller is motivated, your offer sets the floor, not the list.
Risks & watch-outs
- Watch-outs: built in 1935 — expect roof / HVAC / electrical / plumbing capex.
- Climate carrying-cost: extreme-heat days projected 7→18/yr by 2055 (HVAC capex compounding) — expect insurance premiums to compound above CPI over the hold.
Questions for the listing agent
- What do current leases actually rent for vs. the listed asking? Can we see a recent rent roll and the last 12 months of T-12 income?
- It's been on market 35 days. Have you received any prior offers? Is the seller open to a 22% concession, seller financing, or rate buy-down credit?
- Built in 1935 — when were the roof, HVAC, electrical panel, plumbing, and water heater last replaced?
- Is there a deadline driving the sale (1031 exchange, divorce, estate, relocation)? That informs how much negotiation room exists.
- Schools are F-rated, which usually means shorter tenancies and higher turnover. Who's the typical renter profile here, and what's been the actual vacancy rate?
- The area grade is low — what's the realistic commute time and amenity access for the typical tenant pool here? Any planned neighborhood developments (good or bad) we should know about?
- What's the average days-on-market for RENTAL listings here right now (not sales)? A rising rental-DOM trend means longer vacancies and softer asking-rent achievability than the comps imply.
- What's the recent tenant-quality profile in this submarket — average credit score on applications, eviction rate, late-payment / NSF rate, and stable-employment percentage? A property-management company in the area should have these aggregated.
- How much new for-sale + rental construction is in the pipeline within 1–3 miles? Heavy new supply typically softens prices + rents 12–24 months out; constrained supply supports both.
Investment metrics
- 1% rule
- 0.78% ✗
- Cap rate
- 6.02%
- Cash-on-cash
- -0.98%
- DSCR
- 0.96
- GRM
- 10.6
CMA / ARV
- ARV (on-the-fly)
- $182,512
- Comps found
- 7
Show comp detail 7 sales within ~0.75 mi
| Address | Dist | Beds/Ba | Sqft | Sold | Price | $/sf | Match |
|---|---|---|---|---|---|---|---|
| 1209 S Macomb Ave | 0.50mi | 2/1.0 (+1) | 1,553 (+4%) | 5mo | $189,000 | $122 | 61 |
| 709 S Hadden St | 0.18mi | 2/1.0 (+1) | 1,297 (-13%) | 5mo | $100,000 | $77 | 60 |
| 811 S Hoff Ave | 0.52mi | 2/1.0 (+1) | 1,448 (-3%) | 7mo | $175,000 | $121 | 59 |
| 820 S Hoff Ave | 0.49mi | 2/1.5 (+1) | 1,458 (-2%) | 13mo | $210,000 | $144 | 55 |
| 802 S Duane Ave | 0.42mi | 2/2.0 (+1) | 1,404 (-6%) | 18mo | $213,500 | $152 | 46 |
| 1508 W Hickory St | 0.70mi | 2/2.0 (+1) | 1,513 (+1%) | 14mo | $195,000 | $129 | 44 |
| 1029 S Miles Ave | 0.30mi | 2/1.5 (+1) | 1,320 (-12%) | 20mo | $150,000 | $114 | 43 |
Match score weights: distance 35% · size 25% · config 20% · recency 20%. Top-matched comps best support the ARV.
Projected returns pro-forma
-3.0% appreciation · 4.19% rent growth · sell at horizon
- IRR
- -16.7%
- Equity multiple
- 0.40×
- Total profit
- $-26,759
- Equity at exit
- $23,842
- IRR
- -6.7%
- Equity multiple
- 0.55×
- Total profit
- $-20,047
- Equity at exit
- $13,825
Cash invested: $44,772 (down + closing). Projections, not guarantees.
Landlord ↔ Tenant lean methodology
- Overall (STATE)
- 83 Strongly Landlord-Friendly
- State Oklahoma
- 83 Strongly Landlord-Friendly · R+20
- County
- — inherits STATE
- City
- — inherits STATE
ZIP-level market 73036
- Home prices YoY
- -3.3%
- Rents YoY
- 4.2%
- Active inventory
- 281
- Price-to-rent
- 10.6×
Monthly cashflow live
- Estimated rent
- $1,253 medium interval (Pro) →
- Mortgage (P&I)
- −$839
- Tax from tax record
- −$121 /mo · $1,457/yr
- Insurance
- −$67
- HOA
- −$0
- Vacancy / Maint / Mgmt
- −$263
- Net cashflow
- $-37
Break-even live
Sensitivity live
| Price | -10% $54 | -5% $9 | +0% $-37 | +5% $-82 | +10% $-127 |
|---|---|---|---|---|---|
| Rent | -10% $-136 | -5% $-86 | +0% $-37 | +5% $13 | +10% $62 |
| Rate | -1.0pp $44 | -0.5pp $4 | base $-37 | +0.5pp $-78 | +1.0pp $-120 |
UW: 25.0% down · 7.5% · 30yr · 1.5% tax · 5.0% vac · 8.0% maint · 8.0% mgmt
Financing live
Cash to close
- Down payment
- $39,975
- Closing costs
- $4,797
- Reserves months
- —
- Total cash needed
- —
Loan-product check · same deal, 3 products live
Conventional
25% down · 7.5% · 30yr
- Down + closing
- —
- Monthly P&I
- —
- Monthly cashflow
- —
- DSCR
- —
- Eligible?
- —
Personal DTI + credit; lowest rate.
DSCR
20% down · 8.5% · 30yr
- Down + closing
- —
- Monthly P&I
- —
- Monthly cashflow
- —
- DSCR
- —
- Eligible?
- —
No personal income docs; deal must DSCR.
Hard money
10% down · 12.0% · 12mo
- Down + closing
- —
- Monthly P&I
- —
- Monthly cashflow
- —
- DSCR
- —
- Eligible?
- —
Short-term bridge; refi at stabilization.
Rent comps 3 comps
| Address | Beds | Baths | Sqft | Rent | $/sqft | DOM | Units | Dist |
|---|---|---|---|---|---|---|---|---|
| 1109 S Ellison Ave El Reno, OK | 2.0 | 2.0 | 1595 | $1,360 | $0.85 | 3d | 1 | 0.43mi |
| 607 N Evans Ave El Reno, OK | 2.0 | 1.0 | 1032 | $1,025 | $0.99 | 3d | 1 | 0.84mi |
| 702 Amity Ln El Reno, OK | 2.0 | 2.0 | 1487 | $1,550 | $1.04 | 3d | 1 | 0.95mi |
Listing history 27 events
-
2026-06-21days on market $159,900 Active 35 DOM
-
2026-06-18days on market $159,900 Active 32 DOM
-
2026-06-17days on market $159,900 Active 31 DOM
-
2026-06-16days on market $159,900 Active 30 DOM
-
2026-06-15pricedays on market $159,900 Active 29 DOM
-
2026-06-13days on market $169,000 Active 27 DOM
-
2026-06-13days on market $169,000 Active 26 DOM
-
2026-06-09days on market $169,000 Active 23 DOM
-
2026-06-08days on market $169,000 Active 22 DOM
-
2026-06-07days on market $169,000 Active 21 DOM
-
2026-06-05days on market $169,000 Active 18 DOM
-
2026-06-03days on market $169,000 Active 17 DOM
-
2026-06-02days on market $169,000 Active 16 DOM
-
2026-06-01days on market $169,000 Active 15 DOM
-
2026-05-31days on market $169,000 Active 14 DOM
-
2026-05-17$169,000 Active
-
2025-09-29historical
-
2025-09-13price $169,900
-
2025-08-18$179,500 Active
-
2023-12-05historical
-
2023-11-25price $168,000
-
2023-11-06price $169,000
-
2023-10-16price $188,900
-
2023-10-06price $189,000
-
2023-10-03price $199,000
-
2023-09-29price $210,000
-
2023-09-27$230,000 Active
ⓘ Source: listings_history table (triggers on properties + properties_extension) + one-shot
backfill from property_details.listing_events for pre-trigger history.
Tax reassessment forecast OK · Resets to sale price
- Current annual tax
- $1,457 · $121/mo
- Projected year-2 tax
- $1,457 · $121/mo
- Expected delta
- $0/yr ($0/mo · 0.0%)
ⓘ Screening estimate from a state-policy table — verify with the county assessor before closing.
Climate risk First Street
- Flood 1/10 Low FEMA zone X (unshaded) · 0% chance over 30 yrs
- Wildfire 1/10 Low
- Heat 5/10 Major 7 d/yr ≥107°F today · 18 d/yr by 30 yrs out
- Wind 2/10 Low 2% chance of damaging wind over 30 yrs
- Air quality 2/10 Low 1 unhealthy d/yr today · 2 by 30 yrs out
Nearby sold comps map
Loading sold comps map…
Walkable amenities ~0.75 mi
Loading nearby amenities…
Taxation est. · year 1
- Rental income
- $15,036
- − Mortgage interest
- −$8,957
- − Property taxes
- −$1,457
- − Insurance
- −$800
- − Repairs & maintenance
- −$1,203
- − Management
- −$1,203
- − Depreciation
- −$4,652
- Taxable loss
- −$3,235
- Est. tax savings @ 24.0%
- +$776
- After-tax cash flow
- $336/yr
For passive investors: Depreciation is non-cash, so a rental often shows a tax loss while cash-flowing — sheltering income. Rental losses are passive: they offset passive income freely, and up to $25,000/yr can offset ordinary (W-2) income if you actively participate and your MAGI is under $100k (phasing out to $0 by $150k); unused losses carry forward. On sale, claimed depreciation is recaptured at up to 25%, and gains may owe capital-gains tax (a 1031 exchange can defer both). Figures are a year-1 estimate at your 24.0% rate — not tax advice; consult a CPA.
Schools (NCES district)
- District
- El Reno
- NCES district ID
- 4010650
- Math proficiency
- 12% ▼ -15.00%
- Reading proficiency
- 15% ▼ -9.00%
- Median HH income
- $44,689
- Composite
- 12.01/100
- National rank
- #9664
- State rank
- #232 of 270 in OK
Livability — El Reno
- Score
- 67/100
- State rank
- #95
- US rank
- #10933
Category grades
Schools grade is shown separately in the Schools card above.
Census & demographics
- Census place
- El Reno, OK
- County
- Canadian County · 154,341 people
- City population
- 21,387
- Metro
- Oklahoma City, OK
- Population (ZIP)
- 21,387
- Household income
- $59,915
- Rent vs Own
- Severe rent burden
- 580.0
Population outlook (Canadian County) Hauer SSP2
- Today (2025)
- 174,062 people
- By 2030
- 195,170 · +12.1%
- By 2040
- 239,293 · +37.5%
- By 2050
- 285,457 · +64.0%
- By 2075
- 403,766 · +132.0%
- By 2100
- 498,766 · +186.5%
Race, ethnicity, and origin ACS 2023
- Neighborhood character
- Predominantly White (65%)
- Race & ethnicity
- White 65% Hispanic / Latino 17% Two or more races 8% Native American 8% Black 6%
- Hispanic origin (detail)
- Mexican 14%
- Common ancestry
- Slovak 2% Serbian 2% Romanian 1%
- Foreign-born
- 5% · Canada
- Languages at home
- 89% English-only · Spanish 10%
Political lean MEDSL · Canadian
- 2024 margin
- Solid R (+40.4) · D 28.8% · R 69.2% · Other 2.0%
- 2008→2024 swing
- +11.9pp toward D · 2008: -52.2pp · 2024: -40.4pp
- All cycles
- 2024: R+40.4 2020: R+43.3 2016: R+51.2 2012: R+54.4 2008: R+52.2
Not yet ingested
- Civics
- —
Market trends
- HPI YoY
- ▼ -11.37%
- Current HPI
- 334.5896
- Rent YoY
- ▲ 4.19%
- Metro
- Oklahoma City, OK
- State GDP YoY
- ▲ 1.55%
- F500 in state
- 6
Industry mix (Fortune 500 HQ in OK)
| Industry | F500 HQs | Revenue |
|---|---|---|
| Energy | 3 | $48B |
|
||
Price history
-26.5% since first listed12 events — show timeline
- 2026-05-17 Listed $169,000 MLSOK
- 2025-09-29 Listing Removed — MLSOK
- 2025-09-13 Price Changed $169,900 MLSOK
- 2025-08-18 Listed $179,500 MLSOK
- 2023-12-05 Listing Removed — MLSOK
- 2023-11-25 Price Changed $168,000 MLSOK
- 2023-11-06 Price Changed $169,000 MLSOK
- 2023-10-16 Price Changed $188,900 MLSOK
- 2023-10-06 Price Changed $189,000 MLSOK
- 2023-10-03 Price Changed $199,000 MLSOK
- 2023-09-29 Price Changed $210,000 MLSOK
- 2023-09-27 Listed $230,000 MLSOK
Property tax history
+10.3%/yrLatest (2025): $1,457 · -2.7% YoY. Source: county tax records.
Cash-flow waterfall
monthlySold comps — $/sqft
last 12 mo · ≤1 miLoading sold comps…