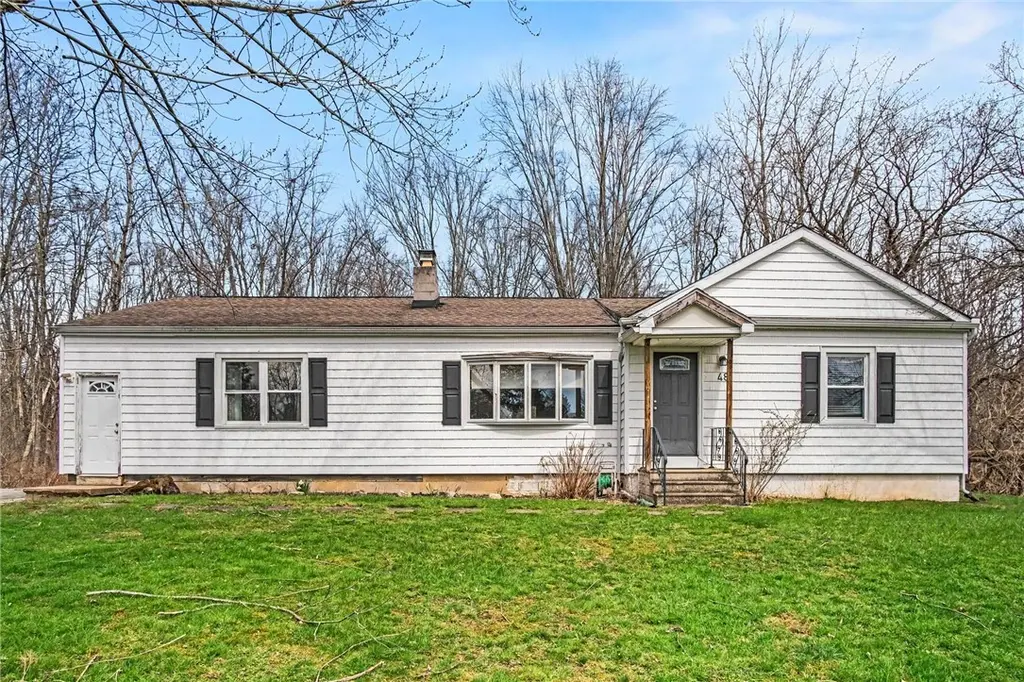
48 Chester Ave · Rochester Institute of Technology, NY
Flood risk 7/10 · Major
- FEMA flood zone
- X (unshaded)
- Chance of flooding over 30 yrs
- 0.76%
- Est. flood insurance / yr
- $473 – $860
Fire risk 3/10 · Minor
- Est. fire insurance / yr
- $691 – $1,283
Heat risk 2/10 · Minimal
- Hot days now (above 95°F)
- 7 days/yr
- Hot days in 30 yrs
- 15 days/yr
Wind risk 1/10 · Minimal
- Chance of severe wind over 30 yrs
- —
Air-quality risk 2/10 · Minimal
- Unhealthy air days now
- 1 days/yr
- Unhealthy air days in 30 yrs
- 1 days/yr
Risk factors via First Street. Map © Google.
Why this score? — see what drove the B grade
The composite is a weighted blend of 9 inputs, each scored 0–100. Each bar is that input's sub-score; the figure is the points it added to the 100-point composite (weight × sub-score).
- Cash flow +25.8/30.0
- ARV discount +14.9/15.0
- DSCR +8.6/10.0
- 1% rule +7.6/10.0
- Schools +4.5/10.0
- Rent growth +4.0/5.0
- Livability +2.5/5.0
- Condition / age +2.5/5.0
- Appreciation +0.0/10.0
$200,000
🖨 Deal sheet 📄 Offer letter ✓ Due diligence
Listing remarks MLS
This lovley home has so much to offer! Located close to amenities. Large open floor plan that is great for entertaining. With 4 bedrooms and 2 baths, it is a rare opportunity! Situated on a large private lot. Enclosed deck in backyard that is great for entertaining!
Key facts
- Wooded views
- Open layout
- Granite countertops
Tags
Neighborhood map
What this means for you Summary
Snapshot
- This is a 4-bed/2.0-bath single-family listed at $200k.
Deal economics
- At list price, monthly cash flow is $430 ($5k/yr) — positive.
- The deal already cash-flows at list — no discount required.
- Meets the 1% rule at list price ($3k rent vs $200k).
- Cap rate 9.2% vs local median 3.8% in Rochester Institute of Technology — top-decile yield for the area; either an underpriced asset or a hidden risk that comps aren't pricing in. Stress-test before assuming the spread holds.
Location & tenants
- Location reads: area grade B — affects rentability + tenant quality, not the cash-flow math above.
- Wheatland-Chili Central School District (suburban): math 46% / reading 57% proficiency, ranked #341 of 590 in NY (top 58%) — acceptable for families but not a draw, mixed tenant base, ~2y average lease.
- Market conditions: Rents rising fast (+6.1%/yr); 48 active listings in the ZIP; 1,169 units permitted in Monroe County in 2024 (591 in 5+ unit buildings).
- At $2,515/mo this rent would consume 46% of the median local household income ($65k/yr) (locally 1161% of renters already pay >50% of income on rent) — very limited rent-growth headroom before tenants either downsize or default.
Forward outlook
- Local home prices are declining (-3.0%/yr); year-one equity from $1k of loan paydown is wiped out by about $6k of value loss. Plan a longer hold.
- Monroe County population projected to shrink 6% by 2050 — rents likely to lag national; underwrite the cash flow, not the appreciation.
- At projected returns (-3.0% appreciation + 6.1% rent growth), your $56k cash investment doubles in ~9 years — after that, you're playing with house money.
Negotiation context
- Only 12 days on market — expect competitive offers; lowballing is unlikely to land.
- 3 sale attempts since 12y ago with the ask held roughly flat each time — persistent listings suggest the price (not the market) is what's stuck; bring a comps-based counter.
- Current owner paid $68k; list at $200k implies a 196% gain — meaningful room to come down on a strong offer.
Risks & watch-outs
- Watch-outs: flood insurance adds $56/mo; built in 1950 — expect roof / HVAC / electrical / plumbing capex.
- Climate carrying-cost: major flood risk — expect insurance premiums to compound above CPI over the hold.
Questions for the listing agent
- Built in 1950 — when were the roof, HVAC, electrical panel, plumbing, and water heater last replaced?
- What's the actual annual flood-insurance premium (NFIP or private), and is the property in a SFHA with mandatory coverage?
- Is there a deadline driving the sale (1031 exchange, divorce, estate, relocation)? That informs how much negotiation room exists.
- What's the average days-on-market for RENTAL listings here right now (not sales)? A rising rental-DOM trend means longer vacancies and softer asking-rent achievability than the comps imply.
- What's the recent tenant-quality profile in this submarket — average credit score on applications, eviction rate, late-payment / NSF rate, and stable-employment percentage? A property-management company in the area should have these aggregated.
- How much new for-sale + rental construction is in the pipeline within 1–3 miles? Heavy new supply typically softens prices + rents 12–24 months out; constrained supply supports both.
Investment metrics
- 1% rule
- 1.26% ✓
- Cap rate
- 9.20%
- Cash-on-cash
- 10.40%
- DSCR
- 1.46
- GRM
- 6.6
CMA / ARV
- ARV (on-the-fly)
- $239,636
- Comps found
- 4
Show comp detail 4 sales within ~0.75 mi
| Address | Dist | Beds/Ba | Sqft | Sold | Price | $/sf | Match |
|---|---|---|---|---|---|---|---|
| 48 Chester Ave | 0.00mi | 4/2.0 | 1,724 (0%) | 0mo | $230,000 | $133 | 100 |
| 3 Celia Dr | 0.52mi | 4/2.0 | 1,720 (-0%) | 1mo | $260,000 | $151 | 75 |
| 35 Ballantyne Rd | 0.40mi | 4/2.0 | 1,906 (+11%) | 12mo | $260,000 | $136 | 53 |
| 3215 E River Rd | 0.58mi | 3/1.5 (-1) | 1,515 (-12%) | 9mo | $210,000 | $139 | 38 |
Match score weights: distance 35% · size 25% · config 20% · recency 20%. Top-matched comps best support the ARV.
Projected returns pro-forma
-3.0% appreciation · 6.06% rent growth · sell at horizon
- IRR
- 1.4%
- Equity multiple
- 1.05×
- Total profit
- $3,079
- Equity at exit
- $29,821
- IRR
- 14.1%
- Equity multiple
- 2.31×
- Total profit
- $73,382
- Equity at exit
- $17,292
Cash invested: $56,000 (down + closing). Projections, not guarantees.
Landlord ↔ Tenant lean methodology
- Overall (STATE)
- 15 Strongly Tenant-Friendly
- State New York
- 15 Strongly Tenant-Friendly · D+10
- County
- — inherits STATE
- City
- — inherits STATE
ZIP-level market 14623
- Rents YoY
- 6.1%
- Active inventory
- 48
- Price-to-rent
- 6.6×
Monthly cashflow live
- Estimated rent
- $2,515 medium interval (Pro) →
- Mortgage (P&I)
- −$1,049
- Tax from tax record
- −$370 /mo · $4,438/yr
- Insurance
- −$83
- Flood insurance flood zone
- −$56 /mo · $666/yr
- HOA
- −$0
- Vacancy / Maint / Mgmt
- −$528
- Net cashflow
- $430
Break-even live
UW: 25.0% down · 7.5% · 30yr · 1.5% tax · 5.0% vac · 8.0% maint · 8.0% mgmt
Financing live
Cash to close
- Down payment
- $50,000
- Closing costs
- $6,000
- Reserves months
- —
- Total cash needed
- —
Loan-product check · same deal, 3 products live
Conventional
25% down · 7.5% · 30yr
- Down + closing
- —
- Monthly P&I
- —
- Monthly cashflow
- —
- DSCR
- —
- Eligible?
- —
Personal DTI + credit; lowest rate.
DSCR
20% down · 8.5% · 30yr
- Down + closing
- —
- Monthly P&I
- —
- Monthly cashflow
- —
- DSCR
- —
- Eligible?
- —
No personal income docs; deal must DSCR.
Hard money
10% down · 12.0% · 12mo
- Down + closing
- —
- Monthly P&I
- —
- Monthly cashflow
- —
- DSCR
- —
- Eligible?
- —
Short-term bridge; refi at stabilization.
Listing history 7 events
-
2026-04-27status Pending
-
2026-04-15$200,000 Active
-
2016-07-14historical 266-char remark
Show marketing remark (266 chars)
This lovley home has so much to offer! Located close to amenities. Large open floor plan that is great for entertaining. With 4 bedrooms and 2 baths, it is a rare opportunity! Situated on a large private lot. Enclosed deck in backyard that is great for entertaining!
-
2015-08-25soldstatus $67,500 266-char remark
Show marketing remark (266 chars)
This lovley home has so much to offer! Located close to amenities. Large open floor plan that is great for entertaining. With 4 bedrooms and 2 baths, it is a rare opportunity! Situated on a large private lot. Enclosed deck in backyard that is great for entertaining!
-
2015-03-03$72,500 266-char remark
Show marketing remark (266 chars)
This lovley home has so much to offer! Located close to amenities. Large open floor plan that is great for entertaining. With 4 bedrooms and 2 baths, it is a rare opportunity! Situated on a large private lot. Enclosed deck in backyard that is great for entertaining!
-
2014-03-03$89,900
-
1993-08-18soldstatus $77,900
ⓘ Source: listings_history table (triggers on properties + properties_extension) + one-shot
backfill from property_details.listing_events for pre-trigger history.
Tax reassessment forecast NY · Partial reset (capped growth)
- Current annual tax
- $4,438 · $370/mo
- Projected year-2 tax
- $4,438 · $370/mo
- Expected delta
- $0/yr ($0/mo · 0.0%)
ⓘ Screening estimate from a state-policy table — verify with the county assessor before closing.
Climate risk First Street
- Flood 7/10 Severe FEMA zone X (unshaded) · 76% chance over 30 yrs
- Wildfire 3/10 Moderate
- Heat 2/10 Low 7 d/yr ≥95°F today · 15 d/yr by 30 yrs out
- Wind 1/10 Low
- Air quality 2/10 Low 1 unhealthy d/yr today · 1 by 30 yrs out
Nearby sold comps map
Loading sold comps map…
Walkable amenities ~0.75 mi
Loading nearby amenities…
Taxation est. · year 1
- Rental income
- $30,184
- − Mortgage interest
- −$11,203
- − Property taxes
- −$4,438
- − Insurance
- −$1,666
- − Repairs & maintenance
- −$2,415
- − Management
- −$2,415
- − Depreciation
- −$5,818
- Taxable income
- $2,229
- Est. tax owed @ 24.0%
- −$535
- After-tax cash flow
- $4,620/yr
For passive investors: Depreciation is non-cash, so a rental often shows a tax loss while cash-flowing — sheltering income. Rental losses are passive: they offset passive income freely, and up to $25,000/yr can offset ordinary (W-2) income if you actively participate and your MAGI is under $100k (phasing out to $0 by $150k); unused losses carry forward. On sale, claimed depreciation is recaptured at up to 25%, and gains may owe capital-gains tax (a 1031 exchange can defer both). Figures are a year-1 estimate at your 24.0% rate — not tax advice; consult a CPA.
Schools (NCES district)
- District
- Wheatland-Chili Central School District
- NCES district ID
- 3631170
- Math proficiency
- 46% ▲ 8.00%
- Reading proficiency
- 57% ▲ 15.00%
- Median HH income
- $57,303
- Composite
- 44.69/100
- National rank
- #2758
- State rank
- #341 of 590 in NY
Livability — Rochester Institute of Technology
No livability data for this city. (Only ~50 U.S. cities are tracked.)
Census & demographics
- County
- Monroe County · 674,131 people
- Metro
- Rochester, NY
- Population (ZIP)
- 26,032
- Household income
- $65,342
- Rent vs Own
- Severe rent burden
- 1161.0
Population outlook (Monroe County) Hauer SSP2
- Today (2025)
- 759,460 people
- By 2030
- 757,154 · -0.3%
- By 2040
- 740,644 · -2.5%
- By 2050
- 714,443 · -5.9%
- By 2075
- 645,883 · -15.0%
- By 2100
- 547,084 · -28.0%
Race, ethnicity, and origin ACS 2023
- Neighborhood character
- Predominantly White (67%)
- Race & ethnicity
- White 67% Asian 15% Black 8% Two or more races 6% Hispanic / Latino 6%
- Hispanic origin (detail)
- Puerto Rican 3%
- Common ancestry
- Romanian 4% Iranian 2% Lithuanian 2%
- Foreign-born
- 14% · China, Canada, Vietnam
- Languages at home
- 84% English-only · Chinese 4% Other Indo-European 3% Spanish 2%
Political lean MEDSL · Monroe
- 2024 margin
- D (+19.1) · D 59.5% · R 40.5%
- 2008→2024 swing
- +1.4pp toward D · 2008: 17.7pp · 2024: 19.1pp
- All cycles
- 2024: D+19.1 2020: D+21.0 2016: D+14.1 2012: D+17.4 2008: D+17.7
Not yet ingested
- Civics
- —
Market trends
- HPI YoY
- ▼ -180.68%
- Current HPI
- 262.8187
- Rent YoY
- ▲ 6.06%
- Metro
- Rochester, NY
- State GDP YoY
- ▲ 2.60%
- F500 in state
- 92
Industry mix (Fortune 500 HQ in NY)
| Industry | F500 HQs | Revenue |
|---|---|---|
| Financial Services | 10 | $950B |
|
||
| Consumer Goods | 9 | $162B |
|
||
| Insurance | 4 | $225B |
|
||
| Telecommunications | 2 | $144B |
|
||
| Pharmaceuticals | 2 | $112B |
|
||
| Media / Entertainment | 2 | $69B |
|
||
Price history
+156.7% since first listed7 events — show timeline
- 2026-04-27 Pending — UNYREIS
- 2026-04-15 Listed $200,000 UNYREIS
- 2016-07-14 Listing Removed — UNYREIS
- 2015-08-25 Sold (MLS) $67,500 UNYREIS
- 2015-03-03 Listed $72,500 UNYREIS
- 2014-03-03 Listed $89,900 UNYREIS
- 1993-08-18 Sold (Public Records) $77,900 Public Records
Property tax history
+6.4%/yrLatest (2025): $4,438 · +1.6% YoY. Source: county tax records.
Cash-flow waterfall
monthlySold comps — $/sqft
last 12 mo · ≤1 miLoading sold comps…