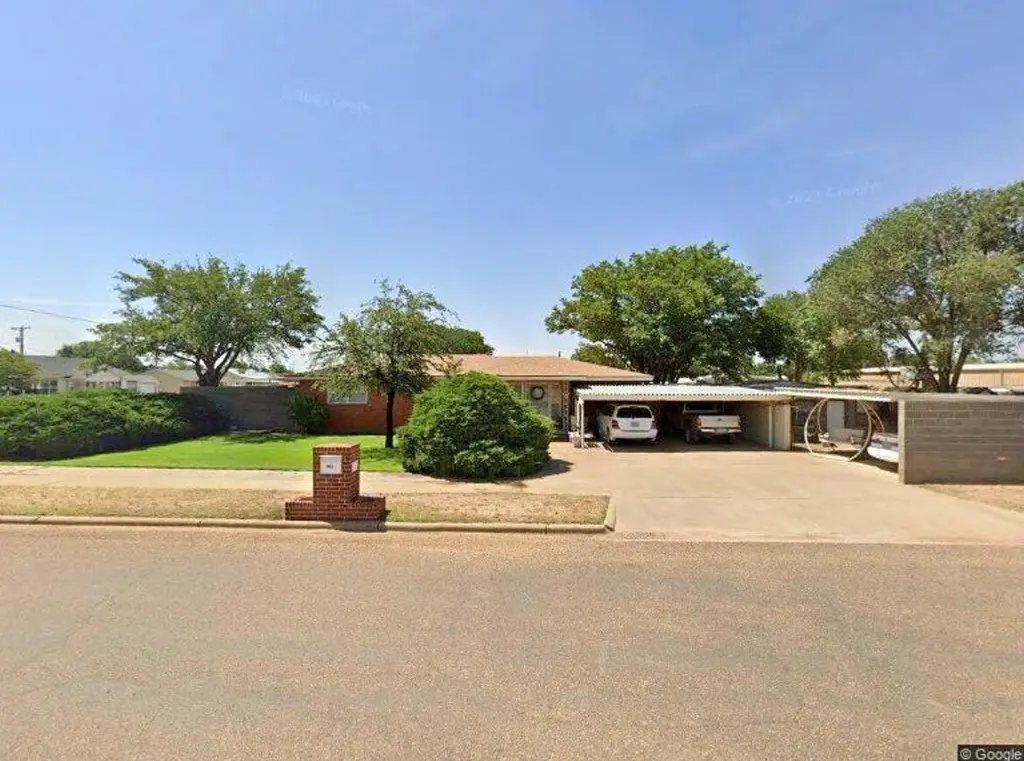
1010 10th St · Shallowater, TX
Flood risk 1/10 · Minimal
- FEMA flood zone
- X (unshaded)
- Chance of flooding over 30 yrs
- 0.0%
- Est. flood insurance / yr
- $507 – $1,088
Fire risk 7/10 · Major
- Est. fire insurance / yr
- $1,222 – $2,270
Heat risk 5/10 · Moderate
- Hot days now (above 99°F)
- 6 days/yr
- Hot days in 30 yrs
- 18 days/yr
Wind risk 2/10 · Minimal
- Chance of severe wind over 30 yrs
- —
Air-quality risk 2/10 · Minimal
- Unhealthy air days now
- 1 days/yr
- Unhealthy air days in 30 yrs
- 1 days/yr
Risk factors via First Street. Map © Google.
Why this score? — see what drove the C- grade
The composite is a weighted blend of 9 inputs, each scored 0–100. Each bar is that input's sub-score; the figure is the points it added to the 100-point composite (weight × sub-score).
- ARV discount +15.0/15.0
- Appreciation +10.0/10.0
- Cash flow +7.4/30.0
- Schools +6.0/10.0
- Livability +3.7/5.0
- Rent growth +2.5/5.0
- Condition / age +2.5/5.0
- 1% rule +1.7/10.0
- DSCR +1.6/10.0
$239,000
🖨 Deal sheet 📄 Offer letter ✓ Due diligence
Listing remarks
Nestled in the heart of Shallowater, this charming 4-bedroom, 1-bath home offers a rare opportunity to own a piece of small-town tradition in the highly sought-after Shallowater ISD. Located directly across from the elementary school — a true cornerstone of the community — this home is full of character, memories, and potential. The possibilities are endless for someone looking to create a special place to call home. With its unbeatable location, spacious layout, and deep roots in a wonderful neighborhood, this property is perfect for buyers who value community, convenience, and the timeless charm of an established home. Make an appointment with your favorite realtor today!
Key facts
- 0.26 acre lot
- Garage
- Built 1960
Property features AI
Finance
- Other: Property has asphalt road frontage on a public maintained city street
- HOA & community: No community features listed
Exterior
- Parking: Attached carport; Carport with 4 spaces; Driveway
- Utilities: Public water; Public sewer; Electricity available; Sewer connected; Water connected
- Home design: Single family residence; One story; Residential property; Single Family zoning
- Construction: Brick veneer construction; Composition roof; Slab foundation; Built as a single-story home
- Exterior features: Private yard; Back yard; City lot; Shed(s); Workshop; Storm door(s); Fenced with block fencing
Interior
- Flooring: Carpet; Vinyl
- Bathrooms: 1 full bathroom
- Heating & cooling: Central heating; Central air; Ceiling fan(s)
- Interior features: Breakfast bar; Ceiling fans
- Laundry & utility: Inside laundry
Neighborhood map
What this means for you Summary
Snapshot
- This is a 3-bed/2.0-bath single-family listed at $239k.
Deal economics
- At list price, monthly cash flow is $-305 ($-4k/yr) — negative.
- To cash-flow at today's rent, offer at most $185k (22.6% below list).
- To meet the 1% rule (rent ≥ 1% of price), the offer needs to be $159k (33.4% below list).
- Recommended offer: $159k (33.4% below list) — sets the bar for 1% rule.
Location & tenants
- Location reads 73/100 on livability (#207 in TX) — a middle-class / working-renter tenant base. Strengths: crime A+, cost of living A+, housing A+; Watch: health & safety C-, amenities F, commute F.
- Shallowater ISD (town): math 73% / reading 66% proficiency, ranked #18 of 826 in TX (top 2%) — acceptable for families but not a draw, mixed tenant base, ~2y average lease.
- Zoned schools: Shallowater El (330 students, 39% FRL); Shallowater Middle (math 75% / reading 64%, grade A, #63 of 1,662 statewide, top 4%, 500 students, 37% FRL); Shallowater H S (math 67% / reading 72%, grade B, #119 of 1,632 statewide, top 9%, 542 students, 37% FRL) — zoned schools at 38% FRL track the district average.
- Market conditions: 116 active listings in the ZIP; 5 comparable units currently listed for rent nearby; rentals leasing fast (median 14d on market — plan ~1-2 weeks tenant-placement turnaround); 2,219 units permitted in Lubbock County in 2024 (252 in 5+ unit buildings).
Forward outlook
- In year one you build about $26k of equity ($2k loan paydown + $24k appreciation (10.0% local appreciation)).
- Lubbock County population projected at +39% by 2050 — long-run rental-demand tailwind backs the buy-and-hold thesis.
- By year 2, paydown + projected appreciation supports a ~$41k cash-out refi (75% LTV) — recoverable capital for the next deal without selling this one.
Negotiation context
- It's been on market 39 days — a 3% lower offer ($232k) is reasonable based on typical stale-listing flexibility.
Risks & watch-outs
- Climate carrying-cost: major wildfire risk; extreme-heat days projected 6→18/yr by 2055 (HVAC capex compounding) — expect insurance premiums to compound above CPI over the hold.
Questions for the listing agent
- What do current leases actually rent for vs. the listed asking? Can we see a recent rent roll and the last 12 months of T-12 income?
- It's been on market 39 days. Have you received any prior offers? Is the seller open to a 33% concession, seller financing, or rate buy-down credit?
- Built in 1960 — when were the roof, HVAC, electrical panel, plumbing, and water heater last replaced?
- Is there a deadline driving the sale (1031 exchange, divorce, estate, relocation)? That informs how much negotiation room exists.
- Schools are A-rated — typically a magnet for longer-tenancy family renters. What's the average tenant stay here, and is there a school-zone premium baked into asking?
- What's the average days-on-market for RENTAL listings here right now (not sales)? A rising rental-DOM trend means longer vacancies and softer asking-rent achievability than the comps imply.
- What's the recent tenant-quality profile in this submarket — average credit score on applications, eviction rate, late-payment / NSF rate, and stable-employment percentage? A property-management company in the area should have these aggregated.
- How much new for-sale + rental construction is in the pipeline within 1–3 miles? Heavy new supply typically softens prices + rents 12–24 months out; constrained supply supports both.
Investment metrics
- 1% rule
- 0.67% ✗
- Cap rate
- 4.76%
- Cash-on-cash
- -5.47%
- DSCR
- 0.76
- GRM
- 12.5
CMA / ARV
- ARV (median comp)
- $377,992
- List price
- $239,000
- Delta
- -36.77%
- Verdict
- UNDERPRICED
- Comps
- 1 within 2.0 mi
Projected returns pro-forma
10.0% appreciation · 3.0% rent growth · sell at horizon
- IRR
- 20.4%
- Equity multiple
- 2.65×
- Total profit
- $110,689
- Equity at exit
- $215,310
- IRR
- 18.6%
- Equity multiple
- 6.10×
- Total profit
- $341,192
- Equity at exit
- $464,324
Cash invested: $66,920 (down + closing). Projections, not guarantees.
Landlord ↔ Tenant lean methodology
- Overall (STATE)
- 87 Strongly Landlord-Friendly
- State Texas
- 87 Strongly Landlord-Friendly · R+5
- County
- — inherits STATE
- City
- — inherits STATE
ZIP-level market 79363
- Home prices YoY
- 7.3%
- Active inventory
- 116
- Price-to-rent
- 12.5×
Monthly cashflow live
- Estimated rent
- $1,591 high interval (Pro) →
- Mortgage (P&I)
- −$1,253
- Tax from tax record
- −$209 /mo · $2,512/yr
- Insurance
- −$100
- HOA
- −$0
- Vacancy / Maint / Mgmt
- −$334
- Net cashflow
- $-305
Break-even live
UW: 25.0% down · 7.5% · 30yr · 1.5% tax · 5.0% vac · 8.0% maint · 8.0% mgmt
Financing live
Cash to close
- Down payment
- $59,750
- Closing costs
- $7,170
- Reserves months
- —
- Total cash needed
- —
Loan-product check · same deal, 3 products live
Conventional
25% down · 7.5% · 30yr
- Down + closing
- —
- Monthly P&I
- —
- Monthly cashflow
- —
- DSCR
- —
- Eligible?
- —
Personal DTI + credit; lowest rate.
DSCR
20% down · 8.5% · 30yr
- Down + closing
- —
- Monthly P&I
- —
- Monthly cashflow
- —
- DSCR
- —
- Eligible?
- —
No personal income docs; deal must DSCR.
Hard money
10% down · 12.0% · 12mo
- Down + closing
- —
- Monthly P&I
- —
- Monthly cashflow
- —
- DSCR
- —
- Eligible?
- —
Short-term bridge; refi at stabilization.
Rent comps 5 comps
| Address | Beds | Baths | Sqft | Rent | $/sqft | DOM | Units | Dist |
|---|---|---|---|---|---|---|---|---|
| 1406 15th St Shallowater, TX | 3.0 | 2.0 | 1548 | $1,600 | $1.03 | 13d | 1 | 0.53mi |
| 1408 15th St Unit B Shallowater, TX | 3.0 | 2.0 | 1548 | $1,600 | $1.03 | 13d | 1 | 0.54mi |
| 1403 17th St Unit 1 Shallowater, TX | 3.0 | 2.0 | 1550 | $1,700 | $1.10 | 13d | 1 | 0.63mi |
| 1405 17th St Unit A Shallowater, TX | 3.0 | 2.0 | 1305 | $1,525 | $1.17 | 13d | 1 | 0.64mi |
| 1407 17th St Unit A Shallowater, TX | 3.0 | 2.0 | 1306 | $1,500 | $1.15 | 21d | 1 | 0.65mi |
Listing history 19 events
-
2026-06-18days on market $239,000 Active 39 DOM
-
2026-06-17days on market $239,000 Active 38 DOM
-
2026-06-16price $239,000 Active 37 DOM
-
2026-06-16days on market $244,000 Active 37 DOM
-
2026-06-15pricedays on market $244,000 Active 36 DOM
-
2026-06-14days on market $249,000 Active 34 DOM
-
2026-06-13days on market $249,000 Active 33 DOM
-
2026-06-10days on market $249,000 Active 31 DOM
-
2026-06-09days on market $249,000 Active 30 DOM
-
2026-06-08days on market $249,000 Active 29 DOM
-
2026-06-07pricedays on market $249,000 Active 28 DOM
-
2026-06-05days on market $254,000 Active 25 DOM
-
2026-06-03days on market $254,000 Active 24 DOM
-
2026-06-02days on market $254,000 Active 23 DOM
-
2026-06-01days on market $254,000 Active 22 DOM
-
2026-05-31days on market $254,000 Active 21 DOM
-
2026-05-30pricedays on market $254,000 Active 20 DOM
-
2026-05-11$259,000 Active 694-char remark
-
1994-01-01soldstatus
ⓘ Source: listings_history table (triggers on properties + properties_extension) + one-shot
backfill from property_details.listing_events for pre-trigger history.
Tax reassessment forecast TX · Resets to sale price
- Current annual tax
- $2,512 · $209/mo
- Projected year-2 tax
- $4,374 · $364/mo
- Expected delta
- +$1,862/yr (+$155/mo · 74.1%)
ⓘ Screening estimate from a state-policy table — verify with the county assessor before closing.
Climate risk First Street
- Flood 1/10 Low FEMA zone X (unshaded) · 0% chance over 30 yrs
- Wildfire 7/10 Severe
- Heat 5/10 Major 6 d/yr ≥99°F today · 18 d/yr by 30 yrs out
- Wind 2/10 Low
- Air quality 2/10 Low 1 unhealthy d/yr today · 1 by 30 yrs out
Nearby sold comps map
Loading sold comps map…
Walkable amenities ~0.75 mi
Loading nearby amenities…
Taxation est. · year 1
- Rental income
- $19,093
- − Mortgage interest
- −$13,388
- − Property taxes
- −$2,512
- − Insurance
- −$1,195
- − Repairs & maintenance
- −$1,527
- − Management
- −$1,527
- − Depreciation
- −$6,953
- Taxable loss
- −$8,009
- Est. tax savings @ 24.0%
- +$1,922
- After-tax cash flow
- $-1,742/yr
For passive investors: Depreciation is non-cash, so a rental often shows a tax loss while cash-flowing — sheltering income. Rental losses are passive: they offset passive income freely, and up to $25,000/yr can offset ordinary (W-2) income if you actively participate and your MAGI is under $100k (phasing out to $0 by $150k); unused losses carry forward. On sale, claimed depreciation is recaptured at up to 25%, and gains may owe capital-gains tax (a 1031 exchange can defer both). Figures are a year-1 estimate at your 24.0% rate — not tax advice; consult a CPA.
Schools (NCES district)
- District
- Shallowater ISD
- NCES district ID
- 4839870
- Math proficiency
- 73% ▲ 2.00%
- Reading proficiency
- 66% ▲ 9.00%
- Median HH income
- $57,288
- Composite
- 59.69/100
- National rank
- #903
- State rank
- #18 of 826 in TX
Livability — Shallowater
- Score
- 73/100
- State rank
- #207
- US rank
- #5236
Category grades
Schools grade is shown separately in the Schools card above.
Census & demographics
- Census place
- Shallowater, TX
- City population
- 283,030
- Population (ZIP)
- 5,831
Population outlook (Lubbock County) Hauer SSP2
- Today (2025)
- 345,960 people
- By 2030
- 371,449 · +7.4%
- By 2040
- 424,539 · +22.7%
- By 2050
- 481,150 · +39.1%
- By 2075
- 633,467 · +83.1%
- By 2100
- 746,853 · +115.9%
Race, ethnicity, and origin ACS 2023
- Neighborhood character
- Predominantly White (69%)
- Race & ethnicity
- White 69% Hispanic / Latino 27% Two or more races 20%
- Hispanic origin (detail)
- Mexican 23%
- Common ancestry
- Lithuanian 5% Slovak 3% Romanian 2%
- Foreign-born
- 3% · Canada
- Languages at home
- 84% English-only · Spanish 16%
Political lean MEDSL · Lubbock
- 2024 margin
- Solid R (+39.5) · D 29.7% · R 69.2% · Other 1.0%
- 2008→2024 swing
- -2.8pp toward R · 2008: -36.7pp · 2024: -39.5pp
- All cycles
- 2024: R+39.5 2020: R+32.2 2016: R+38.4 2012: R+40.9 2008: R+36.7
Not yet ingested
- Civics
- —
Market trends
- HPI YoY
- ▲ 19.76%
- Current HPI
- 289.7445
- Rent YoY
- —
- Metro
- —
- State GDP YoY
- ▲ 3.95%
- F500 in state
- 110
Industry mix (Fortune 500 HQ in TX)
| Industry | F500 HQs | Revenue |
|---|---|---|
| Energy | 16 | $1,198B |
|
||
| Technology | 5 | $198B |
|
||
| Engineering / Construction | 4 | $72B |
|
||
| Energy Services | 3 | $60B |
|
||
| Utilities | 3 | $41B |
|
||
| Healthcare | 2 | $330B |
|
||
Price history
-7.7% since first listed6 events — show timeline
- 2026-06-16 Price Changed $239,000 LARMLS
- 2026-06-15 Price Changed $244,000 LARMLS
- 2026-06-05 Price Changed $249,000 LARMLS
- 2026-05-29 Price Changed $254,000 LARMLS
- 2026-05-11 Listed $259,000 LARMLS
- 1994-01-01 Sold (Public Records) — Public Records
Property tax history
+4.6%/yrLatest (2025): $2,512 · +10.0% YoY. Source: county tax records.
Cash-flow waterfall
monthlySold comps — $/sqft
last 12 mo · ≤1 miLoading sold comps…