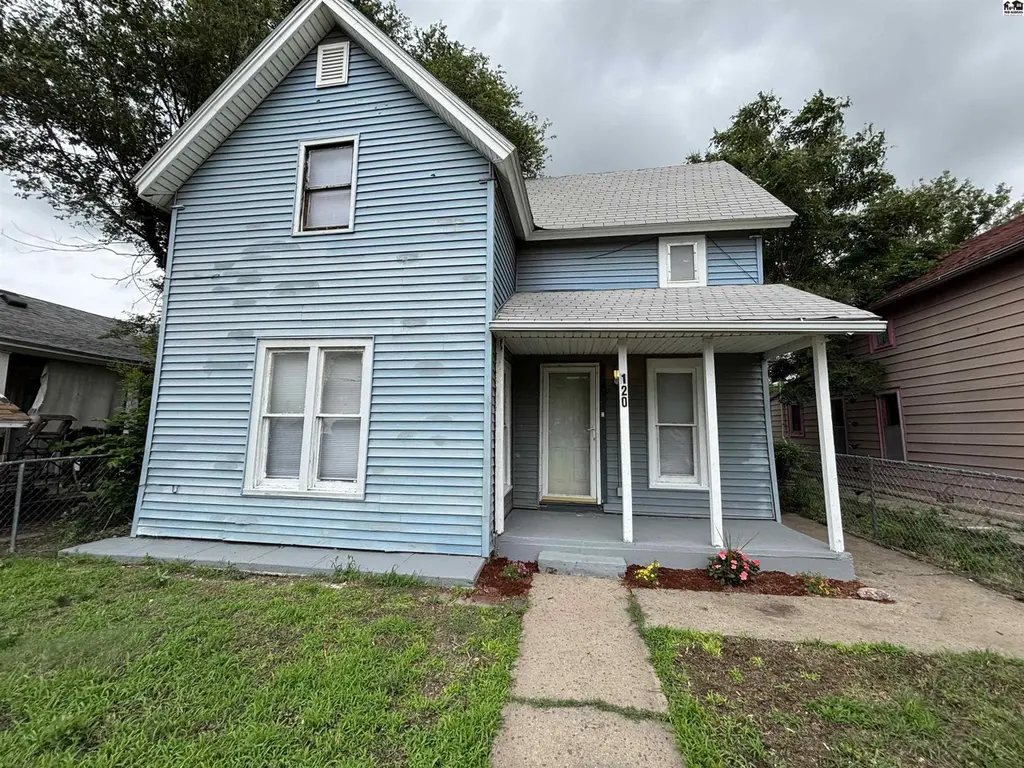
120 W 6th Ave · Hutchinson, KS
Flood risk 1/10 · Minimal
- FEMA flood zone
- X
- Chance of flooding over 30 yrs
- 0.0%
- Est. flood insurance / yr
- $507 – $1,088
Fire risk 3/10 · Minor
- Est. fire insurance / yr
- $1,154 – $2,142
Heat risk 5/10 · Moderate
- Hot days now (above 105°F)
- 7 days/yr
- Hot days in 30 yrs
- 18 days/yr
Wind risk 2/10 · Minimal
- Chance of severe wind over 30 yrs
- —
Air-quality risk 2/10 · Minimal
- Unhealthy air days now
- 1 days/yr
- Unhealthy air days in 30 yrs
- 1 days/yr
Risk factors via First Street. Map © Google.
Why this score? — see what drove the B- grade
The composite is a weighted blend of 9 inputs, each scored 0–100. Each bar is that input's sub-score; the figure is the points it added to the 100-point composite (weight × sub-score).
- Cash flow +30.0/30.0
- DSCR +10.0/10.0
- 1% rule +9.2/10.0
- ARV discount +7.5/15.0
- Livability +3.5/5.0
- Rent growth +3.1/5.0
- Condition / age +2.5/5.0
- Schools +1.7/10.0
- Appreciation +0.0/10.0
$60,000
🖨 Deal sheet 📄 Offer letter ✓ Due diligence
Listing remarks MLS
3 Bed 1 bath 1,132 sq ft home is a Move In Ready, great property for an Investment or Personal Home Ownership. This home has had recent updates such as flooring, paint, new window units (cool and heat) and kitchen countertop to name a few. This is an all electric home with a large back yard and alley access. It is priced right so you can live affordably and build nice equity as you go or as a turn key rental. Make your appointment today! Call Terry @ 620-217-1443
Key facts
- Alley access
- All electric home
- Large back yard
Tags
Property features AI
Finance
- Other:
- Financial info:
- HOA & community:
Exterior
- Parking:
- Security:
- Utilities: Public utilities; Septic tank for sewer
- Home design: Single-family onsite-built home
- Construction: Composition roof; No basement; No foundation details listed
- Exterior features: One-and-a-half story layout; Storage structure on the property; Storm door(s)
Interior
- Kitchen:
- Bedrooms:
- Flooring:
- Bathrooms: 1 full bathroom
- Heating & cooling: Electric heating; Other heating; Electric cooling; Wall/window air conditioning units
- Interior features: No built-in appliances listed
- Laundry & utility: Laundry on the main floor in a separate room with 220V equipment
Neighborhood map
What this means for you Summary
Snapshot
- This is a 2-bed/1.0-bath single-family listed at $60k.
Deal economics
- At list price, monthly cash flow is $246 ($3k/yr) — positive.
- The deal already cash-flows at list — no discount required.
- Meets the 1% rule at list price ($849 rent vs $60k).
Location & tenants
- Location reads 69/100 on livability (#199 in KS) — a middle-class / working-renter tenant base. Strengths: cost of living A+, housing A+, health & safety B+; Watch: crime D+, employment D+, amenities F.
- Hutchinson Public Schools (town): math 15% / reading 25% proficiency, ranked #157 of 169 in KS (top 93%) — low school quality limits family demand, transient renter base, plan for 1-2y turnover.
- Zoned schools: Hutchinson Middle School 8 (math 11% / reading 22%, grade F, #172 of 219 statewide, top 79%, 295 students, 70% FRL); Hutchinson High School (math 11% / reading 19%, grade F, #249 of 327 statewide, top 79%, 1,299 students, 62% FRL).
- Market conditions: Rents rising (+2.5%/yr); 68 active listings in the ZIP; 40 units permitted in Reno County in 2024 (0 in 5+ unit buildings).
Forward outlook
- Local home prices are declining (-3.0%/yr); year-one equity from $415 of loan paydown is wiped out by about $2k of value loss. Plan a longer hold.
- Reno County population projected to shrink 6% by 2050 — rents likely to lag national; underwrite the cash flow, not the appreciation.
- At projected returns (-3.0% appreciation + 2.5% rent growth), your $17k cash investment doubles in ~8 years — after that, you're playing with house money.
Negotiation context
- Only 11 days on market — expect competitive offers; lowballing is unlikely to land.
- 3 sale attempts since 19y ago with the ask held roughly flat each time — persistent listings suggest the price (not the market) is what's stuck; bring a comps-based counter.
- Current owner paid $14k; list at $60k implies a 329% gain — meaningful room to come down on a strong offer.
Risks & watch-outs
- Watch-outs: built in 1890 — expect roof / HVAC / electrical / plumbing capex.
- Climate carrying-cost: extreme-heat days projected 7→18/yr by 2055 (HVAC capex compounding) — expect insurance premiums to compound above CPI over the hold.
Questions for the listing agent
- Built in 1890 — when were the roof, HVAC, electrical panel, plumbing, and water heater last replaced?
- Is there a deadline driving the sale (1031 exchange, divorce, estate, relocation)? That informs how much negotiation room exists.
- Schools are D-rated, which usually means shorter tenancies and higher turnover. Who's the typical renter profile here, and what's been the actual vacancy rate?
- Crime grade is D in this area — have there been break-ins, vandalism, or insurance claims at this property in the last 3 years? What carrier currently insures it and at what premium?
- What's the average days-on-market for RENTAL listings here right now (not sales)? A rising rental-DOM trend means longer vacancies and softer asking-rent achievability than the comps imply.
- What's the recent tenant-quality profile in this submarket — average credit score on applications, eviction rate, late-payment / NSF rate, and stable-employment percentage? A property-management company in the area should have these aggregated.
- How much new for-sale + rental construction is in the pipeline within 1–3 miles? Heavy new supply typically softens prices + rents 12–24 months out; constrained supply supports both.
Investment metrics
- 1% rule
- 1.42% ✓
- Cap rate
- 11.21%
- Cash-on-cash
- 17.54%
- DSCR
- 1.78
- GRM
- 5.9
CMA / ARV
No comps found within radius.
Projected returns pro-forma
-3.0% appreciation · 2.46% rent growth · sell at horizon
- IRR
- 8.4%
- Equity multiple
- 1.33×
- Total profit
- $5,482
- Equity at exit
- $8,946
- IRR
- 17.1%
- Equity multiple
- 2.38×
- Total profit
- $23,133
- Equity at exit
- $5,188
Cash invested: $16,800 (down + closing). Projections, not guarantees.
Landlord ↔ Tenant lean methodology
- Overall (STATE)
- 83 Strongly Landlord-Friendly
- State Kansas
- 83 Strongly Landlord-Friendly · R+10
- County
- — inherits STATE
- City
- — inherits STATE
ZIP-level market 67501
- Rents YoY
- 2.5%
- Active inventory
- 68
- Price-to-rent
- 5.9×
Monthly cashflow live
- Estimated rent
- $849 medium interval (Pro) →
- Mortgage (P&I)
- −$315
- Tax from tax record
- −$86 /mo · $1,028/yr
- Insurance
- −$25
- HOA
- −$0
- Vacancy / Maint / Mgmt
- −$178
- Net cashflow
- $246
Break-even live
UW: 25.0% down · 7.5% · 30yr · 1.5% tax · 5.0% vac · 8.0% maint · 8.0% mgmt
Financing live
Cash to close
- Down payment
- $15,000
- Closing costs
- $1,800
- Reserves months
- —
- Total cash needed
- —
Loan-product check · same deal, 3 products live
Conventional
25% down · 7.5% · 30yr
- Down + closing
- —
- Monthly P&I
- —
- Monthly cashflow
- —
- DSCR
- —
- Eligible?
- —
Personal DTI + credit; lowest rate.
DSCR
20% down · 8.5% · 30yr
- Down + closing
- —
- Monthly P&I
- —
- Monthly cashflow
- —
- DSCR
- —
- Eligible?
- —
No personal income docs; deal must DSCR.
Hard money
10% down · 12.0% · 12mo
- Down + closing
- —
- Monthly P&I
- —
- Monthly cashflow
- —
- DSCR
- —
- Eligible?
- —
Short-term bridge; refi at stabilization.
Listing history 8 events
-
2026-06-19days on market $60,000 Active 11 DOM
-
2026-06-18days on market $60,000 Active 10 DOM
-
2026-06-17days on market $60,000 Active 9 DOM
-
2026-06-16days on market $60,000 Active 8 DOM
-
2026-06-15days on market $60,000 Active 7 DOM
-
2026-06-14days on market $60,000 Active 5 DOM
-
2026-06-12days on market $60,000 Active 4 DOM
-
2026-06-09$60,000 Active 1 DOM
ⓘ Source: listings_history table (triggers on properties + properties_extension) + one-shot
backfill from property_details.listing_events for pre-trigger history.
Tax reassessment forecast KS · Resets to sale price
- Current annual tax
- $1,028 · $86/mo
- Projected year-2 tax
- $1,028 · $86/mo
- Expected delta
- $0/yr ($0/mo · 0.0%)
ⓘ Screening estimate from a state-policy table — verify with the county assessor before closing.
Climate risk First Street
- Flood 1/10 Low FEMA zone X · 0% chance over 30 yrs
- Wildfire 3/10 Moderate
- Heat 5/10 Major 7 d/yr ≥105°F today · 18 d/yr by 30 yrs out
- Wind 2/10 Low
- Air quality 2/10 Low 1 unhealthy d/yr today · 1 by 30 yrs out
Nearby sold comps map
Loading sold comps map…
Walkable amenities ~0.75 mi
Loading nearby amenities…
Taxation est. · year 1
- Rental income
- $10,192
- − Mortgage interest
- −$3,361
- − Property taxes
- −$1,028
- − Insurance
- −$300
- − Repairs & maintenance
- −$815
- − Management
- −$815
- − Depreciation
- −$1,745
- Taxable income
- $2,126
- Est. tax owed @ 24.0%
- −$510
- After-tax cash flow
- $2,437/yr
For passive investors: Depreciation is non-cash, so a rental often shows a tax loss while cash-flowing — sheltering income. Rental losses are passive: they offset passive income freely, and up to $25,000/yr can offset ordinary (W-2) income if you actively participate and your MAGI is under $100k (phasing out to $0 by $150k); unused losses carry forward. On sale, claimed depreciation is recaptured at up to 25%, and gains may owe capital-gains tax (a 1031 exchange can defer both). Figures are a year-1 estimate at your 24.0% rate — not tax advice; consult a CPA.
Schools (NCES district)
- District
- Hutchinson Public Schools
- NCES district ID
- 2007620
- Math proficiency
- 15% ▼ -9.00%
- Reading proficiency
- 25% ▼ -2.00%
- Median HH income
- $39,264
- Composite
- 16.85/100
- National rank
- #9145
- State rank
- #157 of 169 in KS
Livability — Hutchinson
- Score
- 69/100
- State rank
- #199
- US rank
- #8963
Category grades
Schools grade is shown separately in the Schools card above.
Census & demographics
- Census place
- Hutchinson, KS
- County
- Reno County · 47,704 people
- City population
- 47,704
- Metro
- Hutchinson, KS
- Population (ZIP)
- 24,605
- Household income
- $50,859
- Rent vs Own
- Severe rent burden
- 724.0
Population outlook (Reno County) Hauer SSP2
- Today (2025)
- 63,149 people
- By 2030
- 62,477 · -1.1%
- By 2040
- 60,901 · -3.6%
- By 2050
- 59,679 · -5.5%
- By 2075
- 58,792 · -6.9%
- By 2100
- 56,900 · -9.9%
Race, ethnicity, and origin ACS 2023
- Neighborhood character
- Predominantly White (74%)
- Race & ethnicity
- White 74% Hispanic / Latino 15% Two or more races 10% Black 5% Native American 2%
- Hispanic origin (detail)
- Mexican 11%
- Common ancestry
- Lithuanian 2% Slovak 2% Scotch-Irish 1%
- Foreign-born
- 3% · Canada
- Languages at home
- 92% English-only · Spanish 4% German/W. Germanic 2% French/Haitian/Cajun 1%
Political lean MEDSL · Reno
- 2024 margin
- Solid R (+34.5) · D 31.8% · R 66.2% · Other 2.0%
- 2008→2024 swing
- -11.1pp toward R · 2008: -23.4pp · 2024: -34.5pp
- All cycles
- 2024: R+34.5 2020: R+34.3 2016: R+36.0 2012: R+31.5 2008: R+23.4
Not yet ingested
- Civics
- —
Market trends
- HPI YoY
- ▼ -132.71%
- Current HPI
- 203.1673
- Rent YoY
- ▲ 2.46%
- Metro
- Hutchinson, KS
- State GDP YoY
- —
- F500 in state
- 0
Price history
+640.7% since first listed6 events — show timeline
- 2026-06-08 Listed $60,000 SCKMLS as Distributed by MLS Grid
- 2026-06-08 Listed $60,000 MKMLS as distributed by MLS GRID
- 2007-10-12 Sold (MLS) — MKMLS as distributed by MLS GRID
- 2007-10-01 Sold (Public Records) $14,000 Public Records
- 2007-09-25 Listed $14,900 MKMLS as distributed by MLS GRID
- 1991-03-01 Sold (Public Records) $8,100 Public Records
Property tax history
+7.5%/yrLatest (2025): $1,028 · +49.9% YoY. Source: county tax records.
Cash-flow waterfall
monthlySold comps — $/sqft
last 12 mo · ≤1 miLoading sold comps…