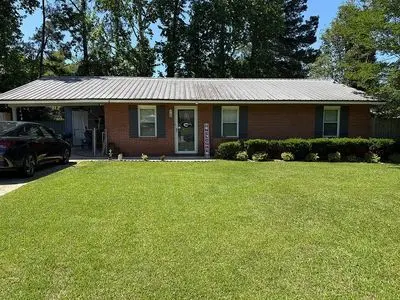
1408 Parsons Ct · Columbus, GA
Flood risk 1/10 · Minimal
- FEMA flood zone
- X (unshaded)
- Chance of flooding over 30 yrs
- 0.0%
- Est. flood insurance / yr
- $507 – $1,088
Fire risk 4/10 · Minor
- Est. fire insurance / yr
- $963 – $1,789
Heat risk 6/10 · Moderate
- Hot days now (above 106°F)
- 7 days/yr
- Hot days in 30 yrs
- 18 days/yr
Wind risk 6/10 · Moderate
- Chance of severe wind over 30 yrs
- 73.0%
Air-quality risk 4/10 · Minor
- Unhealthy air days now
- 6 days/yr
- Unhealthy air days in 30 yrs
- 7 days/yr
Risk factors via First Street. Map © Google.
Why this score? — see what drove the F grade
The composite is a weighted blend of 9 inputs, each scored 0–100. Each bar is that input's sub-score; the figure is the points it added to the 100-point composite (weight × sub-score).
- Cash flow +15.6/30.0
- DSCR +4.8/10.0
- Rent growth +3.3/5.0
- 1% rule +3.2/10.0
- Livability +3.2/5.0
- Condition / age +2.5/5.0
- Schools +2.2/10.0
- ARV discount +0.0/15.0
- Appreciation +0.0/10.0
$215,900
🖨 Deal sheet (PDF) 📄 Offer letter ✓ Due diligence
Listing remarks
Adorable, well maintained, brick home located on a quiet cul-de-sac in a desirable North Columbus location. Districted schools are: Double Churches Elementary, Veterans Middle and Northside High School. Close to the interstate, shopping and entertainment. This 1074 s. f. all brick home sits on a slab and has 3 bedrooms and 1.5 baths. Features include: hard flooring throughout (LVP and ceramic tile); fresh paint throughout; ceiling fans in every room; updated fixtures; double pane windows; wooden blinds; ample closet and cabinet space; custom doors; metal roof; granite countertops and stone backsplash; and, so much more! Stainless steel stove and dishwasher stay with home. * No other applia
Key facts
- Fresh paint
- Quiet cul-de-sac
- Ceiling fans
Tags
Neighborhood map
What this means for you Summary
Snapshot
- This is a 3-bed/1.5-bath single-family listed at $216k.
Deal economics
- At list price, monthly cash flow is $93 ($1k/yr) — positive.
- The deal already cash-flows at list — no discount required.
- To meet the 1% rule (rent ≥ 1% of price), the offer needs to be $176k (18.4% below list).
- Recommended offer: $176k (18.4% below list) — sets the bar for 1% rule.
- Cap rate 6.8% vs local median 4.7% in Columbus — top-decile yield for the area; either an underpriced asset or a hidden risk that comps aren't pricing in. Stress-test before assuming the spread holds.
Location & tenants
- Location reads 64/100 on livability (#254 in GA) — a middle-class / working-renter tenant base. Strengths: cost of living A+, housing A+, health & safety B; Watch: amenities D+, crime F, commute F.
- Muscogee County (urban): math 21% / reading 30% proficiency, ranked #120 of 174 in GA (top 69%) — low school quality limits family demand, transient renter base, plan for 1-2y turnover; 61% free/reduced lunch — lower-income household profile, screen leases tightly.
- Zoned schools: North Columbus Elementary (math 41% / reading 49%, grade D-, #327 of 1,228 statewide, top 27%, 745 students, 52% FRL); Veterans Memorial Middle School (math 28% / reading 41%, grade F, #196 of 470 statewide, top 42%, 648 students, 47% FRL); Northside High School (math 15% / reading 37%, grade F, #175 of 424 statewide, top 42%, 1,402 students, 32% FRL) — zoned schools average 44% FRL vs 61% district-wide (17 pts lower); this property's tenant base skews higher-income than the district average.
- Market conditions: Rents rising (+3.0%/yr); 337 active listings in the ZIP; 6 comparable units currently listed for rent nearby; rentals at typical pace (median 24d on market — plan ~3-4 weeks tenant-placement turnaround); 291 units permitted in Muscogee County in 2024 (30 in 5+ unit buildings).
- This rent runs 32% of the median local income ($66k/yr) — at the standard rent-burdened threshold; future hikes will face affordability resistance.
Forward outlook
- Local home prices are declining (-3.0%/yr); year-one equity from $1k of loan paydown is wiped out by about $6k of value loss. Plan a longer hold.
- Muscogee County population projected at +15% by 2050 — modest demand growth; plan on rents tracking national, not racing it.
Negotiation context
- It's been on market 34 days — a 3% lower offer ($209k) is reasonable based on typical stale-listing flexibility.
- Current owner paid $107k; list at $216k implies a 102% gain — meaningful room to come down on a strong offer.
Risks & watch-outs
- Climate carrying-cost: major wind risk, 73% chance of damaging wind over 30y; extreme-heat days projected 7→18/yr by 2055 (HVAC capex compounding) — expect insurance premiums to compound above CPI over the hold.
Questions for the listing agent
- It's been on market 34 days. Have you received any prior offers? Is the seller open to a 18% concession, seller financing, or rate buy-down credit?
- Built in 1971 — when were the roof, HVAC, electrical panel, plumbing, and water heater last replaced?
- Is there a deadline driving the sale (1031 exchange, divorce, estate, relocation)? That informs how much negotiation room exists.
- Schools are F-rated, which usually means shorter tenancies and higher turnover. Who's the typical renter profile here, and what's been the actual vacancy rate?
- Crime grade is F in this area — have there been break-ins, vandalism, or insurance claims at this property in the last 3 years? What carrier currently insures it and at what premium?
- The area grade is low — what's the realistic commute time and amenity access for the typical tenant pool here? Any planned neighborhood developments (good or bad) we should know about?
- What's the average days-on-market for RENTAL listings here right now (not sales)? A rising rental-DOM trend means longer vacancies and softer asking-rent achievability than the comps imply.
- What's the recent tenant-quality profile in this submarket — average credit score on applications, eviction rate, late-payment / NSF rate, and stable-employment percentage? A property-management company in the area should have these aggregated.
- How much new for-sale + rental construction is in the pipeline within 1–3 miles? Heavy new supply typically softens prices + rents 12–24 months out; constrained supply supports both.
Investment metrics
- 1% rule
- 0.82% ✗
- Cap rate
- 6.81%
- Cash-on-cash
- 1.84%
- DSCR
- 1.08
- GRM
- 10.2
CMA / ARV
- ARV (on-the-fly)
- $184,728
- Comps found
- 7
Show comp detail 7 sales within ~0.75 mi
| Address | Dist | Beds/Ba | Sqft | Sold | Price | $/sf | Match |
|---|---|---|---|---|---|---|---|
| 8250 Bryn Mawr Ln | 0.11mi | 3/1.5 | 1,053 (-2%) | 1mo | $99,900 | $95 | 90 |
| 8334 Canaan Dr | 0.45mi | 3/2.0 | 1,107 (+3%) | 4mo | $190,000 | $172 | 69 |
| 8102 Trafalgar Way | 0.20mi | 4/2.0 (+1) | 1,225 (+14%) | 4mo | $218,000 | $178 | 57 |
| 8445 Canaan Dr | 0.57mi | 2/2.0 (-1) | 1,128 (+5%) | 10mo | $204,000 | $181 | 50 |
| 7945 Shinn Dr | 0.72mi | 3/2.0 | 1,142 (+6%) | 11mo | $185,000 | $162 | 45 |
| 8401 Canaan Cir | 0.53mi | 3/2.0 | 1,222 (+14%) | 8mo | $224,900 | $184 | 43 |
| 8428 Canaan Dr | 0.51mi | 3/2.0 | 1,182 (+10%) | 24mo | $177,000 | $150 | 38 |
Match score weights: distance 35% · size 25% · config 20% · recency 20%. Top-matched comps best support the ARV.
Projected returns pro-forma
-3.0% appreciation · 3.04% rent growth · sell at horizon
- IRR
- -13.4%
- Equity multiple
- 0.52×
- Total profit
- $-29,107
- Equity at exit
- $32,191
- IRR
- -4.5%
- Equity multiple
- 0.70×
- Total profit
- $-17,833
- Equity at exit
- $18,667
Cash invested: $60,452 (down + closing). Projections, not guarantees.
Landlord ↔ Tenant lean methodology
- Overall (STATE)
- 90 Strongly Landlord-Friendly
- State Georgia
- 90 Strongly Landlord-Friendly · R+3
- County
- — inherits STATE
- City
- — inherits STATE
ZIP-level market 31904
- Rents YoY
- 3.0%
- Active inventory
- 337
- Price-to-rent
- 10.2×
Monthly cashflow live
- Estimated rent
- $1,761 high interval (Pro) →
- Mortgage (P&I)
- −$1,132
- Tax from tax record
- −$76 /mo · $915/yr
- Insurance
- −$90
- HOA
- −$0
- Lot rent
- −$0
- Vacancy / Maint / Mgmt
- −$370
- Net cashflow
- $93
Break-even live
Sensitivity live
| Price | -10% $215 | -5% $154 | +0% $93 | +5% $32 | +10% $-30 |
|---|---|---|---|---|---|
| Rent | -10% $-46 | -5% $23 | +0% $93 | +5% $162 | +10% $232 |
| Rate | -1.0pp $201 | -0.5pp $148 | base $93 | +0.5pp $37 | +1.0pp $-20 |
UW: 25.0% down · 7.5% · 30yr · 1.5% tax · 5.0% vac · 8.0% maint · 8.0% mgmt
Financing live
Cash to close
- Down payment
- $53,975
- Closing costs
- $6,477
- Reserves months
- —
- Total cash needed
- —
Loan-product check · same deal, 3 products live
Conventional
25% down · 7.5% · 30yr
- Down + closing
- —
- Monthly P&I
- —
- Monthly cashflow
- —
- DSCR
- —
- Eligible?
- —
Personal DTI + credit; lowest rate.
DSCR
20% down · 8.5% · 30yr
- Down + closing
- —
- Monthly P&I
- —
- Monthly cashflow
- —
- DSCR
- —
- Eligible?
- —
No personal income docs; deal must DSCR.
Hard money
10% down · 12.0% · 12mo
- Down + closing
- —
- Monthly P&I
- —
- Monthly cashflow
- —
- DSCR
- —
- Eligible?
- —
Short-term bridge; refi at stabilization.
Rent comps 6 comps
| Address | Beds | Baths | Sqft | Rent | $/sqft | DOM | Units | Dist |
|---|---|---|---|---|---|---|---|---|
| 1218 Vesper Dr Columbus, GA | 3.0 | 2.0 | 1053 | $1,350 | $1.28 | 23d | 1 | 0.38mi |
| 1335 Maplebrook Dr Unit A Columbus, GA | 2.0 | 1.0 | 1200 | $2,195 | $1.83 | 46d | 1 | 0.38mi |
| 1700 Fountain Ct Columbus, GA | 1.0–2.0 | 1.5–2.0 | 1313 | $1,893 | $1.44 | 16d | 11 | 0.41mi |
| 7911 Cleo Dr Columbus, GA | 3.0 | 2.0 | 1400 | $1,750 | $1.25 | 16d | 1 | 1.03mi |
| 2866 Hobbs Rd Columbus, GA | 3.0 | 2.0 | 1500 | $1,850 | $1.23 | 46d | 1 | 1.30mi |
| 2700 Double Churches Rd Columbus, GA | 1.0–3.0 | 1.0–2.0 | 1150 | $1,808 | $1.57 | 16d | 17 | 1.40mi |
Listing history 20 events
-
2026-06-22days on market $215,900 Active 34 DOM
-
2026-06-18days on market $215,900 Active 31 DOM
-
2026-06-17days on market $215,900 Active 30 DOM
-
2026-06-16price $215,900 Active 29 DOM
-
2026-06-16days on market $219,900 Active 29 DOM
-
2026-06-15days on market $219,900 Active 28 DOM
-
2026-06-14days on market $219,900 Active 26 DOM
-
2026-06-13days on market $219,900 Active 25 DOM
-
2026-06-10days on market $219,900 Active 23 DOM
-
2026-06-09days on market $219,900 Active 22 DOM
-
2026-06-08days on market $219,900 Active 21 DOM
-
2026-06-07days on market $219,900 Active 20 DOM
-
2026-06-05days on market $219,900 Active 17 DOM
-
2026-06-03days on market $219,900 Active 16 DOM
-
2026-06-02days on market $219,900 Active 15 DOM
-
2026-06-01days on market $219,900 Active 14 DOM
-
2026-05-31days on market $219,900 Active 13 DOM
-
2026-05-30days on market $219,900 Active 12 DOM
-
2026-05-19$219,900 Active
-
2017-05-31soldstatus $107,000
ⓘ Source: listings_history table (triggers on properties + properties_extension) + one-shot
backfill from property_details.listing_events for pre-trigger history.
Tax reassessment forecast GA · Resets to sale price
- Current annual tax
- $915 · $76/mo
- Projected year-2 tax
- $1,986 · $166/mo
- Expected delta
- +$1,071/yr (+$89/mo · 117.1%)
ⓘ Screening estimate from a state-policy table — verify with the county assessor before closing.
Climate risk First Street
- Flood 1/10 Low FEMA zone X (unshaded) · 0% chance over 30 yrs
- Wildfire 4/10 Moderate
- Heat 6/10 Major 7 d/yr ≥106°F today · 18 d/yr by 30 yrs out
- Wind 6/10 Major 73% chance of damaging wind over 30 yrs
- Air quality 4/10 Moderate 6 unhealthy d/yr today · 7 by 30 yrs out
Nearby sold comps map
Loading sold comps map…
Walkable amenities ~0.75 mi
Loading nearby amenities…
Taxation est. · year 1
- Rental income
- $21,129
- − Mortgage interest
- −$12,094
- − Property taxes
- −$915
- − Insurance
- −$1,080
- − Repairs & maintenance
- −$1,690
- − Management
- −$1,690
- − Depreciation
- −$6,281
- Taxable loss
- −$2,620
- Est. tax savings @ 24.0%
- +$629
- After-tax cash flow
- $1,740/yr
For passive investors: Depreciation is non-cash, so a rental often shows a tax loss while cash-flowing — sheltering income. Rental losses are passive: they offset passive income freely, and up to $25,000/yr can offset ordinary (W-2) income if you actively participate and your MAGI is under $100k (phasing out to $0 by $150k); unused losses carry forward. On sale, claimed depreciation is recaptured at up to 25%, and gains may owe capital-gains tax (a 1031 exchange can defer both). Figures are a year-1 estimate at your 24.0% rate — not tax advice; consult a CPA.
Schools (NCES district)
- District
- Muscogee County
- NCES district ID
- 1303870
- Math proficiency
- 21% ▼ -11.00%
- Reading proficiency
- 30% ▼ -7.00%
- Median HH income
- $41,176
- Composite
- 21.6/100
- National rank
- #8297
- State rank
- #120 of 174 in GA
Livability — Columbus
- Score
- 64/100
- State rank
- #254
- US rank
- #14102
Category grades
Schools grade is shown separately in the Schools card above.
Census & demographics
- Census place
- Columbus, GA
- County
- Muscogee County · 180,764 people
- City population
- 180,764
- Metro
- Columbus, GA-AL
- Population (ZIP)
- 35,405
- Household income
- $66,291
- Rent vs Own
- Severe rent burden
- 2030.0
Population outlook (Muscogee County) Hauer SSP2
- Today (2025)
- 216,729 people
- By 2030
- 224,504 · +3.6%
- By 2040
- 238,318 · +10.0%
- By 2050
- 249,027 · +14.9%
- By 2075
- 264,862 · +22.2%
- By 2100
- 254,786 · +17.6%
Race, ethnicity, and origin ACS 2023
- Neighborhood character
- Diverse neighborhood (Simpson 0.60)
- Race & ethnicity
- White 56% Black 28% Two or more races 8% Hispanic / Latino 7% Asian 2%
- Hispanic origin (detail)
- Mexican 3% Puerto Rican 1%
- Common ancestry
- Slovak 1% Italian 1% Romanian 1%
- Foreign-born
- 5% · Canada, South Korea
- Languages at home
- 93% English-only · Spanish 4% Korean 1% German/W. Germanic 1%
Political lean MEDSL · Muscogee
- 2024 margin
- Strong D (+23.4) · D 61.4% · R 38.0%
- 2008→2024 swing
- +3.7pp toward D · 2008: 19.7pp · 2024: 23.4pp
- All cycles
- 2024: D+23.4 2020: D+24.0 2016: D+18.6 2012: D+21.3 2008: D+19.7
Not yet ingested
- Civics
- —
Market trends
- HPI YoY
- ▼ -152.06%
- Current HPI
- 155.1405
- Rent YoY
- ▲ 3.04%
- Metro
- Columbus, GA-AL
- State GDP YoY
- ▲ 2.66%
- F500 in state
- 28
Industry mix (Fortune 500 HQ in GA)
| Industry | F500 HQs | Revenue |
|---|---|---|
| Paper / Packaging | 2 | $29B |
|
||
| Retail | 1 | $160B |
|
||
| Transportation / Logistics | 1 | $91B |
|
||
| Airlines | 1 | $62B |
|
||
| Consumer Goods | 1 | $47B |
|
||
| Utilities | 1 | $25B |
|
||
Price history
+101.8% since first listed3 events — show timeline
- 2026-06-16 Price Changed $215,900 FSBO.com
- 2026-05-19 Listed $219,900 FSBO.com
- 2017-05-31 Sold (Public Records) $107,000 Public Records
Property tax history
-0.2%/yrLatest (2025): $915 · +0.1% YoY. Source: county tax records.
Cash-flow waterfall
monthlySold comps — $/sqft
last 12 mo · ≤1 miLoading sold comps…